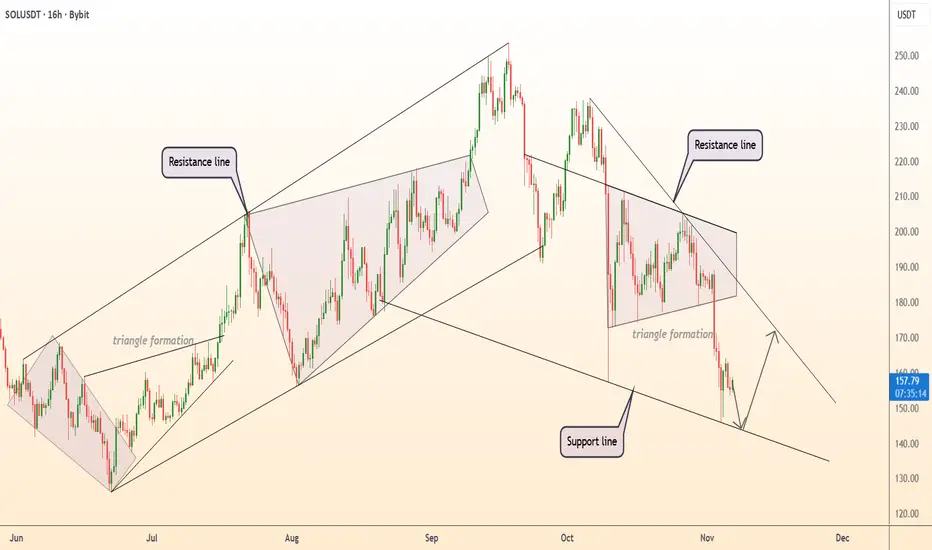
DeGRAM | SOLUSD will test the support line📊 Technical Analysis
● SOL/USD is testing the lower boundary of the descending channel near $150, a key support aligning with the broader bullish trendline from June. The pattern suggests a potential rebound within the channel toward $175–$180 resistance.
● Multiple triangle formations indicate prior consolidation phases before upward moves, reinforcing the likelihood of another medium-term recovery if support holds.
💡 Fundamental Analysis
● Growing institutional activity in Solana’s DeFi and NFT ecosystems continues to support long-term investor confidence, despite short-term volatility.
✨ Summary
● Support: $150. Resistance: $175–$180. A sustained bounce from the lower trendline could trigger a rally toward $190.
-------------------
Share your opinion in the comments and support the idea with a like. Thanks for your support!
Trade ideas
SOL-USDTIt reacted again on the same $150 support,
but we can only see a reversal on the chart 🚨📣
if the static resistance at $165 is broken.
That way, the first target will be $175 and then $185.

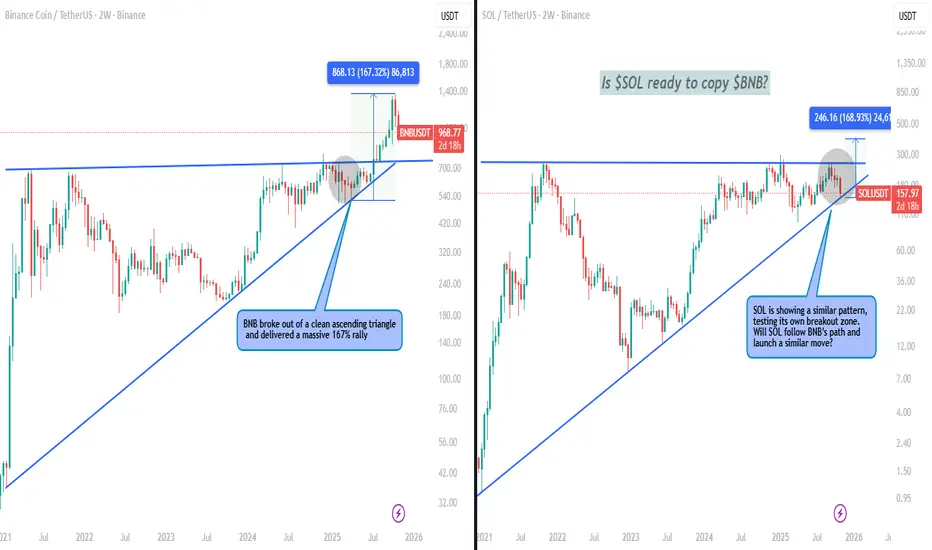
$SOL vs $BNB – History repeating?CRYPTOCAP:BNB broke out of a clean ascending triangle and delivered a massive 167% rally. Right now, CRYPTOCAP:SOL is showing a similar pattern, testing its own breakout zone.
Will SOL follow BNB’s path and launch a similar move? A structure like this could set the stage for a big run if support holds. Share your views—is CRYPTOCAP:SOL ready for its breakout moment?
SOL: One More High… or Goodbye?The Solana bull run that started in December 2022 most likely finished in January 2025. It was a textbook five-wave impulse (extended iii, with i ≈ v). From Jan → Apr 2025 we saw the first leg down (A), and the rally Apr → Sep was merely a corrective (B) move; base case is C down toward $80–50. An alternative allows for one more pop within B (even a small over-throw), but downside resumes after.
Full cycle & proportions
Dec ’22 → Jan ’25: clean 1–2–3–4–5.
Wave 3 shows a classic extension.
Waves 1 and 5 are nearly equal in length.
The run from the bottom is roughly 30–35× (about +3,000%), which statistically argues for a meaningful mid-term correction.
Base correction targets from the whole impulse: 0.382–0.5 Fib → $80–50, aligning with monthly/quarterly imbalances (FVG).
What 2025 looked like
Jan → Apr: first downward leg — wave A.
Apr → Sep 18 (high ~$253): a double zigzag W–X–Y — typical wave B, not a new trend.
Alternative (expanded flat, EFL)
A: Jan → Apr 7 down.
B: Apr → Sep as (A); now forming (B); then (C) up (a minor higher high is possible).
After that, a larger C down into $80–50.
Why I think the rally is done (market context)
TOTAL and BTC likely trace end-phase bull structures (distribution/terminal patterns).
Volume profile on COINBASE:SOLUSD : the heaviest trading sits around $120–200 (HVN/POC) — classic distribution; price often moves below POC afterwards.
Price Action (weekly/monthly): $216–260 is a major resistance that launched the bear market back in Nov 2021. Repeated tests without a weekly/monthly hold above it argue against an immediate breakout.
Fundamentals in two lines
Why a correction now: cycle overextension, liquidity saturation near the top, sensitivity to DXY/real yields and risk-off in US indices.
Why the long-term case survives: high throughput, latency improvements (e.g., Firedancer), growing DeFi/stablecoin/consumer activity. After leverage clears, BINANCE:SOLUSDT historically recovers with high beta.
Levels & invalidation
Base (correction) holds until we get a weekly close > $260–270.
Downside waypoints: $150 → $120 → $95 → $80–50.
Invalidation: sustained hold above $270 with expanding volume — I’d concede an early start of (3) without a deep (2).
Bottom line. With high probability, SOL’s medium-term rally is over; we are in a corrective phase targeting $80–50. The long-term bullish story can resume later — but first the market likely needs to deflate.

SOL - Ranges overview Let's have a look at SOL and its current trading range.
I know a lot of you young traders are still hyped and enjoy trading SOL so I'll give you my take on it.
Personally, I've never had a stake in it and don't plan on getting any merely based on the fact that since its inception a hyped fueled and based crypto - BUT for the sake of trading let's have a look at the chart.
We are currently trading back towards the sellside liquidity sitting around 140$.
IF we fail to hold it expect some more pullback towards 120-100$.
IF we hold the 140$ sellside liquidity range (and BTC manages to reclaim 150K) expect SOL to aggressively retrace towards 216$.
As always PATIENCE...PLAN AND EXECUTE.
Stay safe and never risk more than 1-5% of your capital per trade. The following analysis is merely a price action based analysis and does not constitute financial advice in any form.
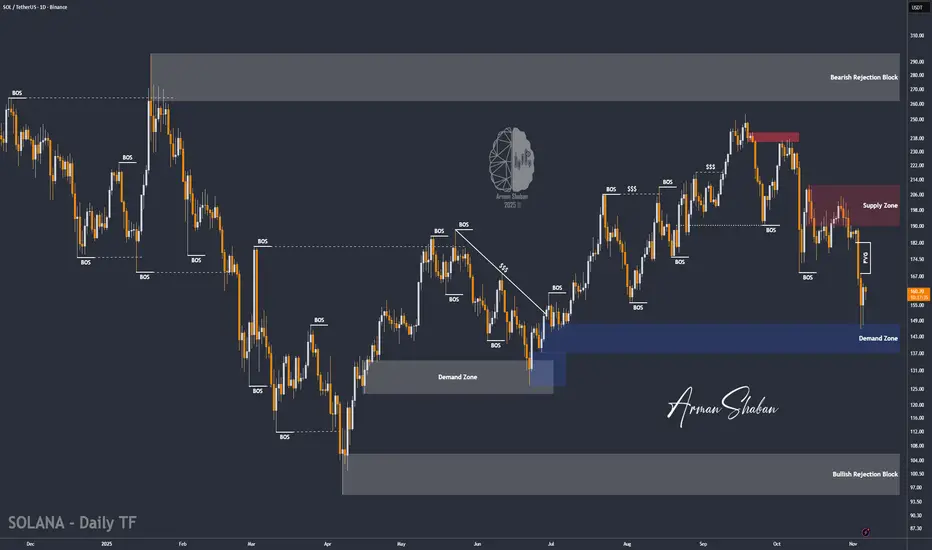
SOL/USDT | Solana Rebounds From $146 – Bulls Back in Control!By analyzing the #Solana chart on the daily timeframe, we can see that after correcting to $146, the price found strong demand and is now trading around $160.
If Solana manages to hold above the key demand zone of $137–$147, we can expect further upside movement. The medium-term targets are $168, $182, and $196. This analysis will be updated soon.
Please support me with your likes and comments to motivate me to share more analysis with you and share your opinion about the possible trend of this chart with me !
Best Regards , Arman Shaban
SOL-USDTThe $156 level is the first support for Solana, and if it breaks, it could move toward $141💰🔽And by holding this support, it could rebound toward $172.

down then back to $250 ?Possible downtrend to $143 support? on a weekly. RSI looks on the downside for the next few months.

The crypto world is just getting started. This is not the end!I am giving more weight to the recent pullback in crypto and I think all currencies are going to hit a higher ceiling from here, so this bearish trend will continue until the end of this week, but this is not the end of it!
SOL/USDT 4H AnalysisSolana continues its bearish correction phase after failing to hold above the premium zone (206–210 USDT).
The price broke market structure (BoS) downward and is currently consolidating below the 186–187 resistance, which used to act as strong support.
EMA and order blocks show clear dominance of sellers — every retest of the red supply zones leads to rejection.
Now we see local demand (blue zone) around 145–155 USDT, where buyers are trying to defend liquidity.
If SOL fails to hold 159–162, the next liquidity sweep could target 145–148 USDT before a potential rebound.
For bullish confirmation, we’d need a strong candle close above 187, ideally with growing volume — that would open the way toward 194–206 zones.
🧭 Trading bias:
Short-term → Neutral to Bearish
Mid-term → Possible long opportunity only if price holds above 162 and breaks 187 with volume.

SOLUSDT | Short Setup | Value Cluster | Nov 5, 2025SOLUSDT | Short Setup | Channel Rejection at VWAP / Value Cluster | Nov 5, 2025
🔹 Thesis Summary
SOL is bouncing inside a descending parallel channel. A push into the 188–203 supply band (VWAP/value cluster) offers a defined-risk short back toward 150/132 as broad crypto remains correlation-heavy and fragile.
🔹 Trade Setup
Bias: Short
Entry Zone: 188–203 (prior supply; confluence with anchored VWAP/upper channel)
Stop Loss: 217 (acceptance above supply → invalidate short idea)
Take-Profits:
TP1: 150 (mid-channel / liquidity shelf)
TP2: 132 (prior reaction / partial-TP on chart)
TP3 (stretch): 114 (channel lower bound / “A+ long” area)
Indicative R:R (mid-fill 195 vs 217):
If filled closer to 1.88, R:R compresses; closer to 203, it expands. Laddering helps execution.
🔹 Narrative & Context
Structure: Clear lower highs/lows within a well-defined downward channel. The 188–203 zone aligns with prior distribution, multiple failed breakouts, and a visible liquidity pocket just under 200.
VWAP & Value: Price frequently mean-reverts to the anchored VWAP from the prior breakdown; 188–195 is the first area where sellers historically regain control.
Correlation: Crypto remains tightly co-moving; beta shocks propagate across majors. Breadth is weakening on alts first—typical of the distribution → correction phase.
Execution: Look for a bounce into 188–203 with positive funding and rising OI (late longs) and fading spot CVD—then fade the move with tight invalidation. A clean break/hold above 217 flips bias.
🔹 Valuation & Context (Pro Metrics, Framed Simply)
Perp Funding → Peer/Historical: Positive/expanding into resistance vs neutral on BTC → crowded long into supply → increases squeeze-then-fade odds → supports short timing.
Open Interest → Regime Check: OI rising with price into 188–203 vs flat spot flows → leverage leading → greater liquidation risk on pullback → aligns with targets 150/132.
SOL/BTC Cross → Relative Strength: Underperformance on bounces vs BTC/ETH → weaker risk appetite for SOL beta → rallies likely sold at value → fits channel-fade plan.
Basis (Perp Premium) → Thresholds: Premium > ~10–15% annualized vs spot → stretched leverage → signals to scale shorts; flat/discount basis → stand aside.
🔹 Contrarian Angle (Your Edge)
Consensus leans “SOL leadership continues.” Our read: supply sits heavy at 188–203, VWAP caps, and leverage rebuilds into resistance. That combination often precedes a second leg lower toward 150 → 132, with an extension to 114 before any durable base. Long-term bull case remains intact after a proper reset (W-base risk).
🔹 Risks
Impulsive risk-on (index squeeze, dovish macro) forcing acceptance above 217.
SOL-specific catalysts (ecosystem launches/flows) that negate supply.
Liquidity gaps/wick risk: thin books can overshoot levels; size and ladder accordingly.
🔹 Macro Considerations
DXY firm + VIX bid support a broader correction; a vol crush or dollar fade weakens the short.
Semis/NQ drive cross-asset beta; strength there argues patience.
BTC dominance up → alt underperformance risk; BTC breakdown, however, accelerates the path to 150/132.
🔹 Bottom Line
Tactical short the rip into 188–203 with hard invalidation at 217. Manage into 150/132, stretch to 114 if macro stays risk-off. Keep sizing conservative, respect correlation, and hedge.
🔹 Forward Path
If this gains traction (10+ likes), I’ll post:
A weekly-frame update of the channel/VWAP map
Playbook if 217 breaks (what flips the bias)
Execution notes (laddering, hedge overlays, basis/funding triggers)
Like & Follow for structured ideas, not signals. I post high-conviction setups here before broader narratives play out.
⚠️ Disclaimer: This is not financial advice. Do your own research. Charts may include AI-assisted enhancements.
🔹 Footnote
Forward P/E: Price divided by expected earnings over the next 12 months. Lower = cheaper relative to profits.
P/FCF (Price-to-Free-Cash-Flow): Price vs. the cash left after investments. A measure of efficiency.
FCF Yield: Free cash flow per share ÷ price per share. Higher = more cash returned for each dollar invested.
ROE (Return on Equity): Net income ÷ shareholder equity. Shows management efficiency with investor capital.
ROIC (Return on Invested Capital): Net income ÷ all invested capital (equity + debt). A purer profitability gauge.
Debt/Equity: Debt divided by equity. <1 usually means balance sheet is conservative.
R:R (Risk-to-Reward): Ratio of expected upside vs. downside. 3:1 = you risk $1 to make $3.

Solana shows potential second‐wave riseIn the previous review, we examined two probable SOL moves. When the price leveled off closer to the 0% move, we performed an urgent analysis of a price reversal down before the move began, as the movement continued within the descending expanding wedge pattern, along the Elliott corrective wave trajectory, indicated in gray. The ascending corridor also formed a bearish flag pattern
Now, the movement is more likely to follow the corrective wave outlined in the previous analysis. A more localized bullish flag has also formed within the pattern, so the move is more likely to go higher
Probable downward movement is along the corrective wave below its base
More detailed analysis, additional charts, and key levels to watch are available on our site

$SOL (DAILY): my LONG has TRIGGERED SL ($165)My CRYPTOCAP:SOL LONG from $187 triggered its STOP LOSSES after three 4-hour candles closed in the EXIT zone, average SL price: $165.
Thankfully a modest-size trade, the confluenced SUPPORT area finally gave way to a wider market bloodshed (including TECH stocks, after TRUMP's #AI chip restrictions on #china yesterday).
The $154 mark has been holding (Fib 0.786), let's see for how long as the STRUCTURE remains BEARISH, a LOWER LOW yesterday following a LOWER HIGH after a Hidden BEAR RSI divergence recently.
The GOLDEN POCKET ($171 to $176) with the lost 200 MA at $180-, this is the immediate resistance zone to cross above before the bias can change to bullish again.
Possible shorts utilizing the resistance mentioned, but I would need some bearish divergences first, not any yet.
💙👽
#solana

SOL 1H OutlookSOL just raided weekly sell-side liquidity and reacted instantly — algorithmic accumulation signature. Looking for bullish continuation into premium levels.
📍Levels
Entry: $156.90 – $159.61
Stop: $145.74
First Target: $168 – $170
Main Target: $189.73 liquidity cluster
✅ Confluence
• Weekly sell-side liquidity swept
• Bullish displacement after the sweep
• Alligator curl + early expansion phase
• Demand zone reclaimed
• Liquidity void above → draw on liquidity
• Fractal shift at lows → accumulation phase signal
As long as price holds above reclaimed liquidity zone, expecting delivery higher.
Partial profits at $168–$170 region, let the rest ride to $189.73. 🚀
#SOL #SmartMoneyConcepts #ICT #BillWilliams #CryptoTrading #PriceAction

SOL USDT LONG SIGNAL ---
⚠️ Disclaimer
This analysis represents personal technical opinion only and is not a buy or sell signal.
Please review the chart carefully and use proper risk management before entering any trade.
---
📢 Signal Alert
🔹 Pair: SOL / USDT
📈 Trade Type: Long
💰 Entry: 158.08
🎯 Take-Profit Targets:
TP1 = 160.69
TP2 = 164.06
TP3 = 167.54
🛑 Stop-Loss: 153.15
📊 Timeframe: 1H
⚖️ Risk/Reward Ratio: 5.7
📌 Suggested Leverage: 5x–10x
🔄 After TP1 is reached, move Stop-Loss to Entry to protect profits.
---
🧠 Technical Analysis Summary:
SOL is currently showing strong bullish momentum, maintaining its structure of higher lows and higher highs.
The price is supported by the EMA50 on the 1H timeframe, which continues to act as a dynamic support zone.
Momentum indicators such as RSI and MACD confirm the ongoing bullish bias — RSI is above the 50 mark and trending upward, indicating increased buying pressure.
The entry at 158.08 lies close to the breakout retest zone, making it an optimal position for a continuation toward upper resistance targets.
The stop-loss at 153.15 is placed below a key support level and swing low to avoid false breakouts.
---
⚙️ Trade Management Tip:
Wait for a bullish confirmation candle (e.g., 1H engulfing or hammer formation) before entry.
Secure partial profits at each TP level, and once TP1 hits, move SL to entry to reduce risk exposure.
---

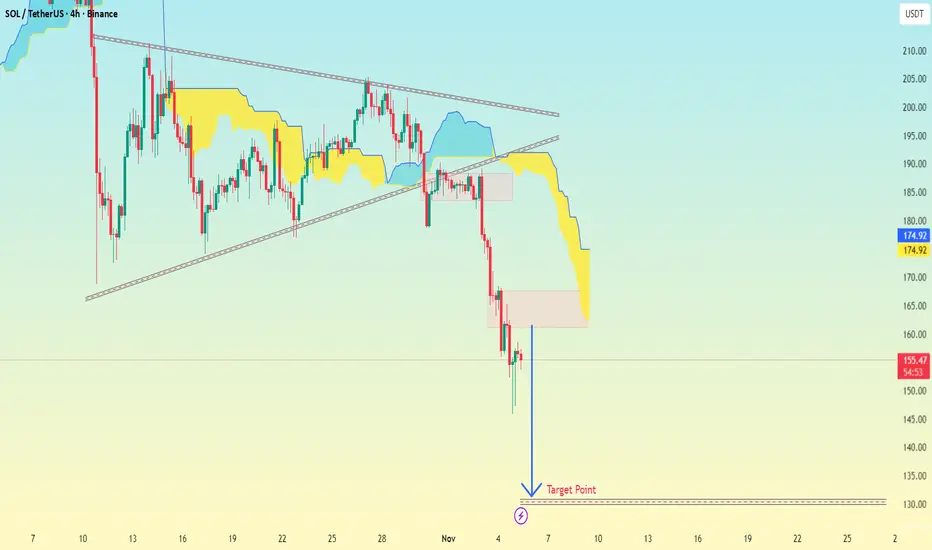
SOL/USDT (Solana vs Tether) Timeframe: 4-hour chart Pattern....SOL/USDT (Solana vs Tether)
Timeframe: 4-hour chart
Exchange: Binance
Analysis tool: Ichimoku Cloud + trendlines
Pattern: my drawn a descending triangle or bearish pennant that recently broke downwards.
Current Price: Around $153.67
Target Point (marked): Around $135 – $137 zone
🎯 Target Zone
From my chart, the “Target Point” label is placed approximately at:
> $135 USDT
This aligns with a measured move projection from the height of the triangle (around $200 down to ~$160), giving a target near $135 — a typical price objective for a bearish breakout.
🧠 Quick Breakdown:
Price broke below support near $160.
The Ichimoku Cloud turned bearish (price below cloud, red span ahead).
Momentum and volume confirm downside continuation.
Target completion likely around $135 – $137, unless support appears earlier.
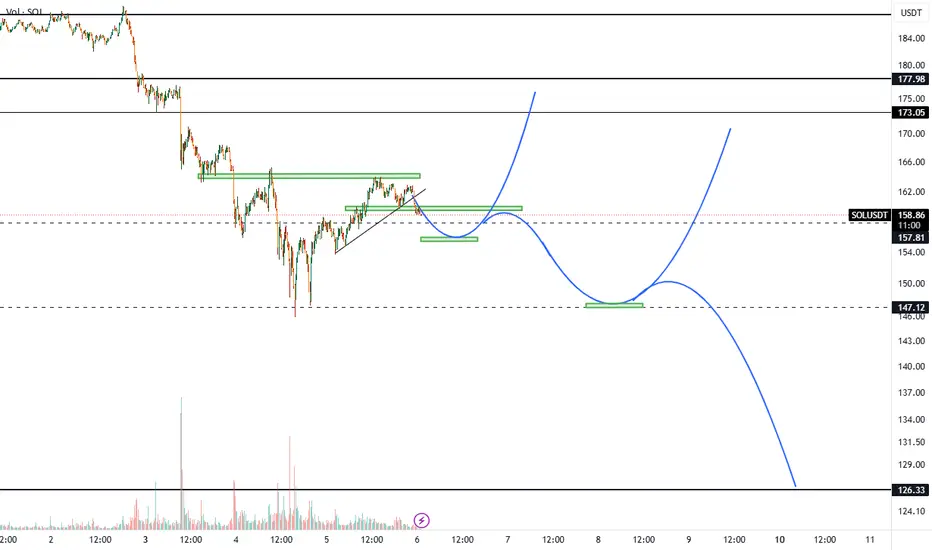
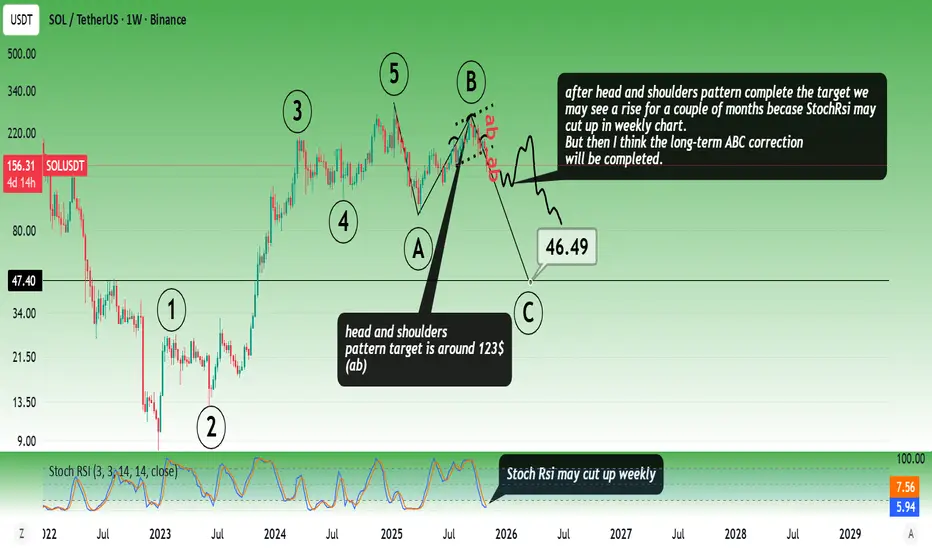
Solana RoadmapAfter the head and shoulders pattern complete the target we
may see a rise for a couple of months becase StochRsi may cut up in weekly chart.
But then I think the long-term ABC correction will be completed.
* The purpose of my graphic drawings is purely educational.
* What i write here is not an investment advice. Please do your own research before investing in any asset.
* Never take my personal opinions as investment advice, you may lose your money.
SOL 4H CRYPTOCAP:SOL 4H Chart
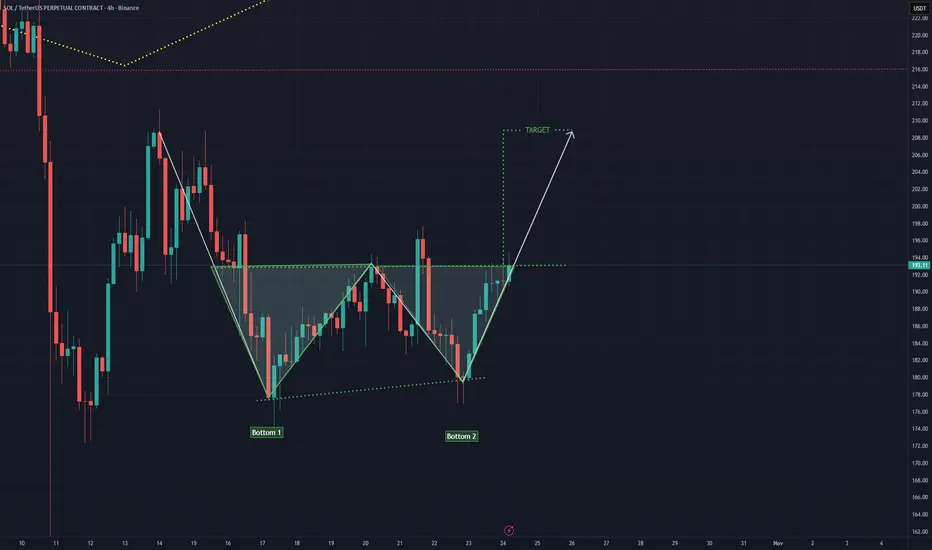
Solana forming a clear Double Bottom pattern signaling a potential trend reversal after the recent pullback.
Price is testing the neckline resistance, and a breakout above could confirm bullish continuation toward the projected target zone.
If confirmed, this setup suggests strong bullish momentum building for $SOL.
#SOL #Solana #Crypto #PriceAction #TradingView
SOLANA: $157 | Key Levels September is usually the Month of Solana
and its Gang of VCs woodstock moment
instead it took a backseat to iron out deals
from tech to fresh capital and TRUMP camp
for nnow it's just allocating tokens for December Big Bad ShowTIME
size em well
as Anatoly is on a series of roadshow PREACHING the new world order of SOLANA

Sol Next StepsBINANCE:SOLUSDT SOL is expected to retrace from $195 toward $175–160, possibly dipping into the $140–150 weekly buy zone before reversing. The chart outlines a bearish correction within a larger bullish structure, targeting $213–222 then $240+. SMA confluence and liquidity zones support a mid-term accumulation before breakout.

SOLUSDTThere is no confirmation about short scenario yet, but I think we are in distribution phase, so I will wait for short opportunity in 190-220$ zone
News about Solana ETF with staking just give more confidence in such scenario
First target is 80$.
Also we have much lower targets but it is too early to say about them
SOL will hit 100 soonAccording to the high timeframe analysis, CHOCH happened at 169 and tapped to the zone below 110 weekly liquidity, followed by a Rally to 240 which was a strong selling zone now it is on the way to hit 100$ or below. We can expect a strong bullish rejection from 80$

Why SOL is my bet for the next leg of the cycle Where some people are afraid and selling, others see an opportunity. Moments like this allow us to accumulate spot positions at good prices. They also help identify obvious market leaders — those who hold stronger than others. Today I will explain why, after analyzing the market, I came to the conclusion that SOL currently looks stronger than Bitcoin and why I’m placing my bet on it.
Last week there were days when SOL dropped less in percentage than BTC. Which is basically nonsense for crypto.
➡️ This is primarily related to the newly launched SOL ETF, which has seen inflows from the very first days. And, you know, this is actually the most successful start for a crypto ETF. Because BTC and ETH saw only outflows during the first weeks.
➡️ What we see on the chart: first — yes, a liquidity divergence on the Money Flow has formed. But this is not a secret to anyone, liquidity really leaves the market during such periods and starts returning closer to the bottom.
➡️ Next — the drop was extremely uneven. Despite the lack of major selling volumes, there are a lot of rumors about liquidations and market makers exiting the market, which in turn removed liquidity and now the price moves 10% per day.
➡️ Also, we see harmony in the selling volumes throughout the entire correction. This means the correction is not near its end and sellers are still in control. But no one said SOL will rocket tomorrow.
The first thing to look at — where the price may potentially reverse. And the first of such levels is $147. This is a key level of one of the ATHs of the current cycle, which later became an important support level.
Below that, there is an order block on the daily timeframe at $135–132. This is where the new impulsive move started back in April this year, therefore the level is important.
➡️ The Supply & Demand indicator shows that major demand has formed around $154–146, confirming the first target where a reaction may occur.
I expect Bitcoin to at least retest $99,000 before showing any meaningful bounce. Therefore, the current target levels for SOL look logical.
Drop a comment if you’re still alive in this market! 👇
