$SOL (DAILY): LON $187 (STOP LOSS: below $170)Longing CRYPTOCAP:SOL here at $187.
Reasoning within 30 minutes in the next post.
Modest stake, SL: two 4-hour candles below $170.
💙👽
Trade ideas

Solana at a Make-or-Break LevelSolana couldn’t sustain momentum above $200 and now holding the critical level $170.
CRYPTOCAP:SOL is sitting at a make-or-break level — failure to reclaim the $200 zone or a clean break below $170 would be a concerning signal for bulls.
A decisive breakdown below this area could trigger a deeper retracement toward $150, with the worst-case scenario being a full retest of the $130 range — aligning with the previous demand zone and high-volume node.
SolanaPrice of Solana has formed a bullish triangle. A classic target would be at around $400. But if it's alseason now like on ZCash then the target should be way higher.

SOL (31/10/25 - Long position) TP1($189.98) - filled "Single Prints" from 30/10/25
TP2($193.64)- confluence (Oct. POC + weekly VWAP + previous week VAH + crucial Fibonacci on 4h time frame), good level to Scalp short if not crazy buying volume (depends on the context)
TP3($199.99) - psychological level, October's VWAP, weekly POC, 4h time frame fibonacci confluence
SL($175.00)

SOL-USDTWith the correction of Bit
Solana also came to test $175 once again and this support prevented the correction well again 🕯🕯
If nothing special happens in the crypto market, it can continue to rise like a flash towards $197-200

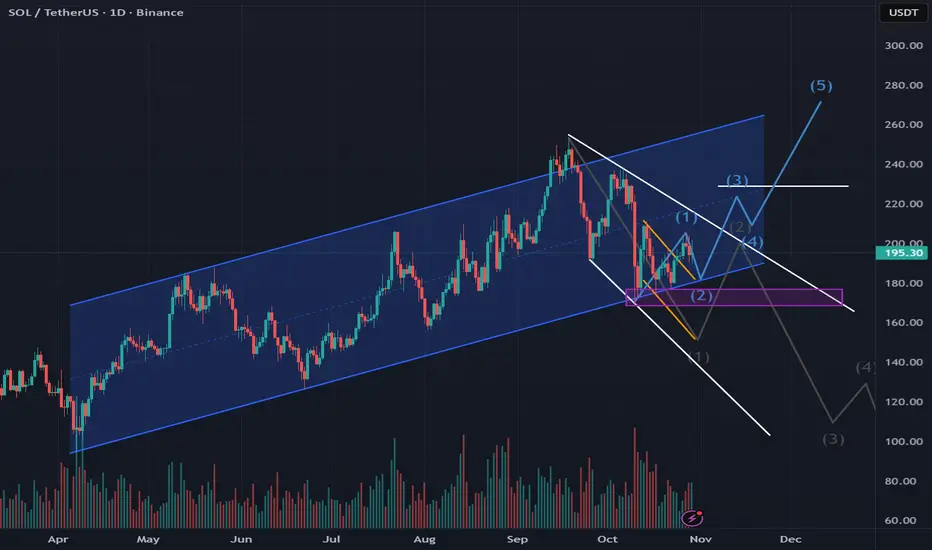
Lingrid | SOLUSDT Continuation Short Pattern BuildingBINANCE:SOLUSDT is consolidating within a defined downward channel after a sequence of lower highs and extended impulse legs. Price action is currently hovering near mid-range resistance, showing hesitation below the descending trendline. A rejection from this level may drive the pair back toward the $169 support, completing the projected move. The overall market tone remains bearish while the channel boundaries continue to confine momentum.
⚠️ Risks:
Sudden short squeezes could trigger a false breakout above $193.
Fed policy commentary this week may increase volatility across risk assets.
Strong crypto inflows could weaken bearish continuation signals.
If this idea resonates with you or you have your own opinion, traders, hit the comments. I’m excited to read your thoughts!


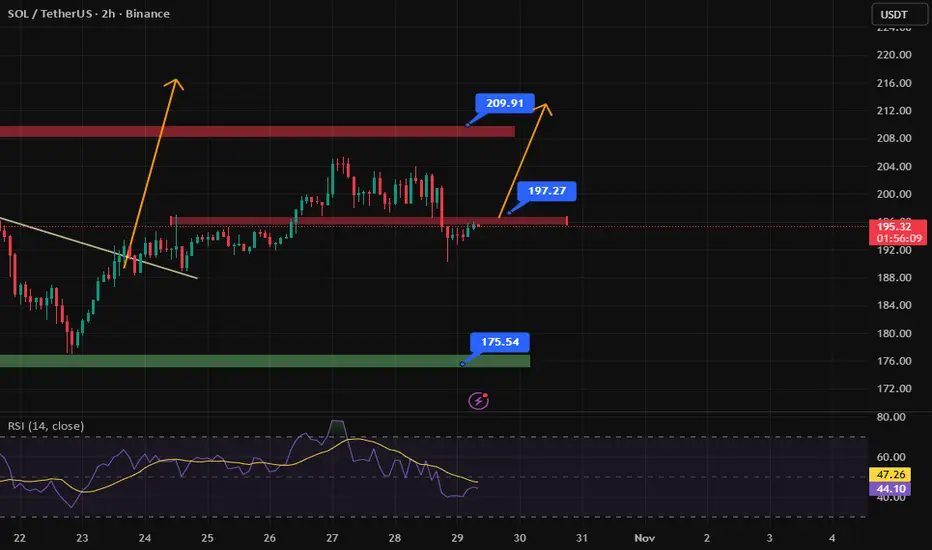
sOL-USDTSolana could still break its resistance at $197 and make a new leg towards $209.
Watch for longs

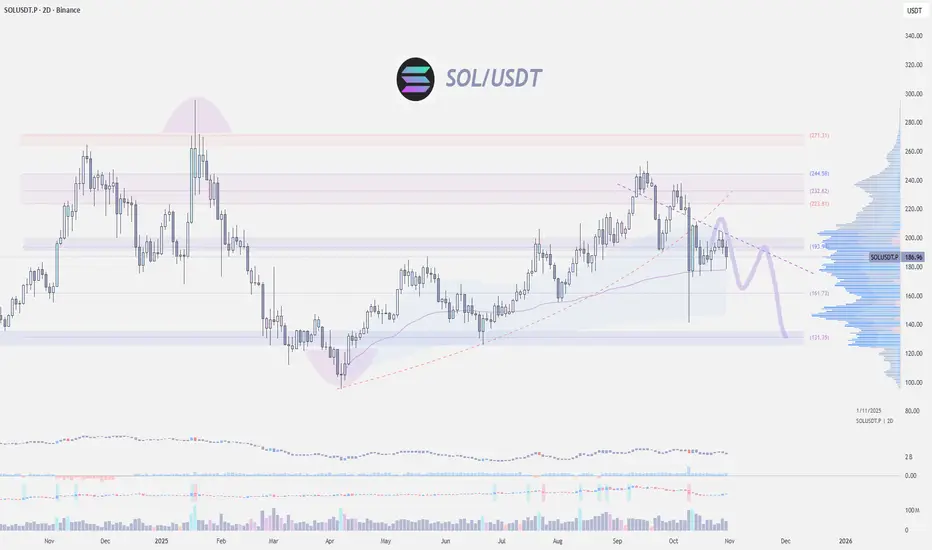
Solana shows diverging patternsSOL has formed a very interesting pattern and situation...
On the one hand, we see:
- confident movement within an ascending channel (marked in blue)
- positive news regarding SOL and the ETF
- a locally formed bullish flag, which fulfilled the expected movement (marked in yellow)
On the other hand, we see:
- a formed descending expanding wedge (marked in white), within which the global trend should have developed and become downward
- theoretically, the movement and formation of the first corrective Elliott wave (marked in dark gray) was determined within it
- buyers are preventing either the pattern or the wave from forming
The situation is interesting because we clearly see how the price is rebounding strictly along the lower boundary of the ascending channel, preventing a downward movement according to the pattern (marked in white) from forming, indicating the strength of the buyers. At this time, we also see the possible formation of a second corrective wave within the upward movement.
Current price: $193.40
An upward movement is most likely expected, with a breakout from the descending expanding wedge, within the ascending channel, to levels of $206, $220, and above...
A breakout into the $176 and $166 zone is also possible, and if the price goes lower, the current pattern will be broken.
More detailed analysis, additional charts, and key levels to watch are available on our site
$SOL (DAILY): HIDDEN BEAR RSI divergence, $69M ETF inflows CRYPTOCAP:SOL has now got a spot #ETF (Bitwise), and that thing pulled in nearly $70 million in inflows on day one — not bad. People and institutions have clearly been waiting for this one.
Normally, these types of events are textbook “sell-the-news” moments. However, in this case, if the inflows stay strong and even start growing day by day, that’s definitely not bearish.
Chart-wise, I published my strategy for #Solana recently (quoted post), and the plan stays the same — patiently wait for a breakout, especially with the latest bearish hidden RSI divergence; I never ignore these.
The bullish MACD crossover and hidden bullish OBV divergences can’t be ignored either, but I definitely won’t go long before a confirmed breakout.
Rules are rules. #FOMC day today, so I’d rather not open any new positions until tomorrow.
👽💙

SOL: chart on the background of the news!Greetings, colleagues 😊💻
It's time to🔎 look and disassemble the charts coins SOL
A lot of positive news has been 📅 coming out recently , and thus may attract more and more buyers of this asset .
💡 For those who are not engaged in investing, but in extracting medium and short-term profits, I recommend that you always rely on graphical data, rather than on the news background (which is often misleading and forces you to make decisions based on emotions)
🚩 A few technical characteristics of this coin, for those who just came to the market
Ticker: SOL (Solana)
Current price (at the time of publication): 194.53$
Market capitalization: $106.93B (ranked 9th)
⭐ Solana - is a high-performance blockchain built for scalable decentralized applications (dApps), DeFi, NFT and Web3
Average commission: <$0.00025
Consensus: A combination of Proof of History (PoH) + Proof of Stake (PoS)
Network launch: March 2020
Founder: Anatoly Yakovenko (former Qualcomm engineer)
PoH is a unique time—binding mechanism that allows validators to process transactions without constant synchronization. This is Solana's "secret weapon" against Ethereum and other L1s.
↗️ From the latest news:
▶ The first American spot ETF on Solana — Bitwise Solana Staking ETF (BSOL) — on the first day of trading, the fund raised $69.45 million, and its net assets reached $289 million.
The fund's share in Solana's market capitalization was 0.27%.
▶ Fidelity has added support for CRYPTOCAP:SOL for American clients.
▶ VanEck has submitted an updated version of the S-1 application for the spot CRYPTOCAP:SOL ETF.
▶ Grayscale has registered a CRYPTOCAP:SOL ETF in Delaware. This is the first formal step that companies usually take before filing a formal application with the SEC.
📊Technical picture:
🗓 Let's start the analysis with the quarterly chart (3M):
one of the significant advantages is that the price is trading above the annual opening mark ($189.31)
📎 Also, before the last increase, the price removed liquidity from the $ 110 mark and, according to the Fibonacci grid, the correction was in the OTE zone (0.62 - 0.705), which is quite a "healthy" correction for continued growth.
There is a liquidity zone on top - this is ATH - $295.83, which may become the first target for an upward movement.
📎 If we take into account more global goals, then we are guided by the extended Fibonacci grid ... 373$ … 474$
🗓 Weekly chart: the structure is ascending, but the open liquidity points of $155 and $126 are "confusing" from below
🗓 On the daily time frame: the trend is in a downward movement, now we are seeing a correction to the wave of decline, liquidity is forming on both sides
one of the options is to allow the price to go down and collect orders with a shadow, remaining in the range of the trend line (if the price is not held = $ 133)
🤔 I'm still waiting, I need to see the withdrawal of liquidity in order to understand which way the asset is going first
↗️ With growing institutional interest and technological improvements ahead, SOL remains one of the top candidates for the 2025-2026 altseason.
SOL is a mature ecosystem with real demand, infrastructure, and vision. It's wise to keep it in a briefcase. Trade cautiously, but actively 😊
Always calculate the risks and make informed decisions
Good luck to all! 🍀

SOL 2D BULLISH, Entry points New HH coming up?So guy as we have seen a downtrend SOL from 180 price resistance and so now price trading on very critical area. We have fvg on 2D around 120-123 and still haven’t not been taken. So there is two scenarios and mostly like price will reject from fvg and head toward to W fvg which we have Above on Weekly TF. The confirmation will be respect to fvg and overall market conditions. Also I am bearish on SOL 2 weekly TF, which we should not forget. If price respect to fvg and overall market conditions was bullish then we can enter around 120-130 and TP will be 210-220

SOL-USDTThe support level at $197 has been broken and will now act as resistance for Solana 🔽
So Solana needs to consolidate above this resistance to climb back to $210.
$solana long
### 🟢 SOLUSDT | 15-Minute Long Setup - Awakening from Accumulation
**Concepts: ICT | SMC | Bill Williams**
SOL is showing a compelling bullish structure after a period of consolidation. The price is currently testing the convergence point of the Bill Williams Alligator, indicating the market is "waking up" from its sleeping phase. The alignment of the Lips above the Teeth and Jaw suggests the beginning of a new bullish impulse.
**ICT & SMC Perspective:**
* **Liquidity Sweep & Demand Zone:** A clear sweep of sell-side liquidity occurred below **194.91**, tapping into the previous demand zone and creating a mitigation block. The subsequent rejection confirms buyer presence.
* **Break of Structure (BoS):** The swing high at **~196.07** has been breached, confirming a minor bullish shift in market structure.
* **Fair Value Gap (FVG):** The strong bullish move from the lows has created an FVG which the price is now retesting, offering a potential premium entry for longs.
* **Targeting Liquidity:** The next significant pool of buy-side liquidity rests above the **207.88** swing high.
**Bill Williams’ Alligator Confirmation:**
The Alligator is perfectly aligned for an upward move:
* **Lips (195.24) > Teeth (195.03) > Jaw (194.91)**
* This alignment, with price trading above all three, signals the Alligator is "awake" and hunting to the upside. The expanding mouth confirms building bullish momentum.
**Trade Plan:**
* **🟩 Entry:** On retest of the Alligator confluence zone (**195.20 - 195.00**) or a break above the local high (**196.10**).
* **🔴 Stop Loss:** **191.50** (below the Jaw and the recent liquidity sweep low).
* **🎯 Take Profit 1:** **202.00** (Previous resistance)
* **🎯 Take Profit 2:** **207.88** (Key swing high and liquidity target)
**RRR > 3:1**
**Conclusion:**
With a successful liquidity sweep, a confirmed Bullish BoS, and the Alligator fully aligned and awake, SOL is poised for a move toward the **202.00 - 208.00** resistance zone. Longs on a retest of the Alligator support offer a favorable risk-reward opportunity.
---

Solana is still within range... SOL just got some bullish news with a Western Union relationship. Could this be a catalyst that will allow the PA to exit the range? The current upward channel has been respected on the D1, although the trend has been our friend; trendline liquidity has been building. Regardless, the SOL price is at an important POI.

SOLUSDTI think have this chart of BINANCE:SOLUSDT buy because breakout trendline and i see order-block in 194$. Target is end measured move (2-Leg) from low latest swing in 208$.
Please control your risk in any position.

Solana Price Eyes $188 Support Amid Long Squeeze RiskBINANCE:SOLUSDT price is struggling to hold ground despite growing ETF excitement. The token has dropped 2.2% in the past 24 hours, with traders watching key support at $188 — a level that could trigger a wave of long liquidations worth roughly $548 million if broken.
The daily BINANCE:SOLUSDT chart shows a rising broadening wedge, a bearish structure that reflects expanding volatility. Price has repeatedly failed to hold above $201, confirming fading momentum. At the same time, RSI has made higher highs while price made lower highs, forming a hidden bearish divergence — often a sign of weakening strength before a decline.
If BINANCE:SOLUSDT closes below $179, it could fall toward $168 or even $155. A breakout above $235 would invalidate this bearish setup. On-chain data adds pressure, with long-term holders reducing positions and leverage longs now above 80%, increasing the risk of a long squeeze.

$SOL (DAILY): HIGHER low in, now the $206 KEY TESTA lot of progress in CRYPTOCAP:SOL DAILY chart but still in a no-go zone as I stick to my rigid rules set out in my last analysis, published 8 days ago. What happened since?
GOLDEN POCKET no longer a resistance zone, has been flipped into hard support and potentially my STOP LOSS protective pillow.
HIGHER LOW has been established, now time for a BULLISH market structure change.
Fibanacci-wise, the 0.5 fib level at $206 is in confluence with a horizontal level of resistance, JULY and AUGUST hard rejection levels. I live off confluences of this kind.
Short-term momentum 50 MA (yellow at $212.9 atm) will be the key test of intent in case of a BREAKOUT above $206.
MACD bullish crossover, check.
Volumes are not satisfying, at all. This is a major confirmation for me, always, so it's simple really.
LONG the BREAKOUT above $206 if volumes confirm the move.
FOMC soon, so I would need one more reason to enter, BULLISHNESS against BITCOIN or CRYPTOCAP:ETH and next posts are going to be on that subject.
💙👽

SOL LONG Concepts: ICT | SMC | Bill Williams
SOL continues to respect bullish smart money structure after tapping into a well-defined demand zone around the 198 area. Liquidity was swept below the prior consolidation lows, leading to a bullish change of character (ChoCH) — confirming that the market is likely accumulating orders before expansion.
ICT Perspective:
Sell-side liquidity taken below previous range lows
Strong displacement candle breaking short-term structure
Entry refined on retracement into the FVG inside the demand zone
Targeting buy-side liquidity resting above the 210 level
SMC Confirmation:
BOS confirmed on LTF
Price retested the mitigation block and rejected strongly
Entry: 202.00
Stop loss: 198.30 (below demand zone)
Take profit: 210.90 (previous high / liquidity pool)
Bill Williams’ Alligator:
The Alligator is beginning to wake up — green (lips) leading red and blue lines upward, signaling that momentum is shifting in favor of buyers. Once the lips cross above and the mouth opens, it often marks the start of a new impulsive wave.
Trade Plan:
🟩 Long: 202.00
🔴 SL: 198.30
🎯 TP: 210.90
RR ≈ 2.8:1
📈 With bullish structure confirmed and Alligator alignment showing early trend development, SOL could aim for the 210–212 liquidity zone before the next retracement.

SOL Consolidation — Watching 218 Target or 193 PivotLast week, the price also followed our orange plan. Right now, it’s in a phase of local consolidation.
If the descending trendline breaks, the price is likely to continue rising toward the 218 target. If the local low breaks instead, a correction toward the weekly pivot point at 193 is possible — I expect to see a bounce and a quick recovery from there; otherwise, the price may continue falling toward the ascending trendline .

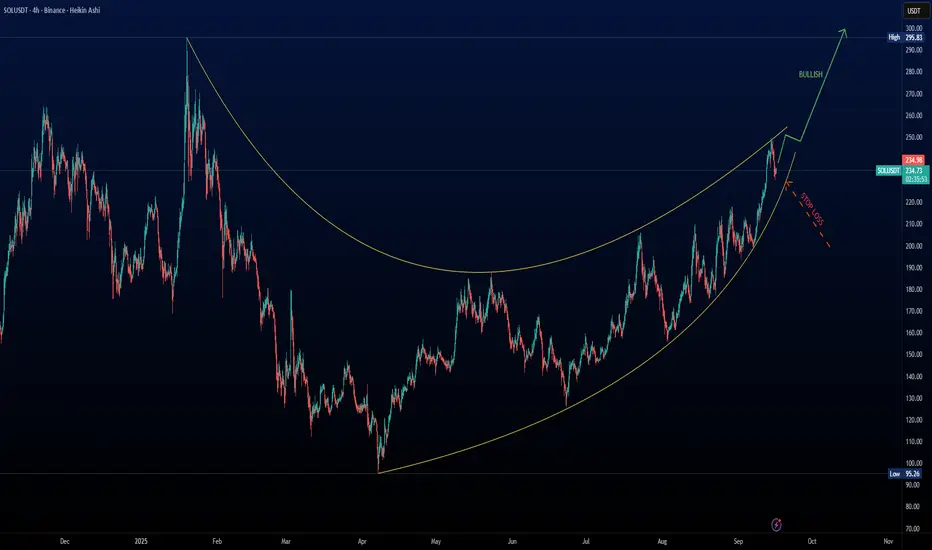
Bullish Momentum Building for Solana (SOL) – Targeting $300!Solana (SOL) is showing strong bullish momentum on the 4-hour chart. The ascending curve pattern suggests a continuation of the uptrend, with price currently hovering around $234.87 and a projected move toward $300 .
🔍 Key Highlights:
Strong Uptrend: Higher highs and higher lows confirm bullish structure.
Technical Setup: Ascending pattern with clear breakout potential.
Target: Price projection points toward $300.
Risk Management: Stop loss level marked to protect against reversals.
This setup offers a great opportunity for swing traders and crypto enthusiasts looking to capitalize on Solana’s momentum. Stay tuned for updates and trade smart!
SOL-USDTSolana's reaction to the $196 support I mentioned yesterday
How cool and cool it was
He reacted exactly to it 💎📊
The real growth is when it can break the $209 resistance

SOLUSDT – Bullish Trend Supported by Technical Structure and NewAfter a brief correction, SOLUSDT is showing strong signs of a continued upward movement. The ascending triangle pattern on the H4 chart indicates that SOL is building a solid base, with higher lows and testing the resistance at 200.00 USD. The price is currently above the EMA34, signaling strong buying momentum.
Notably, the price has recently broken through the important 200.00 USD resistance and is now approaching 216.00 USD. If SOL continues to hold above the 200 USD mark and confirms further upward movement, the next target would be 216 USD.
With positive news surrounding Solana and increased investment interest, SOL is likely to maintain its bullish momentum in the short term.
Strategy: Buy around 200.00 USD, target 216.00 USD, stop loss below 195.00 USD.
Summary: The short-term bullish trend remains strong, and SOLUSDT may reach the 216 USD target if it holds above the 200 USD support level.
