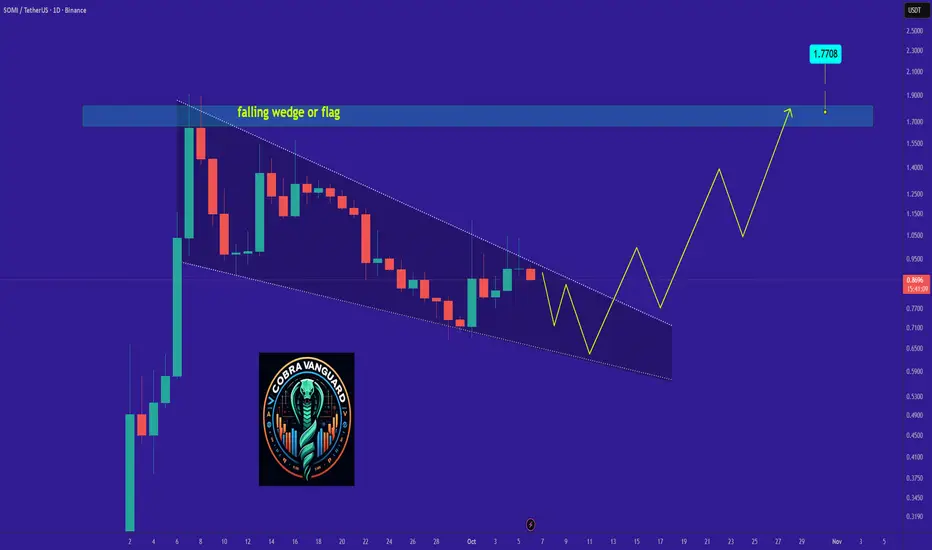
SOMI Ready for PUMP or what ?So if you pay attention to the SOMI chart you can see that the price has formed a Ascending wedge or flag which means it is expected to price move as equal as the measured price movement.( AB=CD )
NOTE: wait for break of the WEDGE .
Best regards CobraVanguard
Related pairs
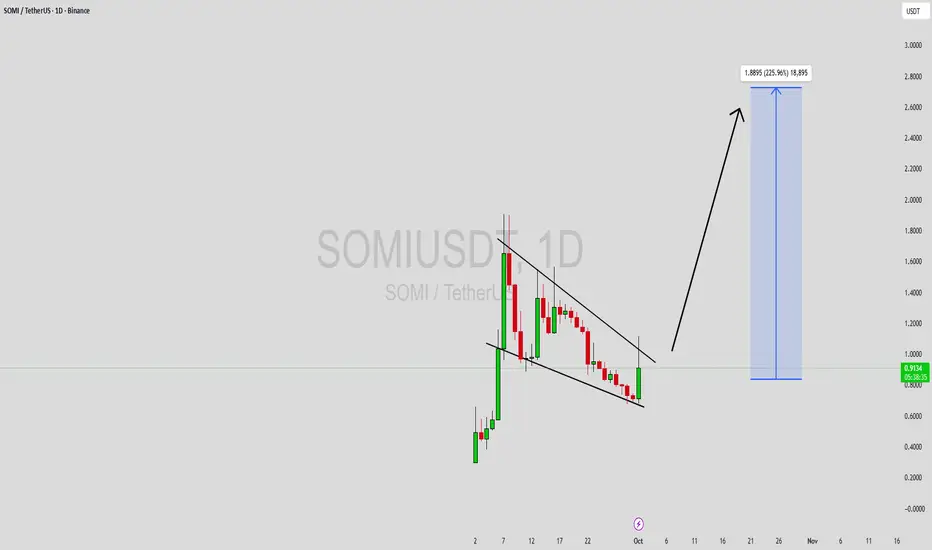
SOMIUSDT Forming Falling WedgeSOMIUSDT is currently displaying a strong bullish outlook as it forms a falling wedge pattern, a well-known reversal structure in technical analysis. This pattern often signals a potential breakout to the upside after a period of consolidation and price compression. With solid trading volume support
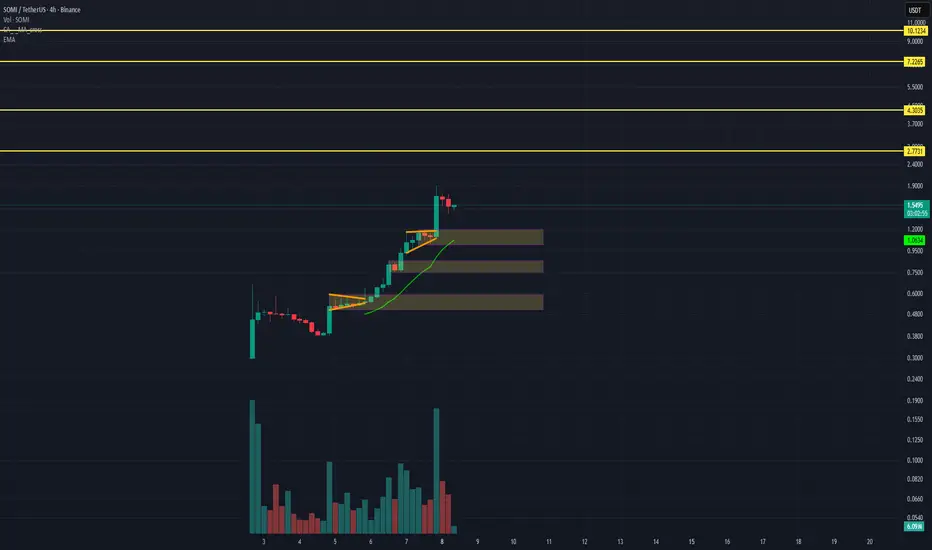
#SOMIUSDT More Than 80 % PUMP On The Way#SOMIUSDT More Than 80 % PUMP On The Way
Just like Mito, Somy is also expected to pump. Its pump could be even bigger than Mito’s — around 80%. But the condition is that it must hold the lower green box properly.
!! Jai Shree Ram !!


SOMI Perpetual BUY SETUP , Bought From $1.38SOMI BUY SETUP
Currently $1.38
Bought From $1.38
Stop loss $0.90
(Trading plan If SOMI go down ,
to $1.22 will add more longs)
Expecting target $1.48 OR ABOVE
In the event of an early exit,
this analysis will be updated.
Its not a Financial advice

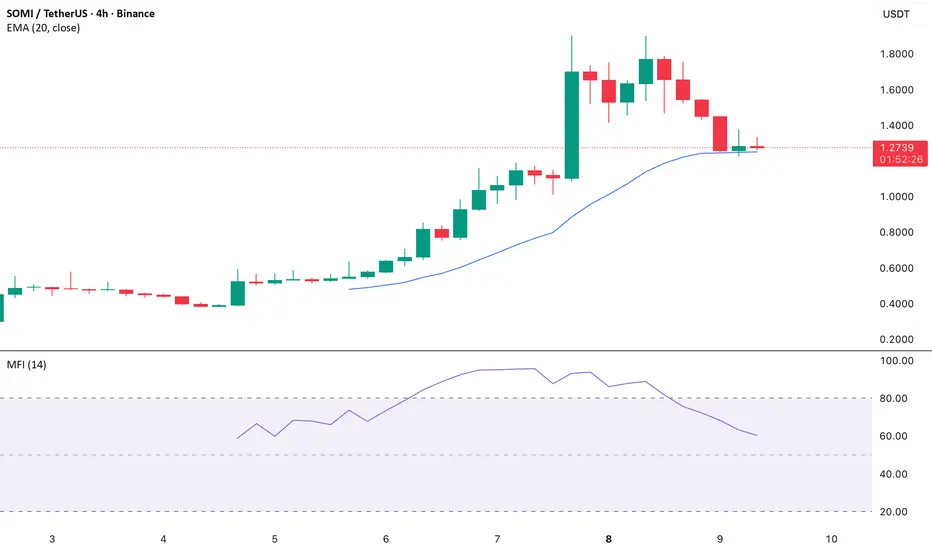
Money Flow Index Points to Selling Pressure
On the SOMI/USD four-hour chart, the Money Flow Index (MFI) has been trending downward, indicating a rise in selloffs. Since the MFI accounts for both price and volume, a decline confirms that sellers are steadily gaining control while buyers lose momentum.
SOMI’s recent price action has brought i
SOMI has had ENOUGHBINANCE:SOMIUSDT.P price action has created a big fair value gap at $1.28 area. This area must be revisited before the price can continue the bullish momentum.

SOMIUSDT – Watching Key Support Levels for Next Leg UpSomnia has shown strong bullish momentum on the 4H chart, forming consecutive continuation patterns before reaching the current consolidation zone. Price is now holding above the EMA, suggesting buyers still have control, but a correction into support is possible.
Key support levels:
1.01–1.19 (
SOMI Coin Somnia Token Price Prediction and Technical AnalysisSOMI/USDT has staged an impressive recovery after bouncing strongly from the 0.8093 demand zone, reclaiming the 1.0816 support-turned-demand with momentum. Price is now pushing higher and approaching the 1.5758 resistance, which is the next major supply zone to watch. If bulls manage to hold above 1

SOMIUSDT - SHORT POSITION - 8XSOMIUSDT - SHORT POSITION - 8X
analysis only
your profit or loss is your business
no advice

See all ideas
Summarizing what the indicators are suggesting.
Oscillators
Neutral
SellBuy
Strong sellStrong buy
Strong sellSellNeutralBuyStrong buy
Oscillators
Neutral
SellBuy
Strong sellStrong buy
Strong sellSellNeutralBuyStrong buy
Summary
Neutral
SellBuy
Strong sellStrong buy
Strong sellSellNeutralBuyStrong buy
Summary
Neutral
SellBuy
Strong sellStrong buy
Strong sellSellNeutralBuyStrong buy
Summary
Neutral
SellBuy
Strong sellStrong buy
Strong sellSellNeutralBuyStrong buy
Moving Averages
Neutral
SellBuy
Strong sellStrong buy
Strong sellSellNeutralBuyStrong buy
Moving Averages
Neutral
SellBuy
Strong sellStrong buy
Strong sellSellNeutralBuyStrong buy
Frequently Asked Questions
The current price of Somnia/Tether (SOMI) is 0.8380 USDT — it has fallen −1.43% in the past 24 hours. Try placing this info into the context by checking out what coins are also gaining and losing at the moment and seeing SOMI price chart.
Somnia/Tether price has risen by 12.01% over the last week, its month performance shows a −51.72% decrease, and as for the last year, Somnia/Tether has increased by 19.54%. See more dynamics on SOMI price chart.
Keep track of coins' changes with our Crypto Coins Heatmap.
Keep track of coins' changes with our Crypto Coins Heatmap.
Somnia/Tether (SOMI) reached its highest price on Sep 7, 2025 — it amounted to 1.9066 USDT. Find more insights on the SOMI price chart.
See the list of crypto gainers and choose what best fits your strategy.
See the list of crypto gainers and choose what best fits your strategy.
Somnia/Tether (SOMI) reached the lowest price of 0.3809 USDT on Sep 4, 2025. View more Somnia/Tether dynamics on the price chart.
See the list of crypto losers to find unexpected opportunities.
See the list of crypto losers to find unexpected opportunities.
The safest choice when buying SOMI is to go to a well-known crypto exchange. Some of the popular names are Binance, Coinbase, Kraken. But you'll have to find a reliable broker and create an account first. You can trade SOMI right from TradingView charts — just choose a broker and connect to your account.
Somnia/Tether (SOMI) is just as reliable as any other crypto asset — this corner of the world market is highly volatile. Today, for instance, Somnia/Tether is estimated as 5.95% volatile. The only thing it means is that you must prepare and examine all available information before making a decision. And if you're not sure about Somnia/Tether, you can find more inspiration in our curated watchlists.
You can discuss Somnia/Tether (SOMI) with other users in our public chats, Minds or in the comments to Ideas.