NVDA Earnings, US GDP, US Core PCE - August Wrap-UpAs if Jackson Hole noise wasn't enough, sprinkle in some additional major news
for this week.
NVDA Earnings (After Close Wednesday)
US GDP (Thursday)
US Unemployment Claims (Thursday)
US PCE / US Core PCE (Friday)
NVDA at nearly 8% market cap for S&P can certainly move the market
Look at NVDA, MAGS, SPY, QQQ and they all look like 50/50 charts - price could
go either direction
NVDA expecting +/- 11.00 points on the week, average earnings move is around 12.66 points
I'm looking to fade any big gap on NVDA into September monthly and quarterly expirations with low risk options trades and I'm also deleveraging some of my naked puts and ratio spreads
to take profits and add more buying power for the end of year
I'll be watching - let's see how everything shakes out
SP500FT trade ideas

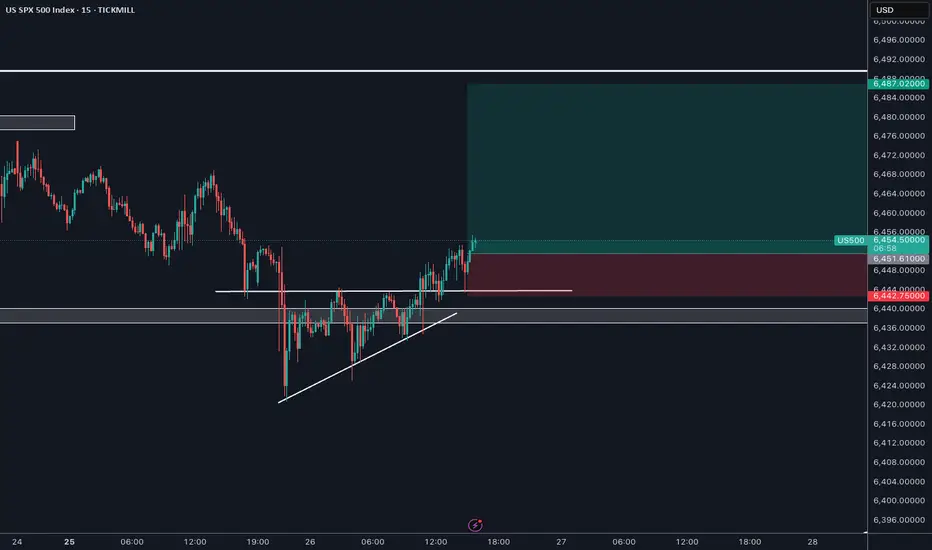
US500 breaks consolidation, eyeing all-time highs after pullbackThe US500 reached a key support area on the H1 chart and started building a bullish structure.
On the intraday (M5/M1), price broke above local resistance and then retested the breakout zone with a clean pullback. This retest was confirmed by a strong bullish candle, signaling continuation to the upside.
Trade plan:
Entry: after confirmation of the pullback at the breakout zone.
Stop-loss: below support (around 6437).
Target: all-time high zone at 6485–6490.
Risk management: once the first target is reached, stop can be moved to breakeven to protect capital.
This setup supports the expectation of bullish continuation, as long as support holds.
Possible shorts incoming on ES (S&P 500)Price tapped a daily resistance, and the 1h is bearish. Shorts only with a confirmation

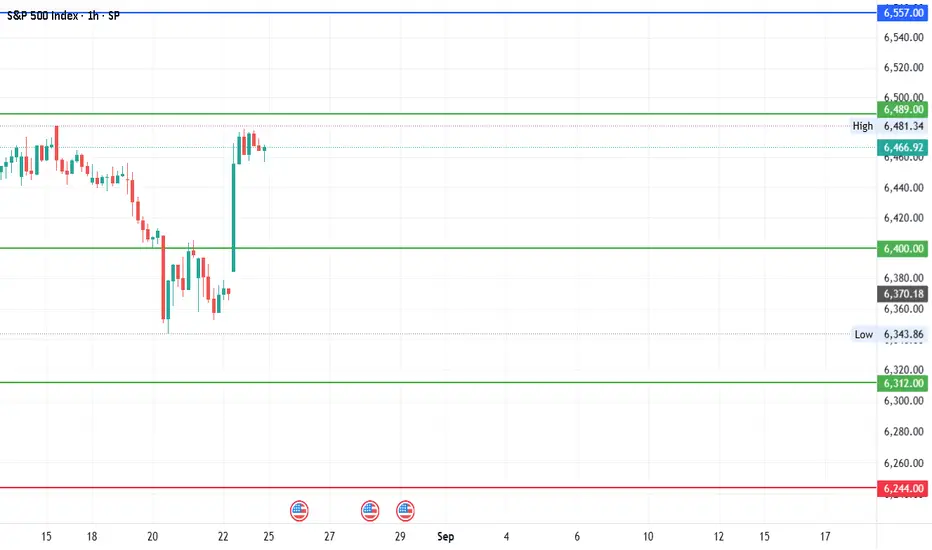
#SPX - 300 points move?Date: 24-08-2025
SPX- Current Price: 6466.92
Pivot Point: 6400
Support: 6312
Resistance: 6489
Upside Targets:
--------------------------------
| Target | Price |
---------------------------------
| 🎯 Target 1 | 6557 |
| 🎯 Target 2 | 6625 |
| 🎯 Target 3 | 6710 |
| 🎯 Target 4 | 6794 |
Downside Targets:
| 🎯 Target 1 | 6244 |
| 🎯 Target 2 | 6175 |
| 🎯 Target 3 | 6090 |
| 🎯 Target 4 | 6006 |
#TradingView #Nifty #BankNifty #DJI #NDQ #SENSEX #DAX #USOIL #GOLD #SILVER
#BHEL #HUDCO #LT #LTF #ABB #DIXON #SIEMENS #BALKRISIND #MRF #DIVISLAB
#MARUTI #HAL #SHREECEM #JSWSTEEL #MPHASIS #NATIONALUM #BALRAMCHIN #TRIVENI
#USDINR #EURUSD #USDJPY #NIFTY_MID_SELECT #CNXFINANCE
#SOLANA #ETHEREUM #BTCUSD #MATICUSDT #XRPUSDT #PEPEUSDT #SHIBUSDT
#Crypto #Bitcoin #BTC #CryptoTA #TradingView #PivotPoints #SupportResistance

New ATH?Thanks to the dollar’s decline, the stock index had a strong rally and managed to break resistance with great strength. It has now pulled back to that zone, and if it holds as support, it could reach a new high.

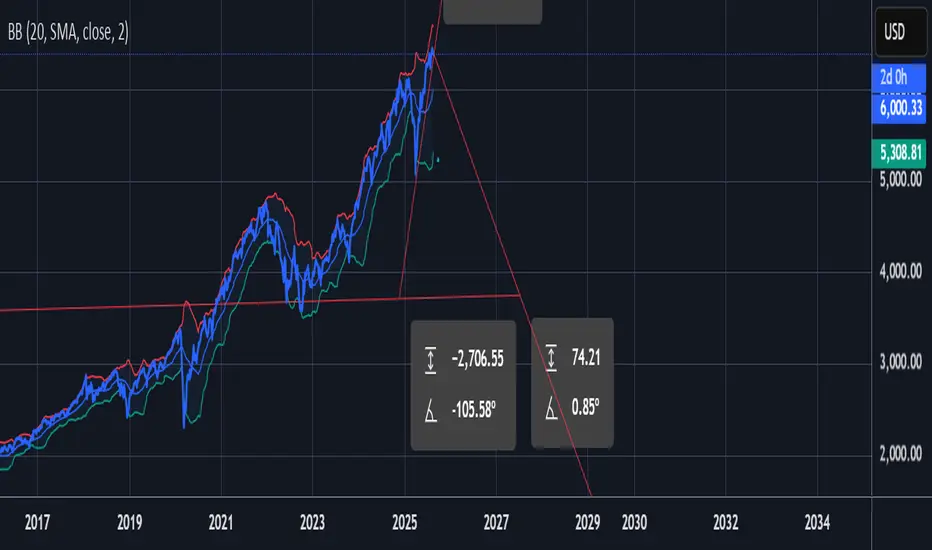
The ascending triangle of the SPX JUST adjusted today ...making the tip of the triangle widen a little, therefore putting the tip of the triangle farther out. The tip of the triangle is now at around Sept. 2, 2025. Technically, the equity or whatever you are trading can exit out of the triangle anytime from 2/3 to 3/4 of the triangle length. Since the half and hour and the one hour indicators are indicating a bullish move, I do not think the market will continue lower tomorrow.
Historically, the markets have gone down in October. I suspect that the SPY is going to keep going up, then retrace briefly until we reach a point where the market decides to go down significantly. Could that be October ... maybe?!? I don't know. I do not have a crystal ball.
But, I drew a trend line from the big drop from Feb to April upward. (see the dotted black line) Coincidentally, this trend line crosses the 1.618 fibinocci threshold in the beginning of October. (indicated by a gold star)
This is just the same information I have posted in my previous charts.
I am a technical trader but I believe the fundamentals drive the market.
I am using the Heikin Ashi candlesticks.
1) They show more of a directional movement within candlesticks.
2) They tend to filter out the market noise so you can see the market direction better.
3) It reduces false signals, allowing you to stay in the trade longer.
4) And, it also gives you a smoother appearance making it easier to see trends and reversals.
But I often switch between regular candlesticks as those are the candlesticks I started trading with and I still do get a little bit of information from the regular candlesticks.
I personally find:
* the 5 minute indicators typically represents what will happen in the next half and hour.
* the 10 minute indicators typically represents what will happen in the next hour.
* the 30 minute indicators typically represents what will happen in the daily.
* and, the hour indicators typically represents what will happen in the next week.
Typically, I would wait until there are 2 green Heikin Ashi green candlesticks before entering.
I still tend to switch back and forth between Heikin Ashi candlesticks and regular candlesticks since regular candlesticks are what I am familiar with and have been using since I started trading.
I use the MacD, the Stock RSI and the DMI to assist me with the direction of the market. I am not perfect at them. I will hopefully try to explain these in future trading charts.
My trading plan only entails me to use 10% of my total account. If I am wrong on this trade, I will not implode my account.
Trade at your own risk, make sure you have stops in place, use a trading plan and only use 10% or less of your account for trading to limit your risk.
Any comments and questions are welcome.... conversation and dialog allows us to learn more.
I am trying to expand outside of the SPY and DIA, so hopefully, I will tackle some other symbols.
Happy Trading everyone!

End of 2025: 3 Fed scenarios and their impact on the marketThe FED has not cut the federal funds rate since the end of 2024. Let's take a look at the 3 possible scenarios for the Fed funds rate between now and the end of the year, and the impact on the stock market for equities, bonds, the US dollar and Bitcoin.
The table below summarizes the 3 possible scenarios and their possible impact on the stock market.
1) No FED pivot for the whole of 2025 (the most bearish case for risky assets on the stock market)
In this case, the FED would keep rates unchanged for the whole of 2025 in order to continue the fight against inflation. The market would find itself trapped by its expectations, as it anticipates an easing by the end of the year. On the stock market, this would trigger a major correction in the S&P 500, currently valued at levels close to its 2021 highs. Two-year interest rates would rebound, as would long-term bond yields, leading to increased pressure on US government debt and lower bond prices. The US dollar is expected to rebound strongly, driven by a technical bullish pattern, reinforcing its attractiveness on the foreign exchange market. Finally, in the crypto-currencies, a sustained bear market would set in, with an estimated average duration of thirteen months (the famous bear market of BTC's 4-year cycle), marking a major reversal for Bitcoin and altcoins.
2) A “technical” pivot by the FED (1 isolated rate cut)
This intermediate scenario would correspond to a cut in key rates as early as September or October 2025, following the arrival of Stephen Miran on the FOMC. However, this cut would remain isolated and would not mark the start of a prolonged rate-cutting cycle, as inflation would still be too high. On the equity markets, this would translate into a consolidation phase: the S&P 500 would move in a corridor between 5800 points and its recent record highs. Two-year yields would stabilize at around 4%, hovering around their 200-day moving average, with a slight rise in bond prices, especially in the event of a weak job market. The US dollar would also stabilize, with a moderate appreciation on the foreign exchange market. As for crypto-currencies, the impact would be neutral to slightly bullish, with the possibility of a final peak before the next bear market settles in, linked to the four-year cycle seen on Bitcoin.
3) A “real” FED pivot (several rate cuts between now and the end of December 2025)
In the case of a real monetary pivot, the FED would cut its key rate in September, followed by two further cuts before the end of the year. This scenario would have a markedly positive impact on equity markets, with the S&P 500 possibly reaching the 6700-point target. On the rates side, this would lead to a marked downtrend, with new lows for short- and long-term yields, while bond prices would start to rise sharply again. The US dollar would enter a prolonged downtrend, with a target of 95 points for the DXY index. Last but not least, crypto-currencies are set to benefit from this accommodating climate: Bitcoin and altcoins are likely to see their prices rise, marking the end of a bullish cycle at the end of the year.
DISCLAIMER:
This content is intended for individuals who are familiar with financial markets and instruments and is for information purposes only. The presented idea (including market commentary, market data and observations) is not a work product of any research department of Swissquote or its affiliates. This material is intended to highlight market action and does not constitute investment, legal or tax advice. If you are a retail investor or lack experience in trading complex financial products, it is advisable to seek professional advice from licensed advisor before making any financial decisions.
This content is not intended to manipulate the market or encourage any specific financial behavior.
Swissquote makes no representation or warranty as to the quality, completeness, accuracy, comprehensiveness or non-infringement of such content. The views expressed are those of the consultant and are provided for educational purposes only. Any information provided relating to a product or market should not be construed as recommending an investment strategy or transaction. Past performance is not a guarantee of future results.
Swissquote and its employees and representatives shall in no event be held liable for any damages or losses arising directly or indirectly from decisions made on the basis of this content.
The use of any third-party brands or trademarks is for information only and does not imply endorsement by Swissquote, or that the trademark owner has authorised Swissquote to promote its products or services.
Swissquote is the marketing brand for the activities of Swissquote Bank Ltd (Switzerland) regulated by FINMA, Swissquote Capital Markets Limited regulated by CySEC (Cyprus), Swissquote Bank Europe SA (Luxembourg) regulated by the CSSF, Swissquote Ltd (UK) regulated by the FCA, Swissquote Financial Services (Malta) Ltd regulated by the Malta Financial Services Authority, Swissquote MEA Ltd. (UAE) regulated by the Dubai Financial Services Authority, Swissquote Pte Ltd (Singapore) regulated by the Monetary Authority of Singapore, Swissquote Asia Limited (Hong Kong) licensed by the Hong Kong Securities and Futures Commission (SFC) and Swissquote South Africa (Pty) Ltd supervised by the FSCA.
Products and services of Swissquote are only intended for those permitted to receive them under local law.
All investments carry a degree of risk. The risk of loss in trading or holding financial instruments can be substantial. The value of financial instruments, including but not limited to stocks, bonds, cryptocurrencies, and other assets, can fluctuate both upwards and downwards. There is a significant risk of financial loss when buying, selling, holding, staking, or investing in these instruments. SQBE makes no recommendations regarding any specific investment, transaction, or the use of any particular investment strategy.
CFDs are complex instruments and come with a high risk of losing money rapidly due to leverage. The vast majority of retail client accounts suffer capital losses when trading in CFDs. You should consider whether you understand how CFDs work and whether you can afford to take the high risk of losing your money.
Digital Assets are unregulated in most countries and consumer protection rules may not apply. As highly volatile speculative investments, Digital Assets are not suitable for investors without a high-risk tolerance. Make sure you understand each Digital Asset before you trade.
Cryptocurrencies are not considered legal tender in some jurisdictions and are subject to regulatory uncertainties.
The use of Internet-based systems can involve high risks, including, but not limited to, fraud, cyber-attacks, network and communication failures, as well as identity theft and phishing attacks related to crypto-assets.

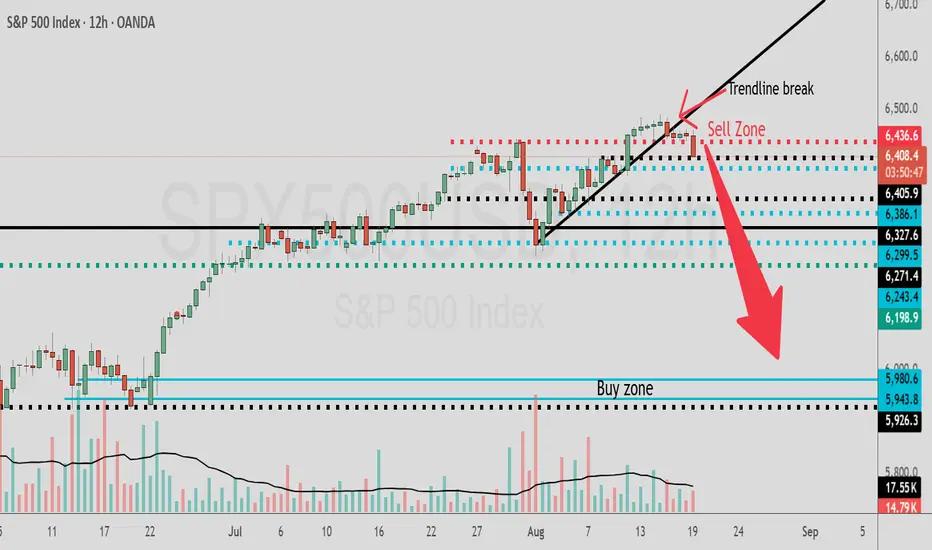
Trendline Break To The Downside In SPX/USDHey Traders and followers! Hope your summer has been going great along with your profits $
Take your money off the table in SPX if you are long and jump into a short as we have a trendline break to the downside on the 12hr chart.
Price has broke through the sell zone area of 6436.6 painting a bearish picture for SPX way down to 5980.6 area.
If price breaks back up above 6436.6 area then the bearish break trade will be off the table.
Best of luck in all your trades $$$
Jackson Hole Insights: US500 in the SpotlightUS500 is up from the previous session. Despite recent volatility, the index is up more than 0.30% over the past month and more than 13% yoy.
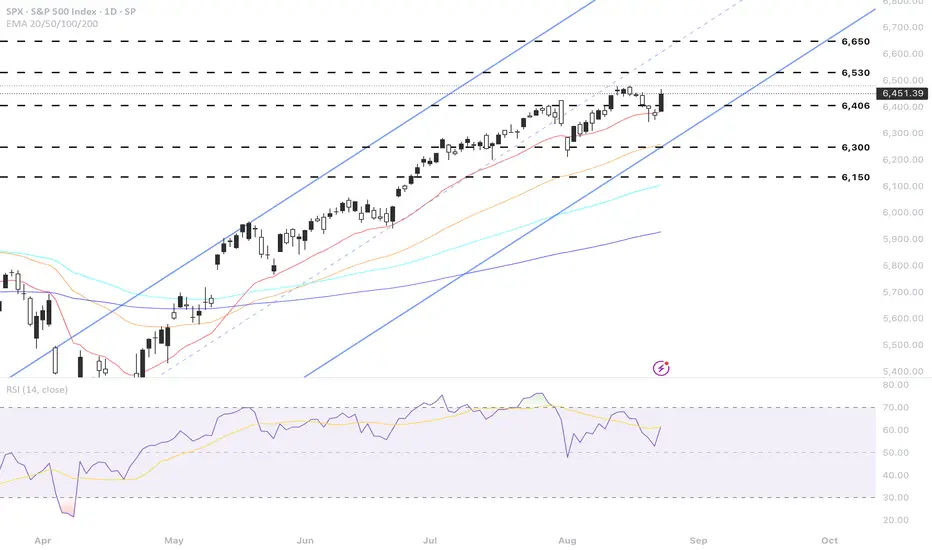
The index hit an all-time high above 6,400 earlier in August but has since seen some pullback, reflecting a “market wobble” as traders anticipate signals from Fed Chair Powell at the Jackson Hole Symposium.
Fundamental Analysis
Short-term price action has been mixed. Tech and chip stocks have weighed on performance, while a rotation into defensive and healthcare sectors has helped cushion declines.
Recent earnings misses by major retailers, including Walmart have stoked concerns about consumer resilience amidst ongoing higher tariffs and uneven spending patterns.
Despite near term caution, the index remains resilient with buyers coming in at lower levels and support levels seen around 6,300 and 6,150. Pullbacks are viewed as likely to be short lived unless new external shocks arise.
Technical Analysis
If the index breaks above resistance near 6,406, a push toward 6,500 and 6,650 is possible.
Bearish Risk: A breakdown below the 6,300 - 6,150 region could trigger a pullback toward 6,075 or lower, but this remains a scenario barring a major negative shock.
Overall US 500 remains resilient despite intermittent corrections and sector rotations. The outlook is broadly positive, especially if Fed signals from Jackson Hole remain supportive and corporate earnings stay resilient
Analysis by Terence Hove, Senior Financial Markets Strategist at Exness
SPX500 Market Outlook | Powell’s Jackson Hole Speech in FocusSPX500 – Overview
U.S. Sectors in Spotlight Ahead of Fed’s Jackson Hole Gathering
Wall Street is awaiting confirmation of a potential September interest rate cut when Fed Chair Jerome Powell speaks at the Jackson Hole symposium on Friday — a potentially pivotal event for markets, particularly for rate-sensitive sectors.
This year’s gathering comes after a week of mixed inflation data, as consumer and wholesale price reports gave conflicting signals on how well the U.S. economy is handling President Trump’s import tariffs, complicating the Fed’s policy outlook.
After cutting rates by 50 bps in September 2024 and 25 bps in both November and December, the Fed has since held steady. Rising expectations of another cut next month have buoyed homebuilders, banks, and retailers, though a hawkish surprise from Powell could weigh on these sectors.
🔎 Technical Outlook
Bearish Scenario:
As long as price trades below 6389, downside pressure remains, targeting 6366 and, if broken, extending toward 6321.
Bullish Scenario:
A confirmed 1H/4H close above 6389 would open the way toward 6406 – 6425, with a stronger push possible toward 6468.
📍 Key Levels
Pivot: 6389
Support: 6366 – 6341 – 6321
Resistance: 6406 – 6425 – 6468
⚠️ Expect heightened volatility during Powell’s Jackson Hole speech — risk management is essential.

US 500 Index – Big Sentiment Test AheadIt's been a nervy couple of days for the US 500 index with US technology giants led by NVIDIA taking a hit as traders looked to reduce some risk ahead of Federal Reserve (Fed) Chairman Jerome Powell's Jackson Hole Symposium speech on Friday (1500 BST), where he could shed some light on whether or not the current market expectation of 2 25bps (0.25%) interest rate cuts in 2025 is correct or overblown.
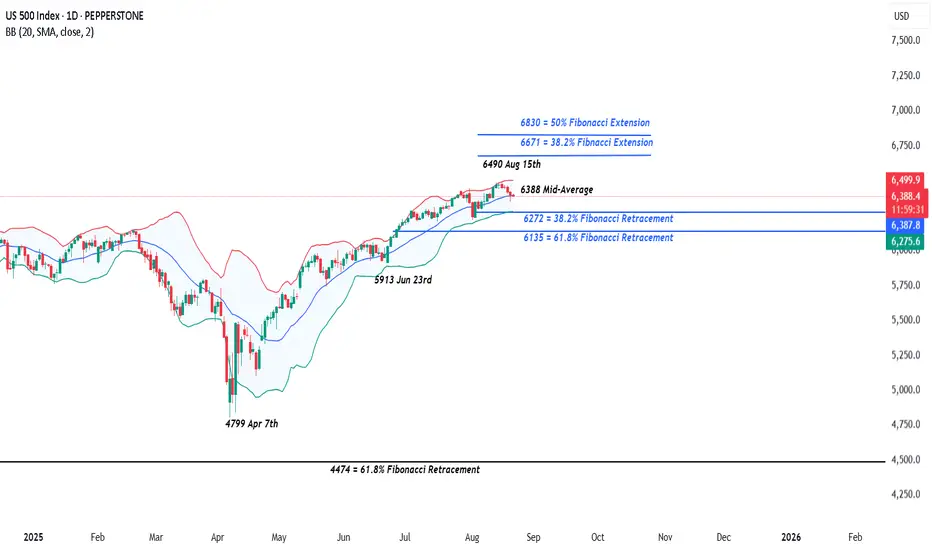
This down move in these key Magnificent Seven stocks has had an outsized influence on the direction of the US 500 due to their large index weightings, and saw prices trade from a record high of 6490 on August 15th down to a low of 6347 yesterday (August 20th).
Before we get to the Jackson Hole risk event, later today US 500 traders will have to negotiate the earnings update from retail giant Walmart, which is released before the market close and will provide a crucial insight into the current spending patterns of US consumers, and perhaps more importantly, update traders on what spending may look like across the remainder of 2025.
Then, the US preliminary PMI surveys for August are due at 1445 BST. These are important forward-looking reports on manufacturing and service activity in the US economy and will provide a health check on the direction of growth, including updates on new orders, employment and costs. Any reading below 50 = economic contraction and any reading above 50 = economic expansion. The service activity reading, which hit a 7-month high at 55.7 in July is possibly the more relevant release for traders given that it’s been the main driver of US growth for many months now while manufacturing has struggled. Any deviation from expectations could lead to further US 500 volatility.
Technical Update: Test or Break of Bollinger Mid-Average Support?
On Friday, August 15th, the US 500 index successfully posted a new all-time high at 6490. However, price action has since turned lower, resulting in a sell-off this week.
As shown on the chart below, the index is currently testing a potential support level, marked by the Bollinger mid-average, which at the time of writing, stands at 6388.
Traders often use the mid-average as an indicator of directional risk. While prices remain above this level, the market is generally considered to be in a positive trend, but when price activity falls below the mid-average, it may signal the development of a downtrend.
Therefore, how the 6388 mid-average level is defended on a closing basis over the coming 2 days might indicate the next possible phase of price movement. A close above this level may reinforce support and suggest a potential rebound in price, while a close below it could open the door to further price downside.
With this in mind, let’s take a look at the possible support or resistance levels to consider ahead of the key risk events across the remainder of the week.
Possible Resistance Levels:
As long as the 6388 mid-average support continues to hold on a closing basis, the uptrend could be classed as still intact. This is supported by the pattern of higher highs and higher lows forming in price since the April 7th low.
As the chart above shows, this setup could be suggesting potential for further price strength, with the initial resistance at the 6490 August 15th all-time high. A closing break above here could then open scope toward 6671, which is equal to the 38.2% Fibonacci extension level.
Potential Support Levels:
While not a guarantee of a more extended price decline, closes below the Bollinger mid-average at 6388, if seen over coming sessions, may reflect increasing risks for a deeper sell-off.
Such moves might suggest potential for moves down to the next support at 6272, which is the 38.2% retracement level. If this level is in turn breached, focus may then shift to 6214, which is the August 1st low, as the next key support.
The material provided here has not been prepared accordance with legal requirements designed to promote the independence of investment research and as such is considered to be a marketing communication. Whilst it is not subject to any prohibition on dealing ahead of the dissemination of investment research, we will not seek to take any advantage before providing it to our clients.
Pepperstone doesn’t represent that the material provided here is accurate, current or complete, and therefore shouldn’t be relied upon as such. The information, whether from a third party or not, isn’t to be considered as a recommendation; or an offer to buy or sell; or the solicitation of an offer to buy or sell any security, financial product or instrument; or to participate in any particular trading strategy. It does not take into account readers’ financial situation or investment objectives. We advise any readers of this content to seek their own advice. Without the approval of Pepperstone, reproduction or redistribution of this information isn’t permitted.
SPX500 & NAS100 BULLISH and GOLD NEUTRALIn this week's analysis of the major indices and Gold, there is a lot of indicator divergences on the charts. However, while momentum is declined and the divergences are not confirmed yet, suggesting that the train has not come to a complete stop in my opinion. Yes!, we could be nearing the Tops but I could not confirm that on the chart. Secondly, price action just broke into a new high from a defended support zone and that suggest that Bulls are in control of the market currently for both SPX500 and NAS100.
GOLD is still in a neutral zone consolidating sideways and I think based on the chart analysis, it continues to go sideways after a push down to about 3320 and then a rise to about 3419 Target.
I hope you find the analysis informative and I thank you for visiting my video publication. Cheers and have a great trading week.

SPX500 LongElite Analysis
Price is rejecting weekly structural liquidity
Targeting upper daily structured liquidity
Executed in smaller time frame

SPX500 Market Outlook | Fed Meeting & Retail Earnings in FocusSPX500 Overview
Wall Street subdued as retail earnings and Fed meeting remain in focus
U.S. stock index futures edged lower on Wednesday, extending a tech-led pullback on Wall Street. Investors are closely monitoring earnings from major retailers such as Target and Lowe’s, seen as key indicators of consumer health, while awaiting the upcoming Federal Reserve symposium later this week.
Concerns over tariffs and their potential impact on consumer prices have weighed on sentiment, adding to the cautious market tone.
🔎 Technical Outlook
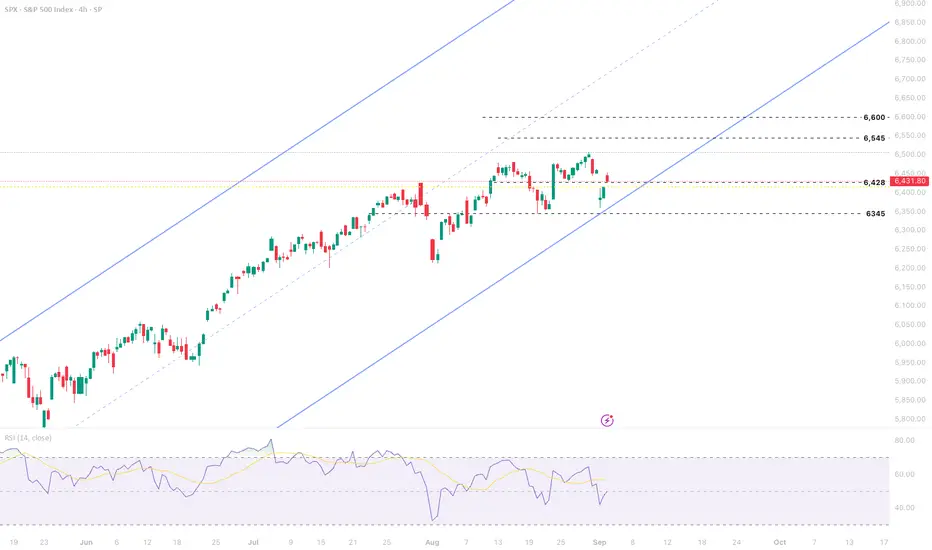
The SPX500 remains under bearish pressure after stabilizing below the pivot line at 6425.
Bearish Scenario:
As long as price trades below 6425, the trend favors the downside, targeting 6389 and 6366. A confirmed break of 6366 could accelerate the decline toward 6321.
Bullish Scenario:
A sustained 4H candle close above 6425 would shift momentum back to the upside, with resistance at 6439, followed by 6468 and 6485.
Support: 6389, 6366, 6341, 6321
Resistance: 6439, 6468, 6485

US 500 road mapus 500 could be ready for a major c leg down. looking for a significant entry signal down

Bullish bounce off?S&P500 (US500) has bounced off the pivot, which aligns with the 50% Fibonacci retracement, and could potentially rise to the 1st resistance.
Pivot: 6,346.35
1st Support: 6,296.98
1st Resistance: 6,435.90
Risk Warning:
Trading Forex and CFDs carries a high level of risk to your capital and you should only trade with money you can afford to lose. Trading Forex and CFDs may not be suitable for all investors, so please ensure that you fully understand the risks involved and seek independent advice if necessary.
Disclaimer:
The above opinions given constitute general market commentary, and do not constitute the opinion or advice of IC Markets or any form of personal or investment advice.
Any opinions, news, research, analyses, prices, other information, or links to third-party sites contained on this website are provided on an "as-is" basis, are intended only to be informative, is not an advice nor a recommendation, nor research, or a record of our trading prices, or an offer of, or solicitation for a transaction in any financial instrument and thus should not be treated as such. The information provided does not involve any specific investment objectives, financial situation and needs of any specific person who may receive it. Please be aware, that past performance is not a reliable indicator of future performance and/or results. Past Performance or Forward-looking scenarios based upon the reasonable beliefs of the third-party provider are not a guarantee of future performance. Actual results may differ materially from those anticipated in forward-looking or past performance statements. IC Markets makes no representation or warranty and assumes no liability as to the accuracy or completeness of the information provided, nor any loss arising from any investment based on a recommendation, forecast or any information supplied by any third-party.


US500 Short Term Correction
US500 Snapshot
US500 is experiencing a sharp pullback driven by heightened risk aversion, rising Treasury yields, and defensive repositioning ahead of major US macro data releases. Sentiment turned noticeably bearish, and technical patterns point to a shift towards correction after months of bullish momentum.
Fundamental
Broad sentiment was bearish today while equities declined and volatility (VIX) spiked.
Defensive sectors (utilities, healthcare, consumer staples) outperformed while tech and growth stocks led losses. Investors are responding to seasonal September risks, rising bond yields near 4.5%, Fed rate cut uncertainty, and anxiety from recent legal and policy headlines
Technical
The index is now in a short term correction, ending a strong summer rally and moving off all time highs, reflective of portfolio rebalancing and increased caution typical for September.
A confirmed daily close below 6,336 would increase the likelihood of a deeper retracement wave targeting 6,000
Current momentum favors near term downside until macro trends, notably labor data and Fed signals, clarify the outlook.
Momentum has shifted towards testing the downside with 6,345 – 6,336 as critical areas to monitor for increased volatility and potential accelerated selling
Key Levels
Resistance 6,500 –6,545, Recent all-time high region, upside cap
Support 6,428 First key support,
Strong Support 6,345 Lower floor, downside target if selling persists
Analysis by Terence Hove, Senior Financial Markets Strategist at Exness
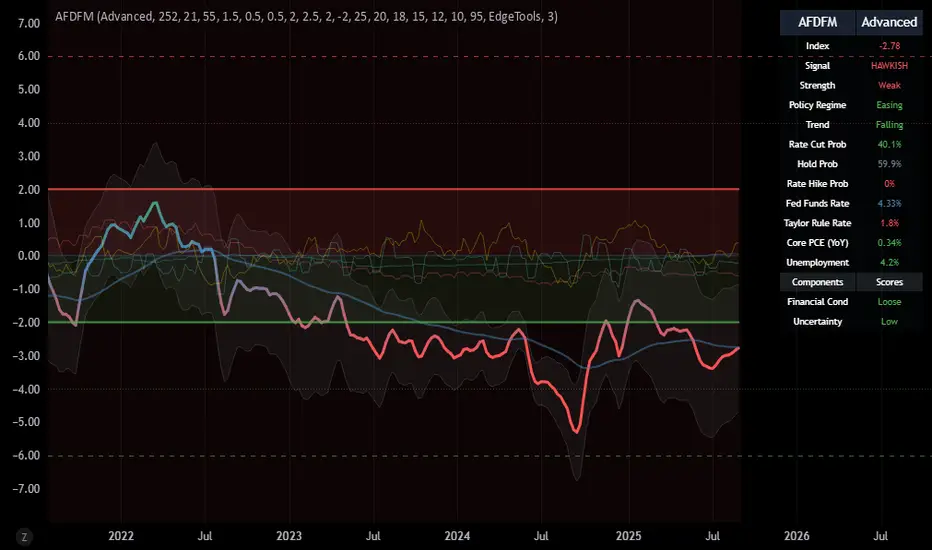
SPX – Fed Model vs Liquidity: Hawkish Hold Meets Negative FlowThe S&P 500 holds near 6,435, but the backdrop is shifting. Fed tone, liquidity, and sentiment are no longer aligned, leaving SPX caught between support and resistance.
1. Fed Model (AFDFM)
Index = –2.78 → weak hawkish bias.
Policy regime = easing, but signal shows a falling trend.
Probabilities: Hold = 60%, Cut = 40%, Hike = 0%.
Inflation easing (Core PCE 0.34%), unemployment stable (4.2%), but Fed Funds still elevated at 4.33%. Policy remains restrictive compared to the Taylor Rule (~1.8%).
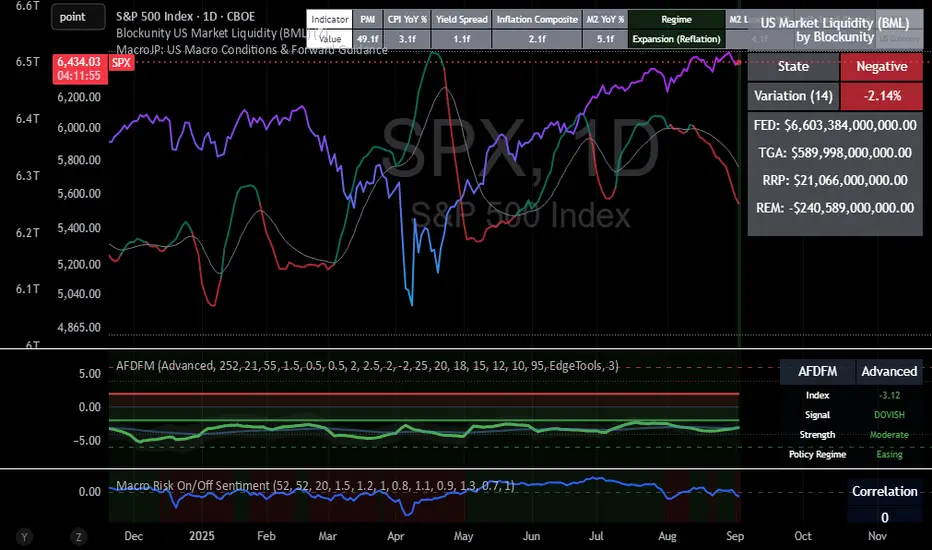
2. Liquidity (BML)
Net liquidity variation = –2.14% → negative.
TGA high + RRP large = drain on market cash.
Until liquidity turns up, upside momentum in equities stays capped.
3. Macro Risk Sentiment
Risk On/Off index slipped back below 0 (–0.45).
Summer highs near +1.5 showed strong appetite, but enthusiasm is fading.
Without liquidity improvement, sentiment is unlikely to push higher.
4. SPX Levels
Support: 6,350 → a break below risks 6,200.
Resistance: 6,500–6,550 → needs liquidity improvement to sustain.
Conclusion:
Fed tone = dovish to neutral, but liquidity = negative. That divergence is why SPX is stuck near the highs. A liquidity flip (TGA drawdown, RRP decline) is the trigger for the next breakout. Until then, expect range trading between 6,350 and 6,500.
Disclaimer: This is educational analysis, not financial advice.
SPX – Dovish Fed, Negative Liquidity, and the Next TriggerThe S&P 500 sits near 6,435, holding steady at highs while the liquidity backdrop remains negative. This divergence between price and plumbing sets up the next major move.
Macro backdrop:
The Advanced Fed Model (AFDFM) signals a dovish/easing regime, with moderate strength.
Liquidity, however, is still draining. Treasury’s cash account (TGA) remains elevated, while the Fed’s RRP facility continues to park trillions. Together, these offset easing policy tone.
Net liquidity (BML variation) = –2.14%, a headwind for equities.
Implication for SPX:
Liquidity and SPX correlation has weakened. Historically, that does not last long. Either liquidity improves, or price resets lower.
Key support sits at 6,350. A sustained break below would open 6,200.
On the upside, a liquidity turn (TGA drawdown + RRP decline) would support a breakout toward 6,500–6,550.
Conclusion / Trade View:
The market is balanced between a dovish Fed tone and restrictive liquidity mechanics. As long as SPX holds above 6,400, the structure favors upside, but liquidity needs to flip to sustain momentum. Watch for the next liquidity shift as the trigger.
Disclaimer: For educational purposes only. This is not financial advice.
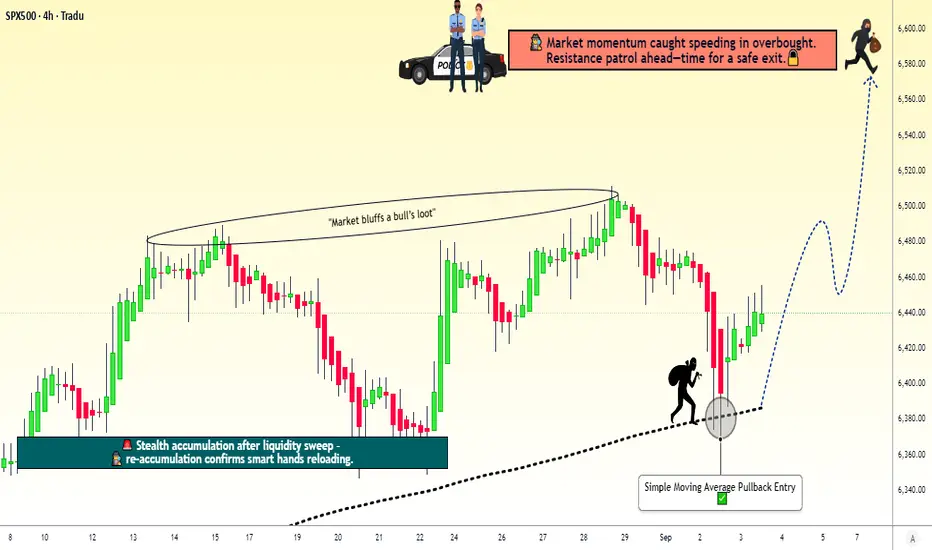
SPX500 Index – Ready for the Next Pullback Heist Move?🚨 SPX500 / US500 Index – The Money Heist Swing Plan 🎭💰
📊 Plan Overview
Bias: Bullish 200-SMA Pullback Plan @ 6380.00
Entry Strategy (Layering Style):
Thief strategy = multiple buy limit orders stacked like layers 🎯
6400.00 ✅
6410.00 ✅
6420.00 ✅
6440.00 ✅
(You can increase or adjust the layering based on your own style and risk tolerance.)
🛡️ Stop Loss (Thief SL)
SL: 6360.00 ⚠️
Dear Ladies & Gentlemen (Thief OG’s), adjust your SL to fit your risk style. This is just the plan’s guardrail.
🎯 Target / Exit
Target Zone: 6580.00 🚀
Note: This is the “Police Resistance” 🛑 – an overbought + trap zone. Escape with the stolen money 🎭💰 before getting caught.
Reminder: Not financial advice. You decide where to take profits.
🤔 Why This Plan?
🔹 200 SMA Pullback Logic: Price retraced into moving average = classic thief-style entry.
🔹 Layering Strategy Advantage: Building positions gradually improves average entry price & reduces risk.
🔹 Momentum & Sentiment: Neutral Fear & Greed Index (53/100) 😐 and low volatility (VIX 16.9) = stable environment for pullback entries.
🔹 Market Strength: US500 is up +16.81% YTD 🚀 with strong sector support (Alphabet +8.57%, Macy’s +19%).
🔹 Risk Factor: Economic data shows weakness (job openings & factory orders ↓), but bulls remain in control = reason for cautious layering.
🔹 Overall Outlook: Bullish score 65/100 ✅ → Mildly bullish bias fits perfectly with a buy-the-dip pullback strategy.
🔹 Trap Zone Awareness: Plan exits near resistance at 6580.00 to avoid overbought trap — thieves always escape before alarms go off 🚨.
📊 US500 INDEX CFD Real-Time Data (September 03)
Daily Change: +0.51% ↗️
Monthly Performance: +1.87% ↗️
Yearly Performance: +16.81% 🚀
All-Time High: 6,510.93 (August 2025)
😰😊 Investor Sentiment: Fear & Greed Index
Current Reading: 53/100 (Neutral) 😐
Trend: Balanced sentiment with no extreme fear or greed.
Key Indicators:
Market Momentum: S&P 500 above 125-day moving average (positive momentum) ↗️
Volatility (VIX): Low volatility (16.90), indicating stability 🟢
Options Activity: Put/Call ratio stable (no significant fear)
Junk Bond Demand: Moderate risk appetite
Safe Haven Demand: Bonds underperforming stocks (greed signal)
📈 Fundamental & Macro Score
Market Breadth: Moderate (balanced volume) ⚖️
Economic Data:
Job openings lowest since Sept (weakness) 🔻
Factory orders down -1.3% 🔻
Friday’s jobs report = critical ⚠️
Sector Performance:
Communication services (Alphabet +8.57%) 🟢
Consumer discretionary (Macy’s +19%) 🟢
Energy sector weak (Exxon Mobil -2.08%) 🔻
🐂🐻 Overall Market Outlook
Bullish Score: 65/100 (Mildly Bullish) ✅
Reasons:
Strong yearly gains (+16.81%)
Low volatility & neutral sentiment support stability
Tech & communication sectors leading momentum
Risks:
Weakening job & factory data
High valuations near ATH
💡 Key Takeaways
US500 trending upward with neutral short-term sentiment.
Friday’s jobs report = key catalyst.
Sector rotation in play: tech strong, energy weak.
Balanced fear/greed supports controlled bullish setups.
📌 Related Pairs to Watch
FOREXCOM:SPX500
CAPITALCOM:US500
TVC:DJI
NASDAQ:NDX
TVC:VIX (for risk gauge)
✨ “If you find value in my analysis, a 👍 and 🚀 boost is much appreciated — it helps me share more setups with the community!”
#SPX500 #US500 #IndexTrading #SwingTrade #LayeredEntry #SMAPullback #TradingPlan #StockMarket #SP500 #InvestorSentiment #FearGreed