US NAS 100Preferably suitable for scalping and accurate as long as you watch carefully the price action with the drawn areas.
With your likes and comments, you give me enough energy to provide the best analysis on an ongoing basis.
And if you needed any analysis that was not on the page, you can ask me with a comment or a personal message.
Enjoy Trading ;)
Trade ideas

How to Trade NASDAQ NAS100 Retracements Into An Imbalance🚀 NASDAQ NAS100 Analysis – Watching for a Bullish Opportunity 📈
I'm currently focused on the Nasdaq NAS100. On the weekly timeframe, it remains in a strong bullish trend 💹. Recently, however, we've seen a sharp and aggressive retracement. Given that the market was overextended, this pullback is healthy and expected, as price seeks to tap liquidity pools and rebalance ⚖️.
Zooming into the 4-hour timeframe, we can clearly identify a bullish imbalance 🔹. This area serves as my key point of interest for a potential move lower. The ideal scenario is for price to hold above the imbalance low and then break structure bullishly 🔼.
Key conditions for a high-probability long trade:
Price must not break below the imbalance low 🚫⬇️
Price must establish higher highs and higher lows to confirm bullish momentum 🔝
If these conditions align, I will be looking for a long entry opportunity. ⚠️ Not financial advice – this is purely market analysis for educational purposes.

NASDAQ100 HIGH PROBABILITY SETUP SOON!!!🚨 NAS100 HIGH PROBABILITY SELL/BUY SETUP 🚨
* Here We Can See Clearly The Next Potential Moves For US100 Coming Hours/Days.
* Keep Your Eyes Close On Your Trading Positions.
* Happy PIP Hunting Traders.
FXKILLA.

US100US100 is in bearish trend.
Potentially printing LH and LL.
No sign of reversal .
Alligator mouth open which also confirm trend will go down.
We sell at CMP.

US100 MARKET OUTLOOK!US100 had a sharp drop in price recently from in yesterday’s trading session. From the H4 perspective , we’re beginning to see a bearish momentum kick in. I’m looking forward to seeing more price drops. Therefore, a sell opportunity is envisaged.


NAS100 Trade Set Up Nov 4 2025Price is bearish making LH/LL on the 1h and 15m, has already swept BSL/London highs and inverted 15m FVG so i will be looking for sells down to SSL/London lows

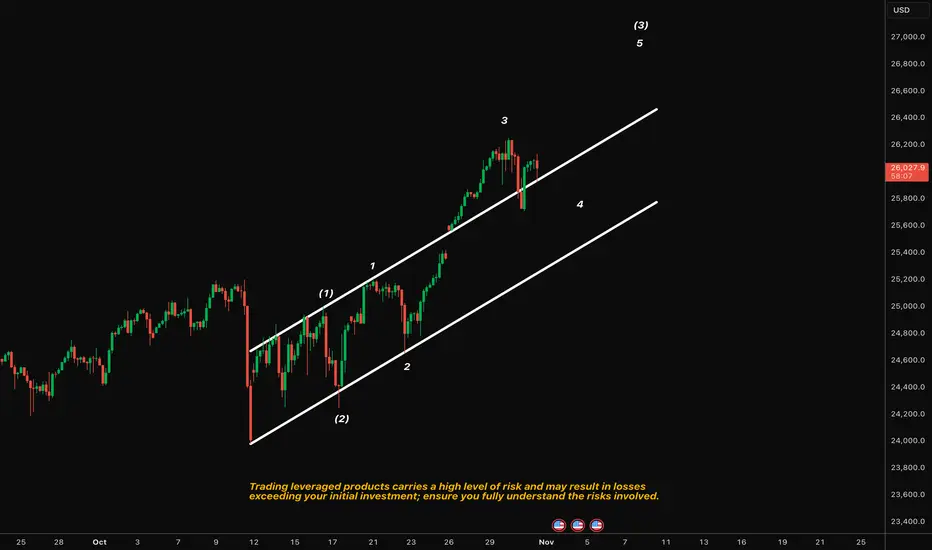
NASDAQ100 | Wave 4 Correction Within ChannelPrice has respected a clean ascending channel, completing a clear 1–2–3 wave sequence. We’re now seeing a corrective pullback that aligns with the wave 4 region — testing the midline support of the channel. As long as this structure holds, the broader wave (3) remains intact.
Scenarios:
Scenario A: If the lower channel and wave 4 region hold → potential continuation higher toward wave 5 and the upper boundary near 26,600–26,800.
Scenario B: If the channel support breaks → deeper correction likely toward 25,800 before any potential resumption of trend.
NAS100 Head and Shoulders on M15 still at PlayThe plan for Nas100 is still the same as my analysis on Friday.
Now we just need a break of those lower highs that formed on Friday so we can continue to short it to the gap as planned.

NAS100 Trade Set Up Nov 3 2025If price trades into PDH first i will wait for internal bearish structure to catch sells down to SSL/London Lows but if price comes to test 1h FVG first and respects it i will look for internal structure to catch buys to PDH

US NAS 100Preferably suitable for scalping and accurate as long as you watch carefully the price action with the drawn areas.
With your likes and comments, you give me enough energy to provide the best analysis on an ongoing basis.
And if you needed any analysis that was not on the page, you can ask me with a comment or a personal message.
Enjoy Trading ;)


US100 (NAS100) The Tech Sector's Next Breakout📊 Technical Context: The Range-Bound Reality
The 4-hour chart reveals that the NAS100 is currently entrenched in a narrow consolidation channel, forming a high-probability decision zone. The recent price action has tested a pivotal support region following a downward correction from the peak.
Key Structural Levels (Based on 4H Chart):
• Current Pivot: The index is trading near 25,866.9, which sits just above the primary consolidation floor.
• Immediate Resistance (Ceiling): The first significant barrier is the zone around 26,167.3.
• A definitive 4H candle close above this level would signal a short-term bullish breakout.
• Critical Support (Floor): The key technical floor is the consolidation range low near 25,560.0. This level must hold to maintain the current neutral to bullish structural bias.
Upside Targets:
• A break above 26,167.3 unlocks the path to the first swing high target at 26,566.8 (a +278.0 point move from the ceiling).
• The major continuation target sits at the recent swing high of 27,004.0 (a total upside potential of approximately +719.6 points).
Downside Targets:
• A decisive 4H candle close below 25,560.0 would invalidate the immediate range.
• The next major support and downside target is exposed at 25,217.4 (a downside target of approximately -519.2 points).
Technical Verdict: The market is poised for a volatility expansion move once a clear breakout occurs from the 25,560.0 - 26,167.3 range. The longer the consolidation persists, the more forceful the eventual move is likely to be.
📰 Fundamental Headwinds & Tailwinds
To achieve an Editor's Pick, this technical setup must be grounded in the macroeconomic forces driving the technology sector (NASDAQ's primary composition).
The Fed & Interest Rates (High Volatility Risk):
• The price action is highly sensitive to signals regarding interest rate cuts.
• Hawkish Commentary (Headwind): Any shift to a tighter monetary stance by the Federal Reserve (Fed) could quickly lead to a break of the 25,560.0 support, as higher rates reduce the present value of future earnings for growth stocks.
• Dovish Commentary (Tailwind): Signals indicating a pause or potential for future cuts will act as a strong fundamental catalyst, likely fueling a breakout toward 27,004.0.
Corporate Earnings and GDP Data (Directional Catalysts):
• Positive Earnings: Strong quarterly reports from the 'Magnificent Seven' (the largest NASDAQ components) are essential. Positive surprises can provide the fundamental fuel needed for a break above 26,167.3.
• Inflation/Employment Data: Upcoming releases of major economic indicators (such as the Consumer Price Index or Non Farm Payroll) will dictate market sentiment. Reports suggesting persistent inflation are a risk factor, while softening data supports a relief rally.
💡 Potential Trading Strategy
Traders should adopt a reactive, breakout-based strategy rather than anticipating the direction within the current range.
1. Bullish Breakout (Long Setup):
• Entry Confirmation: Wait for a clean 4H close above the resistance zone of 26,167.3 on increased volume, ideally coinciding with a positive fundamental catalyst.
• Initial Target: 26,566.8.
• Secondary Target: 27,004.0.
• Risk Management: Place a stop loss just below the consolidation ceiling (e.g., 26,000.0).
2. Bearish Breakout (Short Setup):
• Entry Confirmation: Wait for a decisive 4H close below the critical support of 25,560.0, triggered by adverse fundamental news or technical momentum.
• Initial Target: 25,217.4.
• Risk Management: Place a stop loss just above the broken support (e.g., 25,750.0).
FINAL SUMMARY
The NAS100 is presenting a high conviction "wait and confirm" setup. The technical structure provides clear boundaries, while the fundamental landscape (Fed policy and earnings) is poised to deliver the catalyst. Do not trade the range; trade the break.

NAS100 | US100 (Nasdaq 4H) – Technical OutlookUS100 (Nasdaq 4H) – Technical Outlook
📊 Market Structure:
Price has recently formed a weak high around 26,200, rejecting from a premium / supply zone, signaling potential short-term bearish pressure.
The previous upward structure showed a BOS (Break of Structure) near 25,000, confirming bullish intent earlier — but now momentum is slowing as price returns below the PDH (Previous Day High).
The current 4H candles show strong bearish reaction, indicating sellers defending the premium zone.
📉 Key Levels:
Supply Zone (Premium Area): 26,000 – 26,200
Equilibrium Zone: Around 24,800 – 25,000
Immediate Support: 25,800 (current PD level)
Weekly Pivot (PW): 25,400 (potential short-term target)
📈 EMA Confluence:
Price has rejected from above the 89 EMA (blue) and is now testing below it.
The 200 EMA (yellow) continues to trend upward, showing long-term bullish momentum, but the shorter EMAs suggest a short-term pullback.
As long as price stays below 89 EMA, bias remains bearish to neutral in the near term.
🎯 Trade Scenarios:
Scenario 1 – Short-Term Sell Setup:
Entry Zone: 25,950 – 26,100 (retest of premium area or EMA rejection)
Take Profit: 25,400 (PW)
Stop Loss: Above 26,250
Confluence: Supply zone + weak high + bearish EMA alignment
Scenario 2 – Bullish Continuation (after retracement):
Wait for price to retrace to the equilibrium zone (24,800–25,000)
Look for bullish reaction with confirmation from Stochastic RSI divergence
Target: Return to 26,000
📊 Indicators Insight:
Stochastic RSI: Currently dropping from overbought territory, indicating possible continuation of short-term downside.
Momentum slowing — ideal for short retracement trades before potential reversal.
Summary:
US100 is rejecting from premium resistance near 26,200.
Short-term bias: bearish retracement toward 25,400 or deeper 25,000 equilibrium zone.
Long-term bias remains bullish, supported by 200 EMA structure — watch for confirmation before re-entry buys.

NSDQ100 overbought pullback - dip buying opportunity? Equities saw a sharp reversal yesterday, led by weakness in tech and AI-related names. While it was only a single day’s selloff, sentiment has clearly shifted toward caution, with growing talk of a potential equity correction.
Market Dynamics
The Magnificent 7 stocks fell -2.28%, driving the Nasdaq 100 lower as investors reassessed stretched valuations.
Palantir (-7.9%) and Nvidia (-4.0%) were key drags, emblematic of overextended tech momentum — even positive earnings guidance wasn’t enough to support prices.
Broader weakness spread across the market: S&P 500 -1.17% (worst day since Oct 10), equal-weight S&P -0.63%, and Russell 2000 -1.78%.
The S&P ex-Mag-7 was down -0.75%, underscoring the narrowness of recent gains and rising concern over market concentration.
Macro & Other Drivers
The risk-off tone boosted Treasuries: 2yr yield fell to 3.58%, 10yr to 4.09%.
Broader sentiment was pressured by a prolonged U.S. government shutdown (now 36 days, the longest ever) with growing economic cost estimates ($10–30bn/week).
Bitcoin briefly recovered above $100k, but large holders sold ~400,000 coins (~$45bn), adding to the risk-aversion tone.
Political Context
Zohran Mamdani’s election as New York’s first democratic socialist mayor and new housing initiatives grabbed headlines but had limited market impact.
Takeaway for Nasdaq 100
The Nasdaq 100 faces renewed selling pressure as investors rotate out of AI-heavy leaders and take profits after a long rally.
Focus today will be on whether dip-buyers step in or if the correction broadens.
Key near-term catalysts: U.S. ISM Services and ADP employment data, plus earnings from Qualcomm, ARM, and DoorDash later today — all potential volatility triggers for tech sentiment.
This communication is for informational purposes only and should not be viewed as any form of recommendation as to a particular course of action or as investment advice. It is not intended as an offer or solicitation for the purchase or sale of any financial instrument or as an official confirmation of any transaction. Opinions, estimates and assumptions expressed herein are made as of the date of this communication and are subject to change without notice. This communication has been prepared based upon information, including market prices, data and other information, believed to be reliable; however, Trade Nation does not warrant its completeness or accuracy. All market prices and market data contained in or attached to this communication are indicative and subject to change without notice.

US100How to become successful in forex and stock trading:
1.Master fundamentals and technical analysis.
2.Build and follow a solid trading plan.
3.Apply strict risk management (4–6% rule).
4.Stay disciplined—control fear and greed.
5.Record and analyze every trade.
6.Focus on high-quality setups only.
7.Diversify across assets and markets.
8.Keep evolving—study, adapt, and grow daily.

NAS100 Forecast: A Fresh Bullish Impulse Toward New HighsThe NAS100 index is currently moving within a classic Elliott Wave structure. After completing wave (3), the market entered a correction phase that formed wave (4). This correction appears to have ended in the highlighted support zone, where buyers stepped in strongly. The five-wave pattern before wave (4) confirms a solid bullish trend. Now, the index seems to be preparing for the final upward move wave (5). This wave often represents the last push of a rally before a larger correction starts. As long as the price stays above the recent support near 24,400 , the next targets could be seen around 25,200–25,600 . In simple terms, the market is expected to continue its uptrend after a short pullback, following the typical Elliott Wave sequence of five upward waves and three corrective ones.

NAS100 | Bearish Momentum Extends The Nasdaq 100 fell about 2.1% (~500 points) as projected, maintaining a bearish outlook while technology stocks continued to weigh on market sentiment.
Below 25,700: Bearish continuation towards 25,340 → 25,230 → 25,000.
Above 25,700: Short-term recovery towards 25,820 → 26,170.

US100 Technical Analysis! BUY!
My dear friends,
US100 looks like it will make a good move, and here are the details:
The market is trading on 25826 pivot level.
Bias - Bullish
Technical Indicators: Supper Trend generates a clear long signal while Pivot Point HL is currently determining the overall Bullish trend of the market.
Goal - 25982
Recommended Stop Loss - 25749
About Used Indicators:
Pivot points are a great way to identify areas of support and resistance, but they work best when combined with other kinds of technical analysis
Disclosure: I am part of Trade Nation's Influencer program and receive a monthly fee for using their TradingView charts in my analysis.
———————————
WISH YOU ALL LUCK

US100 consolidation a bullish Phase TrendThe US100 remains within a short-term bearish trend, though recent price action suggests a potential recovery phase if support levels hold.
Technically Wall Street futures gained on Monday, marking a positive start to November. The move was supported by renewed optimism around oil demand and hopes of progress in U.S.–China trade relations, boosting overall risk appetite.
Key technical levels:
Resistance: 26,400 — A sustained move above this level could confirm bullish momentum and open the path for further gains. 25,700 If prices retrace to this zone and hold, we could see renewed buying pressure as investors position for a rebound a decisive break below 25,700 would likely signal a continuation of the downtrend, inviting further downside. In the short term, expect some volatility as the index tests these critical levels. If buying interest remains strong near support, the US100 could resume an upward correction, giving investors an opportunity to take short- to mid-term profits.
You may find more details in the chart.
Trade wisely best of Luck Buddies.
Ps; Support with like and comments for better analysis Thanks for Supporting.

Nasdaq 100 Analysis: Early November Movements Raise ConcernsNasdaq 100 Analysis: Early November Movements Raise Concerns
As the chart shows, the Nasdaq 100 index gained around 6% in October, supported by several key factors:
→ The meeting between US President Donald Trump and Chinese leader Xi Jinping, which helped ease tensions in trade relations between the world’s two largest economies.
→ A 0.25% rate cut by the Federal Reserve.
→ Positive earnings from major tech companies, including a strong report from Alphabet (GOOGL).
However, the market’s behaviour in early November is cause for concern — on the morning of 4 November, the stock index fell to its lowest level in a week. Bearish sentiment is being fuelled by:
→ uncertainty over the timing of the end of the government shutdown;
→ a weaker-than-expected ISM Manufacturing PMI report, which may reflect the impact of Trump’s tariffs on US industry.
Technical Analysis of the Nasdaq 100 Chart
Analysing the hourly chart of the Nasdaq 100 on 30 October, we:
→ confirmed the relevance of the upward channel (shown in blue), noting that the upper boundary was showing signs of resistance;
→ drew a steeper trajectory consisting of three orange lines;
→ suggested a profit-taking scenario, in which bears would attempt to push the Nasdaq 100 index down towards the median line of the blue channel.
This scenario has since materialised, as:
→ the median line has repeatedly acted as support (highlighted in blue);
→ the breakout level of the orange lines at 26,120 has turned into a resistance zone.
At present, the Nasdaq 100 index is trading in the lower half of the channel, indicating that the bullish momentum from late October has faded. Bulls might find support near the gap area, reinforced by the lower boundary of the blue channel.
This article represents the opinion of the Companies operating under the FXOpen brand only. It is not to be construed as an offer, solicitation, or recommendation with respect to products and services provided by the Companies operating under the FXOpen brand, nor is it to be considered financial advice.


NasdaqNasdaq is showing a correction pattern after a previous upward movement. The price closed below the old support zone and was rejected, confirming a resistance zone at 25,923.4.
The loss of this support reinforces the continuation of the corrective movement, with a projected drop towards the next support zone at 25,569.8, a point where there is convergence with the previous low and a potential area for absorbing buy orders.
