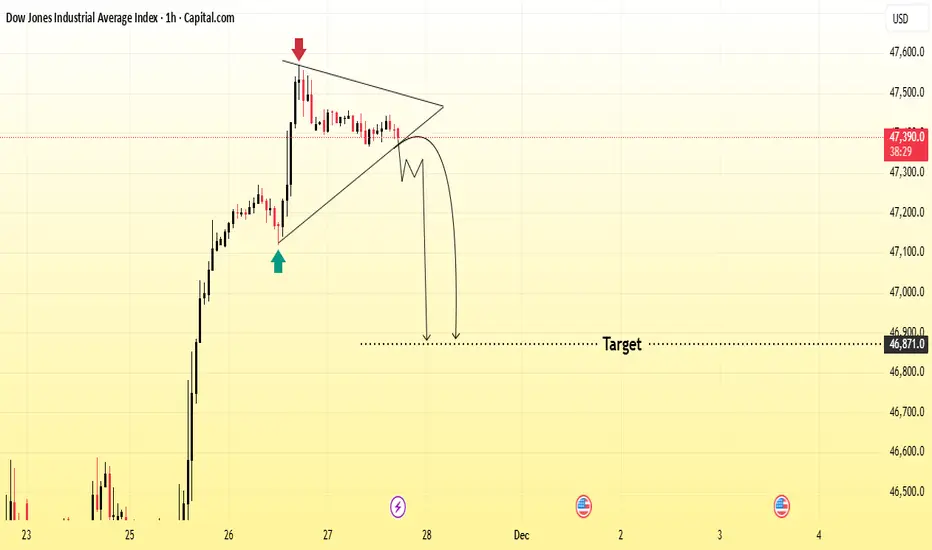
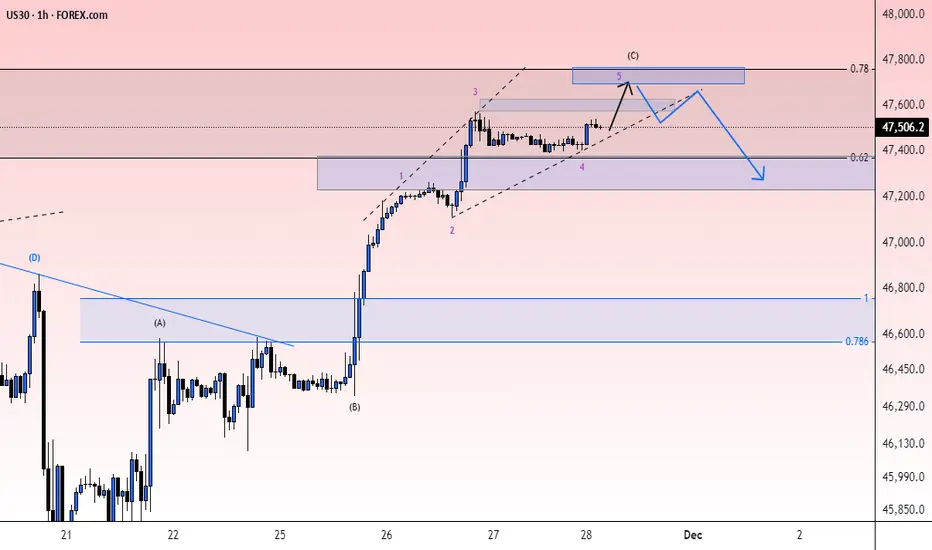
US30 Next Symmetrical Triangle Rejection AnalysisPrice is forming a symmetrical triangle after a strong bullish move. The chart shows rejection from the top (red arrow) and a possible breakdown from the triangle pattern.
If price breaks below the lower trendline, it may drop toward the marked target zone around 46,800–46,600.
Bias: Bearish below
About Wall Street, Daily
Dow Jones* often refers to the Dow Jones Industrial Average, which was one of the first stock indices and is one of the most commonly referred to barometers of equity performance in the United States. The Dow Jones Industrial Average, not to be confused with the Dow Jones Transportation index (which was the first index), is often called, "the Dow" or "DJIA," and consists of thirty stocks which traditionally were industrial-based. But in recent years as the US economy has become more consumer-oriented, the index has seen a change in composition that no longer has much to do with direct industrial investment.
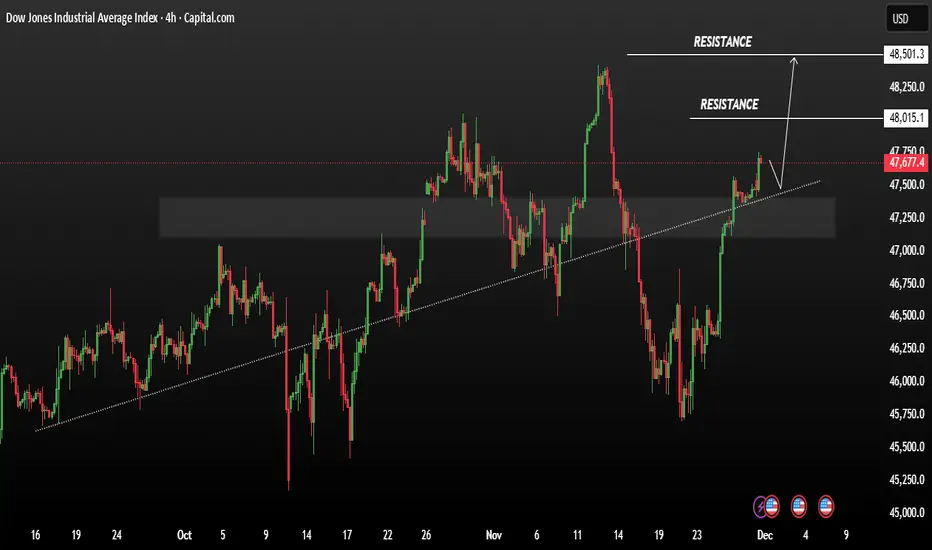
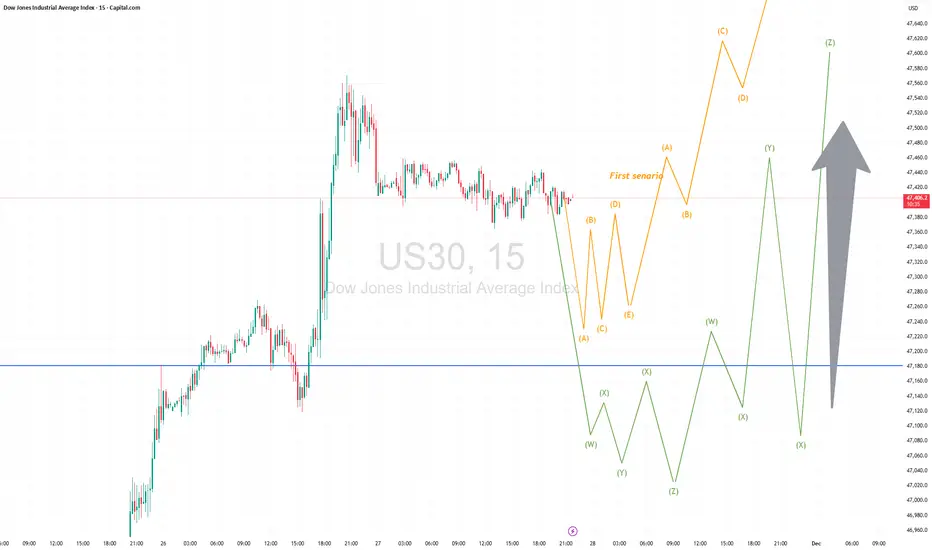
US30 Price consolidation bullish sequenceUS30 Price consolidation bullish sequence price action is shaping a potential continuation phase Price is currently testing a resistance zone,
Technically a rising trendline is supporting the price a well-defined ascending trendline has been respected multiple times price recently bounced from it a
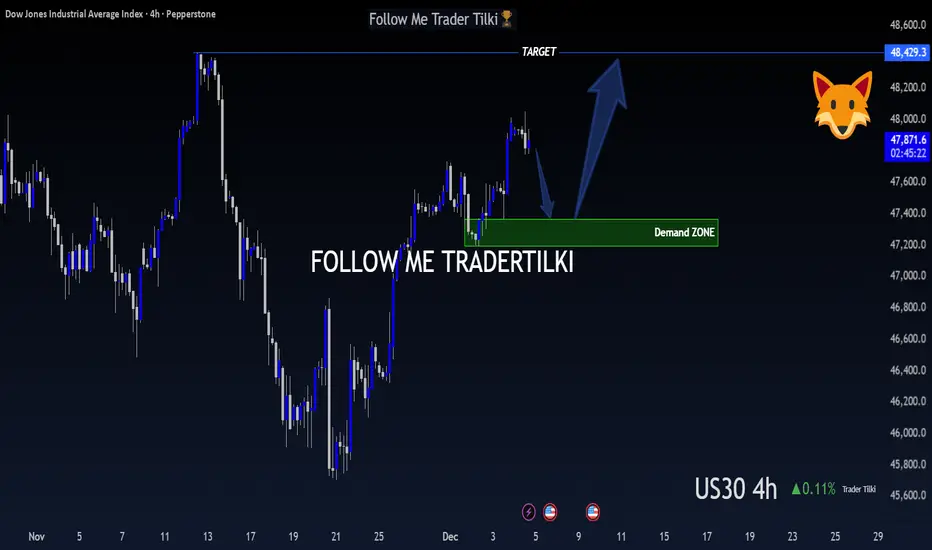
US30 (DOW JONES) – 4-Hour Timeframe Tradertilki AnalysisMy friends,
I have analyzed US30 on the 4-hour timeframe.
My friends, if US30 reaches the levels between 47,361 and 47,192, I will open a buy position.
My target will be the 48,429 level.
My friends, I share these analyses thanks to each like I receive from you.
Your likes increase my motivation
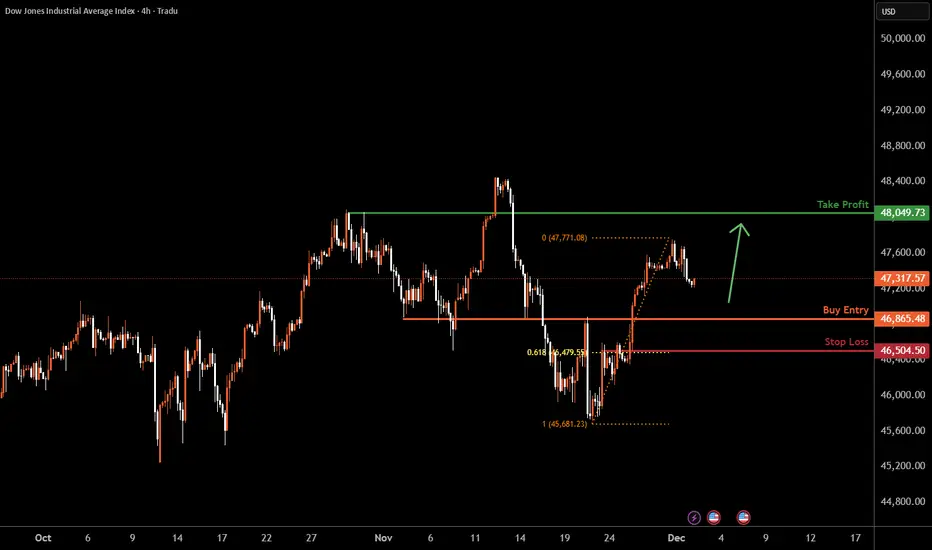
US30 H4 | Falling Towards Key SupportMomentum: Bullish
Price is pulling back toward our buy entry, which has been identified as an overlap support zone.
Buy Entry: 46,865.48
Strong overlap support
Stop Loss: 46,504.50
Pullback support
61.8% Fibonacci retracement
Take Profit: 48,049.73
Pullback resistance
High Risk Investment Warni
WARNING! 22 States Already In Recession.What the map is actually saying
This map claims that as of October 2025, 22 states are either:
Already in recession (red)
At high risk of recession (also red)
“Treading water” (yellow — basically flat growth)
Only the green states are shown as still expanding.
What this really means
This is a

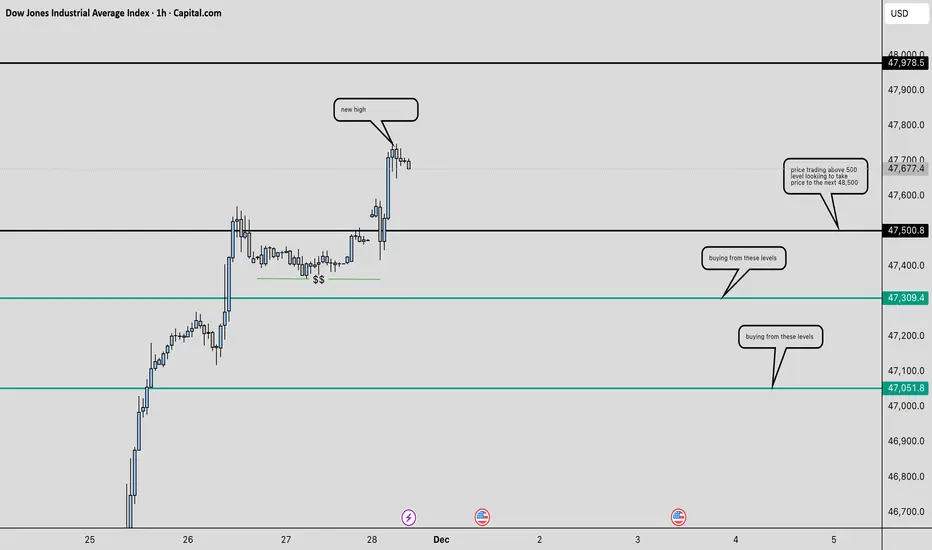
TRADING ODD FLATS ON US30
1} Trading US30 add flat ,i see that price made a over all high on the 4hr Time Frame 48 453
2} Now price is trending up i can trade the trend by buying off the odd flat 47,100,47 300 , 47 500 ect
3} Im trading looking for the market to make a pullback thats if it want to to make a pullback off th
Low Liquidity Alert – Thanksgiving WeekDuring Thanksgiving, market liquidity drops sharply.
When volume is low:
Markets move erratically
Stop hunts become more frequent
Price structure loses reliability
📌 Tip: Avoid entering heavy positions until the market returns to normal volume.
Sometimes the best trade is no trade.
As predicte
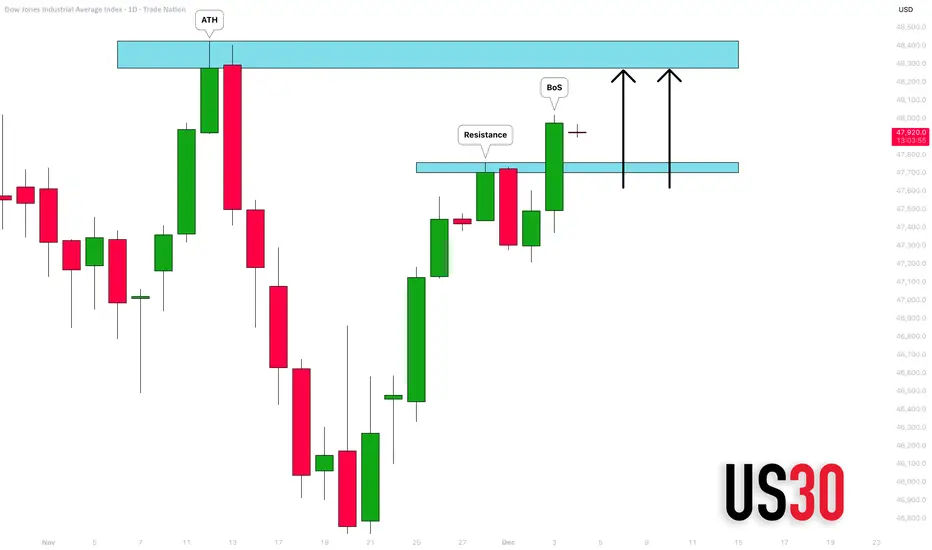
DOW JONES INDEX (US30): Confirmed BoS
With the yesterday's fundamental US news releases and
Trump's speech, US30 bounced strongly.
The market violated a significant daily resistance cluster
and closed above that.
It opens a potential for more growth to a resistance based
on a current All-Time High.
❤️Please, support my work wit
possibility of correction The price is expected to move in the specified direction and then change direction at the resistance area and start an downtrend.
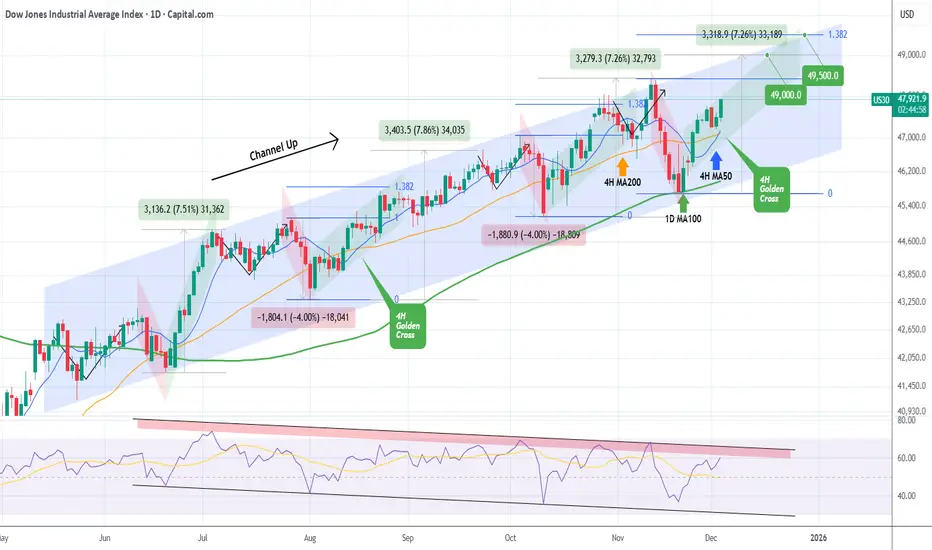
DOW JONES formed its first 4H Golden Cross since August. BullishDow Jones (DJI) has been trading within a 6-month Channel Up and today it formed its first 4H Golden Cross since August 15. Coming off a Higher Low bottom 2 weeks ago on the 1D MA100 (green trend-line), we are currently on the new Bullish Leg of the pattern.
The last one rose by +7.26%, roughly the
See all ideas
Displays a symbol's price movements over previous years to identify recurring trends.
Frequently Asked Questions
Wall Street, Daily reached its highest quote on Nov 12, 2025 — 48,420.5 USD. See more data on the Wall Street, Daily chart.
The lowest ever quote of Wall Street, Daily is 17,502.5 USD. It was reached on Nov 9, 2016. See more data on the Wall Street, Daily chart.
Wall Street, Daily is just a number that lets you track performance of the instruments comprising the index, so you can't invest in it directly. But you can buy Wall Street, Daily futures or funds or invest in its components.