Brace for Impact (I hope I am wrong)This market is reminiscent of the action before the 2020 crash. Above is now and below is 2020 covid crash. The charts are self explanatory so not much for me to say.
This is not a financial advice but for entertainment only. Please do your research!
Trade ideas

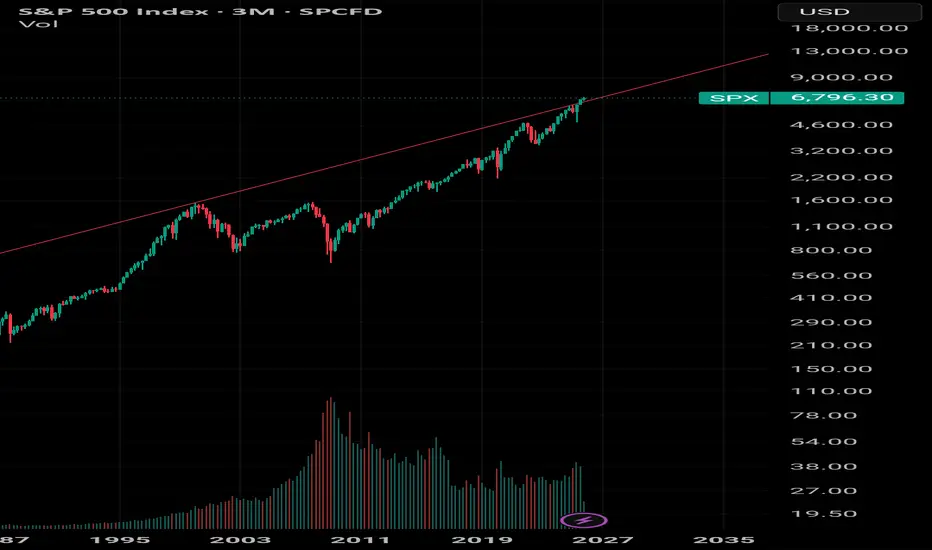
The amazing 100 year S&P log chartI love going back to this chart which tells us everything we need to know when asking the question why is buffet sitting in so much cash. It's an amazing chart and you can see what will Happen, what needs to happen but not when. Needless to say we are still above the red line.

S&P 500 ROAD TO 7000 $SPX1. Executive Summary:
Following a significant correction from the 5000 level, the S&P 500 showed initial signs of stabilization on April 7th, 2025. The index had previously been rejected from a major resistance zone near the psychologically significant 7000 mark, having peaked around 6900. The current technical structure suggests a period of consolidation or pullback is underway. Critical support is identified in a layered zone between 6600 and 6200. A key finding from Fibonacci retracement analysis indicates that a hold above the 0.236 level (6428.21) could provide the necessary momentum for a renewed bullish assault, with the ultimate objective of retesting and breaking the 7000 level.
2. Recent Price Action & Market Structure:
Bullish Regeneration (7th April): The price action on this date is technically significant as it represents the first meaningful attempt to "regain" footing after a sustained drop. This could indicate that the initial wave of selling has exhausted itself, allowing buyers to step in.
Key Resistance & Rejection: The prior rejection from the ~6900 zone is a pivotal event. The failure to break through 7000 created a clear ceiling, establishing this area as a major resistance level that the market must now overcome to resume a long-term bullish trend.
3. Support Zone & Fibonacci Analysis:
The market has defined a clear hierarchy of potential support levels that will be critical in determining the next major directional move.
Layered Support Levels:
Immediate Support (6600): This is the first line of defence for the bulls. A bounce from here would indicate underlying strength and suggest the pullback is shallow.
Primary Support (6400): This level converges closely with the key Fibonacci level and is therefore a high-priority zone for buyers.
Significant Support (6200): A breach below 6400 would make this the next critical floor. A hold here is essential to prevent a deeper correction.
Fibonacci Retracement Context:
The Fibonacci tool has been applied to the most relevant upward move (likely from the 5000 low to the 6900 high).
0.236 Fibonacci Level (6428.21): This level is critically important. It represents a shallow retracement of the prior uptrend. The fact that it aligns with the identified 6400 support zone adds significant technical confluence.
Bullish Implication: A successful "bounce" from this ~6400/6428 confluence zone would be a strongly bullish signal. It would indicate that the broader uptrend remains intact and that the drop from 6900 is merely a healthy correction within a larger bull market. This would be the confirmation needed to project a move back towards the 7000 resistance.
Deeper Retracement Scenario (0.382 at 6123.76): Should the 0.236 level fail, the next major support resides at the 0.382 Fib level (6123.76), which aligns with the 6200 support. A bounce from this deeper level would still be constructive but would indicate a longer and more significant period of consolidation before a new high can be attempted.
4. Synthesis and Forward Projection:
The technical picture presents two primary scenarios:
Bullish Scenario (High Probability if 6400 Holds): The index finds strong support at the 6400/6428 confluence zone. The bounce initiated on April 7th accelerates, pushing the price back through the 6600 level and setting the stage for a retest of the 6900-7000 resistance area. A breakout above 7000 would then open the door for further all-time highs.
Consolidation Scenario (If 6400 Breaks): A break below the 0.236 Fib support shifts focus to the 6200/6123 zone. The market would likely enter a longer period of range-bound trading between ~6100 and ~6800 before gathering enough momentum for its next sustained move.
Conclusion:
In summary, while the S&P 500 faces clear overhead resistance following its rejection near 7000, the pullback is currently testing a critical support confluence near 6400. The bullish thesis for a "bounce back to 7000" is technically valid, but it is entirely contingent upon the index defending the 0.236 Fibonacci retracement level (6428.21) and the 6400 support zone. A trader should watch for confirmed bullish reversal signals (e.g., strong bullish engulfing candles, positive RSI divergence) at this level as the potential trigger for the next leg up.

SPX | Daily Analysis #12 - 10 November 2025Hello and Welcome Back to DP,
Review and News:
Last week was quite eventful. The index plunged toward the 6,640 area before a sharp rebound—helped in part by a series of market-friendly statements and tweets from former President Trump, which appeared to lift sentiment. Despite trading down more than 1.3% intraday, the market recovered impressively and ultimately closed the session in the green.
This week, investors will be watching closely to see whether Trump continues to influence sentiment with further comments or appearances that could help fuel market volatility and optimism. The shutdown remains at the center of U.S. politics. The Senate has advanced a temporary funding bill extending federal funding through January and reversing some layoffs, but final approval by the House and the President’s signature is still pending. Until a resolution is reached, uncertainty will linger across markets and public services.
The October Consumer Price Index (CPI) report—typically one of the most closely watched inflation indicators—is likely to be delayed due to the ongoing federal government shutdown. The lack of fresh data is creating a “data fog” for policymakers and traders alike.
Technical Analysis:
🟩 Demand Zones (Support Areas)
6,735 – 6,748 region
Multiple touches and strong buying reaction.
Large bullish candles emerged after price retested this area → indicates strong institutional demand.
It’s the nearest demand and acts as immediate support.
If broken, next possible downside continuation zone would be near 6,700 – 6,710.
Lower demand extension (6,730 – 6,740)
Good confluence with volume spike at lows → buyers defended this region before a sharp move up.
🟥 Supply Zones (Resistance Areas)
6,813 – 6,834 region
Clear previous consolidation before a breakdown.
This area now acts as a major supply / resistance zone.
Expect sellers to step in if price retests this zone — first test may trigger rejection.
It’s aligned with a local structure high; several long upper wicks in the past confirm supply pressure.
Above 6,834 → potential next supply
Around 6,850 – 6,860 (top of previous distribution).
Disclaimer:
This content is for informational purposes only and does not constitute financial or investment advice. © DIBAPRISM
Amir D.Kohn

V Pattern In SPX/USDHey fellow traders and followers! Look what I found on the 8hr SPX chart.
Looks like a developing V pattern so far. What could that mean ?
Means up to me.
Here are the numbers; We need to break and hold above the Break Line of 6873.1 area to solidify a long position to Target 1) 6939.7
Target 2) 6966.7
I can't stress enough the importance of the Break Line area being a solid support in order for the trade to have a 8 out of 10 chance to make you money. This move if reached fetches a nice profit $$$ Just look at the points you can gain where I posted it on the chart.
Ok, let's see how things play out... See you at the starting gate $$$


S&P long amid positivity on US Gov shutdownPossibly long on S&P as positivity around the potential reopening of the US government.
Markets gap higher Sunday open on the news and provides a good area to trade off.
4hr chart
- Rejected off fib retracement
- Broken counter trendline and resistance
- Fill of gap and retest of trendline provides good area of support
Would require confirmation on lower TF breakout
Caution around earnings and missed data to be released upon the government reopening.

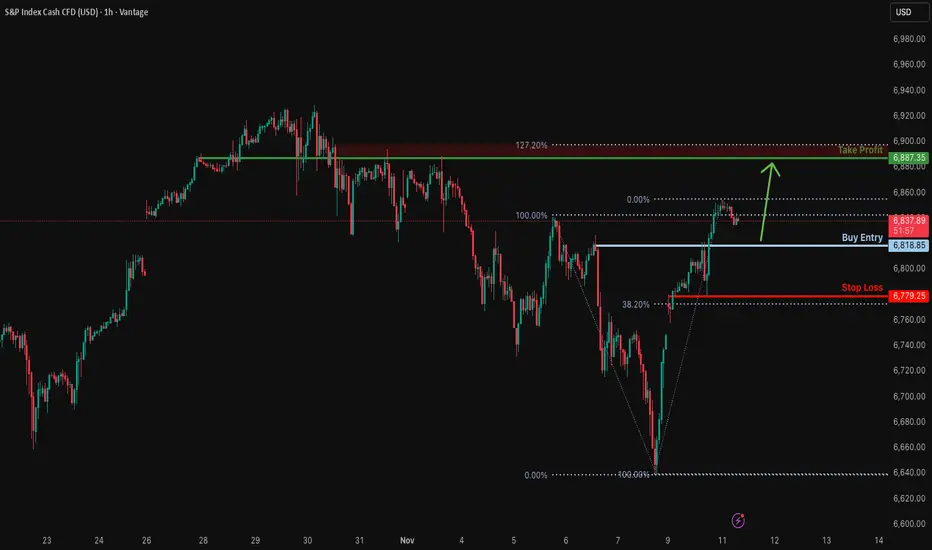
Bullish continuation setup?S&P500 is falling towards the support level, which is a pullback support and could bounce from this level to our take profit.
Entry: 6,618.85
Why we like it:
There is a pullback support level.
Stop loss: 6,779.25
Why we like it:
There is a pullback support that lines up with the 38.2% Fibonacci retracement.
Take profit: 6,887.35
Why we like it:
There is an overlap resistance that is slightly below the 127.2% Fibonacci extension.
Enjoying your TradingView experience? Review us!
Please be advised that the information presented on TradingView is provided to Vantage (‘Vantage Global Limited’, ‘we’) by a third-party provider (‘Everest Fortune Group’). Please be reminded that you are solely responsible for the trading decisions on your account. There is a very high degree of risk involved in trading. Any information and/or content is intended entirely for research, educational and informational purposes only and does not constitute investment or consultation advice or investment strategy. The information is not tailored to the investment needs of any specific person and therefore does not involve a consideration of any of the investment objectives, financial situation or needs of any viewer that may receive it. Kindly also note that past performance is not a reliable indicator of future results. Actual results may differ materially from those anticipated in forward-looking or past performance statements. We assume no liability as to the accuracy or completeness of any of the information and/or content provided herein and the Company cannot be held responsible for any omission, mistake nor for any loss or damage including without limitation to any loss of profit which may arise from reliance on any information supplied by Everest Fortune Group.
USA S&P 500 IndexPrice has completed a clean sweep of sell-side liquidity and is now showing strong displacement toward the upside. The recent break in structure confirms short-term bullish intent.
If price returns to the fair value gap or discount zone, I’ll look for confirmation to enter in alignment with the intraday bullish flow.
My first target remains the internal liquidity zone, and the potential extended target is the previous day’s high where buy-side liquidity rests.

Did You Buy The Dip? Heres What we bought!Today the SPX had an incredible morning selloff - met with and even more incredible rally.
The markets were in turmoil today up until the bulls stepped in and made a red to green reversal.
Days like today often create the biggest portfolio gains when you can buy stock at depressed levels.
We accumulated 6 position longs today.
Massive technicals were tested and defended today.

S&P500 index weekly logarithmic chart hitting 2,618 extensionI have meticulously tagged every turn and twist since 2009 on this chart. Using elliottwave theory I believe that this structure is ending. Bear market next? I do not know, what I do know is that it's been a fabulous run since 2009. I'm short NQ futures December contract. Good luck

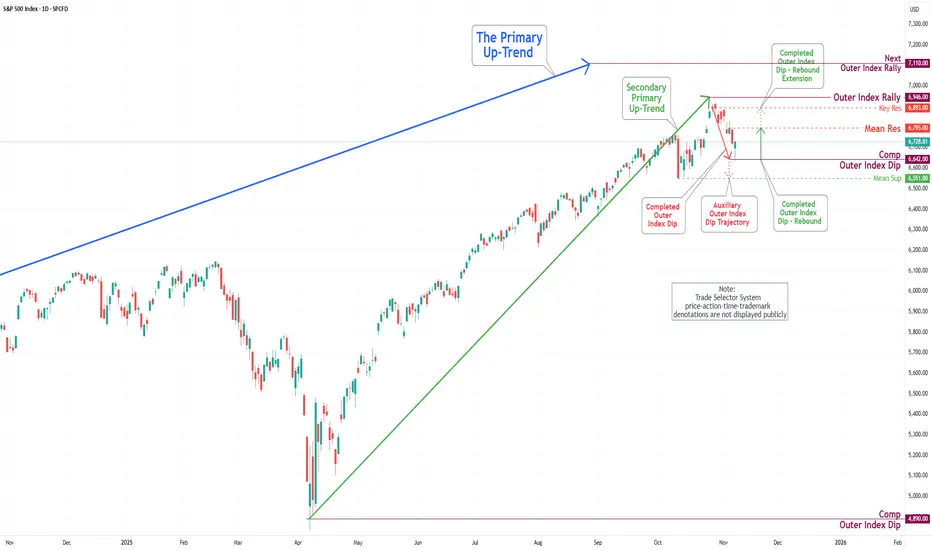
S&P 500 Daily Chart Analysis For Week of Nov 7, 2025Technical Analysis and Outlook:
During the recent trading session, the S&P 500 Index experienced a notable decline, underscoring the significance of our key target, situated at the Mean Support level of 6,740. The index has now completed the Outer Index Dip at 6,642. This positioning indicates the potential for further upward movement, with the target established at the Mean Resistance level of 6,795. The prevailing trend suggests a well-structured extension towards the Key Resistance level of 6,893, with an ultimate target for the Outer Index Rally set at 7,110.
Nevertheless, it is crucial to acknowledge the possibility of a substantial drawdown in the forthcoming week’s trading session. This may lead to a retest of the Outer Index Dip at 6,642, possibly resulting in a further decline to the Mean Support level at 6,551 before ultimately resuming an upward trajectory.
S&P 500 — The Market Cycle Nears Its Turning PointS&P 500 Technical Outlook — The Market Cycle Nears Its Turning Point
Market Overview
The S&P 500 Index continues to follow its recurring market cycle pattern, which typically spans around 10–12 months.
After an impressive rally since mid-2024 that pushed the index to a new high near 6,900, early signs now suggest that the market may be entering the late stage of its uptrend cycle.
Momentum indicators have started to weaken, and profit-taking pressure is emerging — both of which are common signals seen before a mid-cycle correction phase begins.
Technical Analysis
1. Major Trend
The yellow trend lines highlight two major upward waves in this cycle.
Each rally ended with a 10–15% correction before the next advance.
Currently, the index is showing signs of exhaustion near the 6,900 resistance zone — marking a potential top for this cycle.
2. Repetitive Cycle Behavior
The blue dotted arcs represent cyclical market behavior seen repeatedly over the past few years.
If history rhymes, a sharp sell-off could occur around mid-December 2025, forming the next cycle low.
The projected downside target lies near 5,800–5,900, which could act as the base for the 2026 recovery phase.
3. Key Levels to Watch
Resistance: 6,800 – 6,900
Intermediate Support: 6,200
Major Support (Cycle Low Zone): 5,800 – 5,900
Forecaster’s View
“The S&P 500 is likely entering a mid-cycle correction phase after reaching its recent peak.
A sharp decline around mid-December 2025 could mark the turning point before a new accumulation phase begins in 2026.”
Strategic Outlook:
Short-Term Traders: Focus on the 6,200–6,800 range; avoid chasing strength near resistance.
Medium- to Long-Term Investors: Prepare to accumulate near 5,800, which could represent a cycle bottom for this phase.
Cycle Followers: Watch for capitulation or panic-selling around mid-December 2025, often a precursor to the next bullish cycle.
Summary
The current S&P 500 structure demonstrates a clear cyclical rhythm — every deep correction has historically paved the way for the next strong expansion.
If the December sell-off unfolds as expected, 2026 could mark the start of a new major uptrend, turning short-term volatility into long-term opportunity for strategic investors.

Evolution and Growth of the Hedge Fund Industry1. Origins of Hedge Funds (1940s–1960s)
The concept of hedge funds began in 1949 when Alfred Winslow Jones, a sociologist and financial journalist, launched the first modern hedge fund. Jones introduced the revolutionary idea of combining long and short positions to hedge against market fluctuations, aiming to reduce risk while maximizing returns. He also implemented performance-based fees, taking 20% of profits, a structure that became standard across the industry.
Jones’ approach—using leverage, short selling, and active management—distinguished his fund from traditional mutual funds, which were restricted by regulations and passive investment mandates. His strategy sought “absolute returns” regardless of market direction, laying the foundation for modern hedge fund philosophy.
Throughout the 1950s and 1960s, hedge funds remained relatively obscure, operating primarily as private partnerships for high-net-worth individuals. Their secrecy and exclusivity contributed to an aura of mystery that persists even today.
2. Expansion and Innovation (1970s–1980s)
The 1970s marked a period of economic volatility, including oil shocks, inflation, and market instability. These conditions provided fertile ground for hedge funds, which thrived on flexibility and alternative strategies. During this era, funds began to diversify beyond simple long-short equity plays into macro strategies, arbitrage, and event-driven investing.
The 1980s saw an acceleration of growth, largely driven by financial deregulation, advances in technology, and the rise of institutional investors. Hedge funds started attracting endowments and pension funds seeking diversification and higher returns. Managers like George Soros and Julian Robertson became iconic figures. Soros’ Quantum Fund famously made $1 billion by shorting the British pound in 1992, an event that showcased the power of hedge funds in global finance.
Hedge funds also began to operate across borders, benefiting from globalization and the liberalization of capital markets. Their ability to move swiftly in and out of markets made them powerful players in global finance, influencing currencies, interest rates, and stock indices.
3. Institutionalization and Mainstream Growth (1990s)
The 1990s were a turning point when hedge funds transitioned from exclusive private partnerships into an institutionalized investment industry. Large investors—such as university endowments, foundations, and pension funds—began allocating significant capital to hedge funds as part of diversified portfolios.
The proliferation of new strategies defined this decade. Hedge funds expanded into convertible arbitrage, fixed income arbitrage, global macro, distressed securities, and emerging markets. This diversification not only attracted new investors but also mitigated risks by spreading exposure across multiple asset classes.
The 1990s also brought increased attention to hedge funds’ impact on financial markets. The collapse of Long-Term Capital Management (LTCM) in 1998 highlighted both the sophistication and fragility of hedge fund strategies. LTCM’s use of massive leverage and complex derivatives led to a near-systemic crisis when markets turned against it. The U.S. Federal Reserve intervened to organize a bailout, illustrating hedge funds’ growing systemic importance.
Despite this setback, the industry continued to grow. Hedge funds became symbols of financial innovation and intellectual talent, often recruiting PhDs, mathematicians, and computer scientists to develop quantitative and algorithmic models that enhanced investment precision.
4. The Boom Years (2000–2007)
The early 2000s were the golden age of hedge funds. The industry’s assets under management (AUM) grew exponentially—from around $500 billion in 2000 to over $2 trillion by 2007. This growth was fueled by several factors:
Market turbulence following the dot-com crash increased demand for non-traditional investments.
Low interest rates and easy credit encouraged the use of leverage.
Institutional acceptance expanded, with funds-of-funds acting as intermediaries for smaller investors.
Globalization and technology enabled sophisticated strategies across markets and asset classes.
Hedge fund managers such as John Paulson, Ray Dalio, and David Einhorn became household names, with funds generating outsized returns. The diversity of strategies—from statistical arbitrage to credit default swaps—helped hedge funds outperform traditional asset classes.
However, the industry’s success also brought scrutiny. Critics argued that high fees, secrecy, and leverage created systemic risks. Regulators began exploring ways to increase transparency and oversight.
5. The Global Financial Crisis and Aftermath (2008–2012)
The 2008 global financial crisis was a defining moment for the hedge fund industry. Many funds suffered significant losses due to market collapses and liquidity freezes. However, hedge funds fared better than traditional asset managers overall, as their flexible strategies allowed quicker adaptation to market turmoil.
The crisis reshaped the industry in several ways:
Regulatory oversight increased, particularly through the Dodd-Frank Act in the U.S., which mandated registration, disclosure, and risk reporting.
Investor demands shifted toward transparency, liquidity, and risk management.
Fund closures and consolidations occurred as smaller or over-leveraged funds failed to recover.
Despite short-term setbacks, the post-crisis period laid the groundwork for a more stable, professionalized, and transparent hedge fund ecosystem.
6. Maturity and Technological Transformation (2013–Present)
In the 2010s and beyond, the hedge fund industry entered a mature phase marked by both stability and competition. Assets under management exceeded $4 trillion globally, with thousands of funds operating across diverse strategies.
The rise of quantitative funds and machine learning-driven strategies revolutionized the landscape. Firms like Renaissance Technologies, Two Sigma, and AQR Capital Management demonstrated how big data, artificial intelligence, and algorithmic trading could generate alpha with minimal human intervention.
Simultaneously, hedge funds faced new challenges:
Fee pressure due to underperformance relative to benchmarks.
Competition from passive investing (ETFs and index funds).
Demand for ESG (Environmental, Social, and Governance) integration as investors prioritized sustainability.
Regulatory constraints and increased compliance costs in multiple jurisdictions.
Yet, hedge funds continued to evolve. Many adopted hybrid models, blending traditional discretionary investing with automated systems. Others expanded into private credit, venture capital, and digital assets, reflecting their adaptive DNA.
7. Globalization and the Future Outlook
Today, hedge funds are an integral part of the global financial ecosystem. They operate across continents—from New York and London to Singapore and Hong Kong—serving a diverse investor base that includes sovereign wealth funds, pension funds, and family offices.
The future of hedge funds lies in innovation and adaptability. Artificial intelligence, blockchain, and decentralized finance (DeFi) are expected to reshape strategies, data analytics, and operational efficiency. Moreover, the increasing focus on sustainability and impact investing suggests a new generation of “green hedge funds” that align profit motives with ethical imperatives.
While traditional hedge fund models may face fee compression and rising competition, the industry’s agility ensures its relevance. The drive for alpha generation, risk diversification, and strategic flexibility remains the cornerstone of hedge fund success.
Conclusion
The evolution of the hedge fund industry—from Alfred Winslow Jones’ experimental partnership in 1949 to today’s global network of multi-strategy investment giants—illustrates a story of innovation, resilience, and adaptability. Each era brought unique challenges and transformations, from the intellectual revolution of long-short strategies to the data-driven frontiers of algorithmic trading.
Despite cyclical setbacks, hedge funds have consistently evolved to meet changing market conditions and investor demands. Their journey underscores a central truth: the pursuit of absolute returns and risk-adjusted performance will always attract investors seeking to outpace the market. The hedge fund industry, now a mature yet dynamic force, continues to shape the future of global finance—balancing secrecy with sophistication, and innovation with responsibility.

Inverse Cup&Handle On 12hr SPX/USDFellow traders! We could have a Inverse Cup & Handle on the 12hr SPX.
This could also be a development of a H&S . Time will tell but for now I measured a move from the cup & handle and get a target of 6594.1
Chart patterns pop up we take action only when we get the break of a break line which in this case has happened so we pounce.
Best of luck in all your trades, see you at the finish line $$$

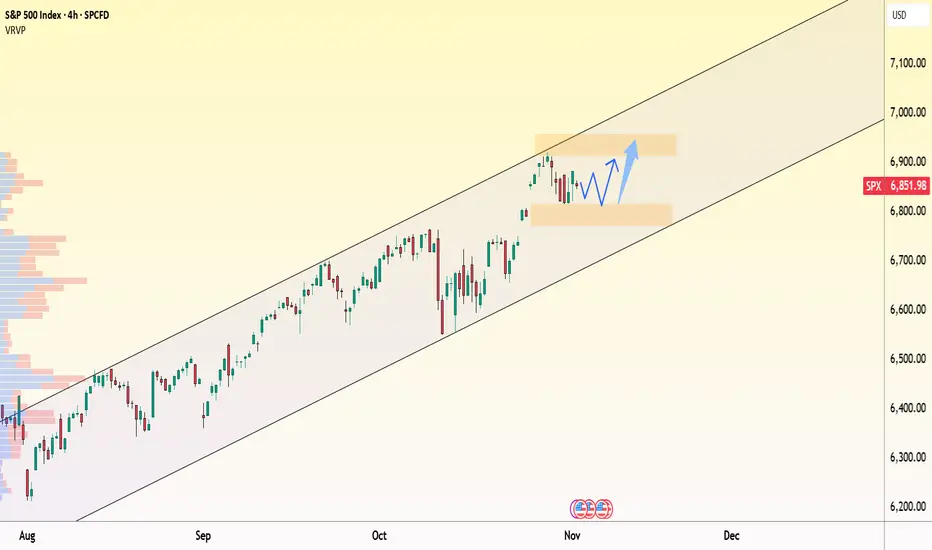
SPX:uptrend remains intact – consolidating for the next breakoutOn the 4-hour chart, the S&P 500 (SPX) continues to move firmly within its ascending channel , with the current range around 6,850–6,900 representing a healthy pause after a strong rally. The nearest support sits at 6,800, where buyers previously stepped in, while short-term resistance remains near 6,900.
From a news perspective, the rally is still being driven by tech and AI sectors , especially after the Amazon–OpenAI partnership deal , which reignited positive sentiment across the market. However, investors remain cautious ahead of upcoming U.S. ADP employment and ISM PMI data , which could influence the Fed’s next rate-cut decision.
Overall, the technical structure still supports an upward bias: SPX is consolidating between 6,800–6,900 before potentially breaking toward the 7,000-point zone , aligning with the upper boundary of the trend channel.
As long as the 6,800 support holds, the market retains room for another bullish leg in the sessions ahead, backed by renewed capital inflows into leading sectors.
SPX Breaks Down: Tech Momentum Cools as Risk-Off Sentiment BuildThe S&P 500 just broke below its short-term descending channel — confirming selling pressure is building. High-valuation tech and AI names like NASDAQ:NVDA , NASDAQ:MSFT , NASDAQ:GOOGL , NASDAQ:MU , and NASDAQ:PLTR are leading the pullback as investors rotate out of crowded trades.
Macro headwinds — Fed uncertainty, stretched valuations, and global weakness — are weighing on sentiment. Near-term bias stays bearish unless SP:SPX can reclaim 6,850.

Battle at the 18maSPX futures gapped up and got to the 18ma area. If we close below the 18 today it would likely be bearish, and a close above would be likely bullish. There's a gap on futures which may get filled. Gold had a nice bounce but it's also testing it's 18ma resistance here. BTC is at resistance. Oil is holding support at around 60 dollars.

S&P500 H1 | Bullish Bounce off Key SupportMomentum: Bullish
Price is currently above the ichimoku cloud.
Buy entry: 6,811.61
- Pullback support
- 50% Fib retracement
- 100% Fib projection
Stop Loss: 6,773.85
- Swing low support
Take Profit: 6,848.7
- Overlap resistance
Stratos Markets Limited (tradu.com/uk ):
CFDs are complex instruments and come with a high risk of losing money rapidly due to leverage. 68% of retail investor accounts lose money when trading CFDs with this provider. You should consider whether you understand how CFDs work and whether you can afford to take the high risk of losing your money.
Stratos Europe Ltd (tradu.com/eu ):
CFDs are complex instruments and come with a high risk of losing money rapidly due to leverage. 70% of retail investor accounts lose money when trading CFDs with this provider. You should consider whether you understand how CFDs work and whether you can afford to take the high risk of losing your money.


SPX500 - Biggest Weekly Loss as AI Valuations Face ScrutinySPX500 – MARKET OUTLOOK | Biggest Weekly Loss as AI Valuations Face Scrutiny 🇺🇸
The S&P 500 posted its largest weekly loss in weeks as investors questioned high AI stock valuations and shifted toward safer assets.
The index remains under bearish pressure while trading below 6,770, with momentum favoring further downside.
🔽 Below 6,770: Bearish continuation toward 6,705 → 6,670 → 6,610.
🔼 Above 6,782: Bullish correction toward 6,814 → 6,842.
Pivot Zone: 6,755–6,765
Support: 6,705 · 6,670 · 6,610
Resistance: 6,798 · 6,814 · 6,842
SPX500 remains bearish while below 6,770, but a confirmed 1H close above 6,782 could trigger a short-term recovery toward 6,814–6,842.

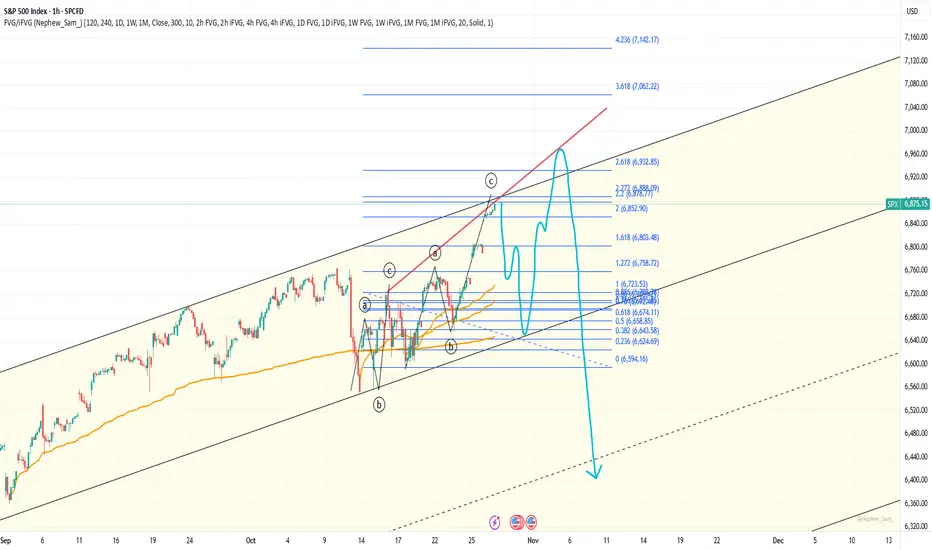
Ending expanding diagonal scenarioJust a possible scenario. If I'm right, wave 3 ends here, and wave 4 correction should start very soon.