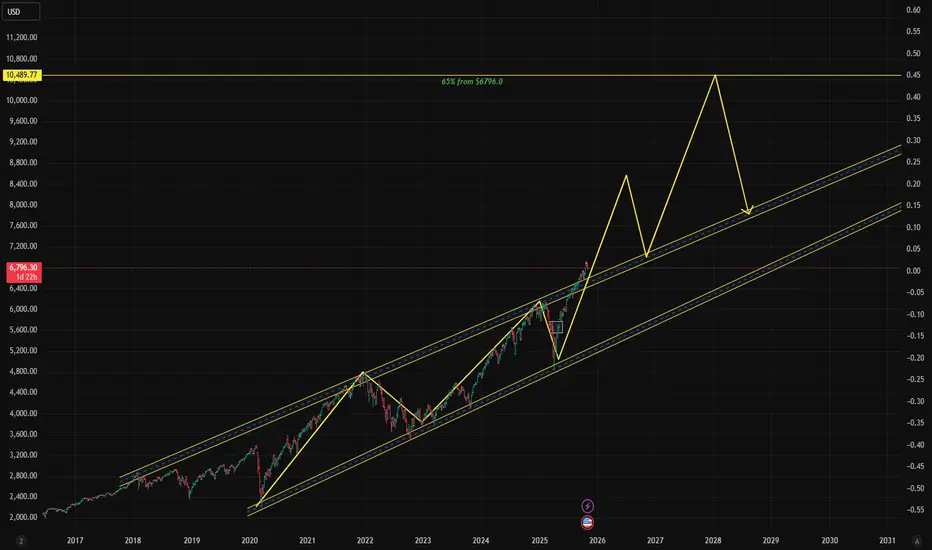
$SPX Hi, we are back with another one: SP:SPX !!!
As we can see we have SP:SPX sitting at $6796.30 with and expectation for a 65% pump.
That would bring us around $9-$10K per 1 SP:SPX .
Wouldn't that be incredible if we can see this by 2026 -2028 ?
What a time to be alive no ?
Don't forget to comment like and share for good luck :) !!!
Trade ideas
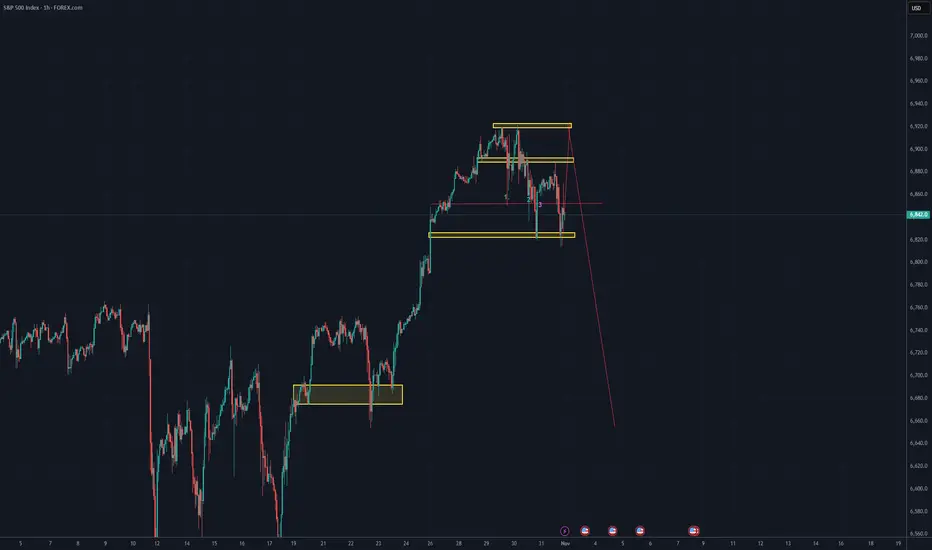
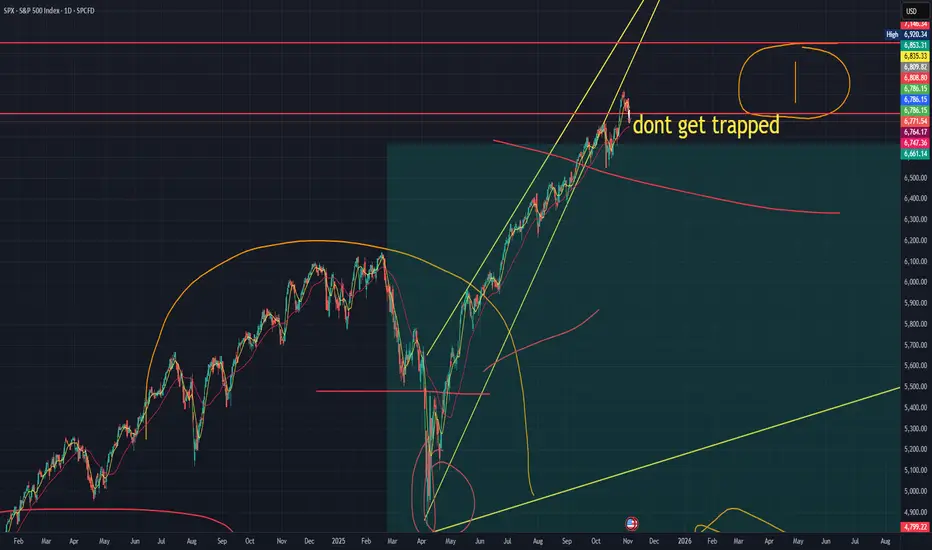
Brace for Impact (I hope I am wrong)This market is reminiscent of the action before the 2020 crash. Above is now and below is 2020 covid crash. The charts are self explanatory so not much for me to say.
This is not a financial advice but for entertainment only. Please do your research!

SPX Breaks Down: Tech Momentum Cools as Risk-Off Sentiment BuildThe S&P 500 just broke below its short-term descending channel — confirming selling pressure is building. High-valuation tech and AI names like NASDAQ:NVDA , NASDAQ:MSFT , NASDAQ:GOOGL , NASDAQ:MU , and NASDAQ:PLTR are leading the pullback as investors rotate out of crowded trades.
Macro headwinds — Fed uncertainty, stretched valuations, and global weakness — are weighing on sentiment. Near-term bias stays bearish unless SP:SPX can reclaim 6,850.

S&P 500: Overheated Valuation vs. SeasonalityAs the S&P 500 posts a Shiller CAPE ratio of 40.24 in early November 2025 — nearly equivalent to the dot-com bubble peak in 2000 (~44) — a key question arises: can the U.S. market still advance during the last two months of the year? History suggests that November and December seasonality often favors bulls, yet economic reality and valuation levels may temper this optimism.
Valuations on the Verge of Overheating
Fundamental indicators speak for themselves. A Shiller P/E around 40 signals extreme overvaluation; the historical average is around 17. The Buffett Indicator, which compares total market capitalization to GDP, exceeds 200% — an all-time high, well above levels seen before the 2000 and 2007 crises. In other words, U.S. equity prices are today largely disconnected from the size of the real economy.
Historical comparisons are striking: the market has only been this expensive on the eve of the tech crash twenty-five years ago. This makes any new bullish episode difficult to justify fundamentally. Yet history also shows that markets can remain overvalued for long periods, especially when liquidity is abundant and investors fear “missing out” on gains.
Seasonality: A Favorable Tailwind at Year-End
Statistically, November and December are the most favorable months for U.S. equities. According to Topdown Charts (1964–2024), November delivers an average return of +1%, positive in 69% of cases, while December rises +1.2% on average, gaining nearly 70% of the time.
Market Paradox: Expensive Yet Bullish?
This coexistence of extreme valuation and seasonal bullish momentum is not unprecedented. In 1999, for instance, the S&P 500 gained over 20% in the six months leading up to its historical peak, even though its CAPE exceeded 40. Investor psychology and flow dynamics often play a more significant role than fundamental reasoning in the short term.
However, such an environment reduces the margin of safety: any macroeconomic shock or earnings disappointment could trigger a sharp correction. History shows that markets can ignore excesses … until the moment they cannot.
Conclusion
The S&P 500 approaches the end of 2025 in a paradoxical situation: supported by historically favorable seasonality but in fundamental weightlessness. November and December could indeed be positive due to bullish inertia, liquidity effects, and collective psychology. Yet at these valuation levels, every additional point of gain also brings the market closer to an inflection point.
DISCLAIMER:
This content is intended for individuals who are familiar with financial markets and instruments and is for information purposes only. The presented idea (including market commentary, market data and observations) is not a work product of any research department of Swissquote or its affiliates. This material is intended to highlight market action and does not constitute investment, legal or tax advice. If you are a retail investor or lack experience in trading complex financial products, it is advisable to seek professional advice from licensed advisor before making any financial decisions.
This content is not intended to manipulate the market or encourage any specific financial behavior.
Swissquote makes no representation or warranty as to the quality, completeness, accuracy, comprehensiveness or non-infringement of such content. The views expressed are those of the consultant and are provided for educational purposes only. Any information provided relating to a product or market should not be construed as recommending an investment strategy or transaction. Past performance is not a guarantee of future results.
Swissquote and its employees and representatives shall in no event be held liable for any damages or losses arising directly or indirectly from decisions made on the basis of this content.
The use of any third-party brands or trademarks is for information only and does not imply endorsement by Swissquote, or that the trademark owner has authorised Swissquote to promote its products or services.
Swissquote is the marketing brand for the activities of Swissquote Bank Ltd (Switzerland) regulated by FINMA, Swissquote Capital Markets Limited regulated by CySEC (Cyprus), Swissquote Bank Europe SA (Luxembourg) regulated by the CSSF, Swissquote Ltd (UK) regulated by the FCA, Swissquote Financial Services (Malta) Ltd regulated by the Malta Financial Services Authority, Swissquote MEA Ltd. (UAE) regulated by the Dubai Financial Services Authority, Swissquote Pte Ltd (Singapore) regulated by the Monetary Authority of Singapore, Swissquote Asia Limited (Hong Kong) licensed by the Hong Kong Securities and Futures Commission (SFC) and Swissquote South Africa (Pty) Ltd supervised by the FSCA.
Products and services of Swissquote are only intended for those permitted to receive them under local law.
All investments carry a degree of risk. The risk of loss in trading or holding financial instruments can be substantial. The value of financial instruments, including but not limited to stocks, bonds, cryptocurrencies, and other assets, can fluctuate both upwards and downwards. There is a significant risk of financial loss when buying, selling, holding, staking, or investing in these instruments. SQBE makes no recommendations regarding any specific investment, transaction, or the use of any particular investment strategy.
CFDs are complex instruments and come with a high risk of losing money rapidly due to leverage. The vast majority of retail client accounts suffer capital losses when trading in CFDs. You should consider whether you understand how CFDs work and whether you can afford to take the high risk of losing your money.
Digital Assets are unregulated in most countries and consumer protection rules may not apply. As highly volatile speculative investments, Digital Assets are not suitable for investors without a high-risk tolerance. Make sure you understand each Digital Asset before you trade.
Cryptocurrencies are not considered legal tender in some jurisdictions and are subject to regulatory uncertainties.
The use of Internet-based systems can involve high risks, including, but not limited to, fraud, cyber-attacks, network and communication failures, as well as identity theft and phishing attacks related to crypto-assets.

Upcoming End of the Shutdown & Market LiquidityThe end of a U.S. government shutdown is often interpreted as a mere political signal. Yet, from a financial perspective, this event can mark a major turning point for global liquidity. One of the most direct mechanisms through which this occurs is the Treasury General Account (TGA) — the U.S. Treasury’s main account at the Federal Reserve (Fed).
1) The TGA: a true liquidity reservoir
The TGA functions as the federal government’s current account.
When it receives revenues (taxes, bond issuance, etc.), funds are deposited there. When it spends — salaries, contractor payments, social programs — those amounts leave the TGA and flow toward commercial banks and households.
Each dollar spent by the Treasury exits the Fed and enters the private sector, increasing bank reserves and overall financial system liquidity.
Conversely, when the Treasury issues bonds and collects money from investors, bank reserves decline since those funds are transferred into the TGA.
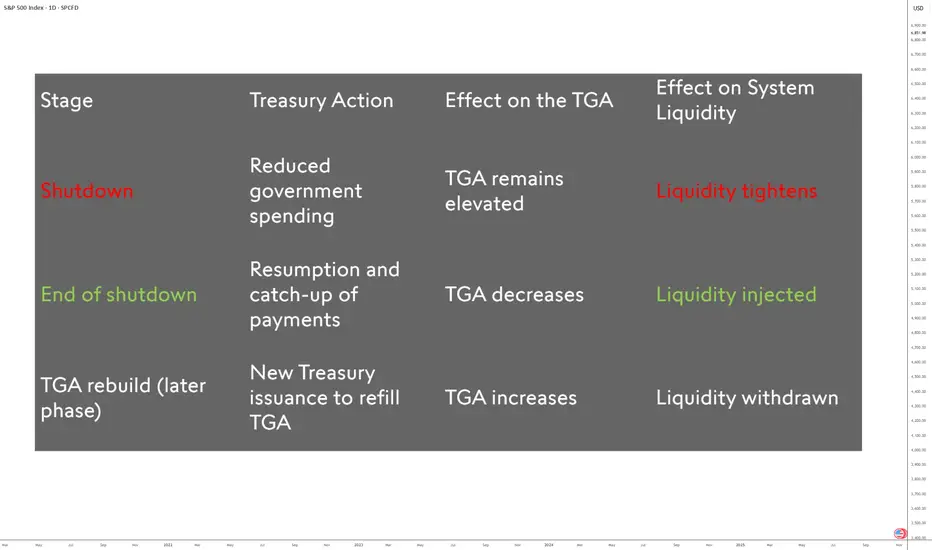
2) Shutdown: a period of silent contraction
During a shutdown, the government is largely paralyzed. Many payments are suspended or delayed, reducing cash outflows.
As a result, the TGA drains much more slowly, and available liquidity in the financial system decreases. It is worth noting that the TGA had just finished refilling in early October — exactly at the onset of the shutdown.
3) The end of the shutdown: a sharp reinjection
As soon as the shutdown ends, the U.S. Treasury must catch up on deferred spending — wages, contracts, and federal programs.
These large disbursements cause a rapid decline in the TGA, equivalent to a direct injection of liquidity into the economy.
Bank reserves increase mechanically, repo rates may ease, and risk assets — equities, high-yield bonds, crypto-assets — often experience a short-term rebound.
This liquidity surge is not sustainable: once payments are settled, the Treasury usually reissues debt to rebuild the TGA to its target level. This reverse phase then withdraws the excess liquidity from the market.
In the short term, however, the end of a shutdown acts as a positive liquidity pump, capable of influencing the trend of risk assets on financial markets.
DISCLAIMER:
This content is intended for individuals who are familiar with financial markets and instruments and is for information purposes only. The presented idea (including market commentary, market data and observations) is not a work product of any research department of Swissquote or its affiliates. This material is intended to highlight market action and does not constitute investment, legal or tax advice. If you are a retail investor or lack experience in trading complex financial products, it is advisable to seek professional advice from licensed advisor before making any financial decisions.
This content is not intended to manipulate the market or encourage any specific financial behavior.
Swissquote makes no representation or warranty as to the quality, completeness, accuracy, comprehensiveness or non-infringement of such content. The views expressed are those of the consultant and are provided for educational purposes only. Any information provided relating to a product or market should not be construed as recommending an investment strategy or transaction. Past performance is not a guarantee of future results.
Swissquote and its employees and representatives shall in no event be held liable for any damages or losses arising directly or indirectly from decisions made on the basis of this content.
The use of any third-party brands or trademarks is for information only and does not imply endorsement by Swissquote, or that the trademark owner has authorised Swissquote to promote its products or services.
Swissquote is the marketing brand for the activities of Swissquote Bank Ltd (Switzerland) regulated by FINMA, Swissquote Capital Markets Limited regulated by CySEC (Cyprus), Swissquote Bank Europe SA (Luxembourg) regulated by the CSSF, Swissquote Ltd (UK) regulated by the FCA, Swissquote Financial Services (Malta) Ltd regulated by the Malta Financial Services Authority, Swissquote MEA Ltd. (UAE) regulated by the Dubai Financial Services Authority, Swissquote Pte Ltd (Singapore) regulated by the Monetary Authority of Singapore, Swissquote Asia Limited (Hong Kong) licensed by the Hong Kong Securities and Futures Commission (SFC) and Swissquote South Africa (Pty) Ltd supervised by the FSCA.
Products and services of Swissquote are only intended for those permitted to receive them under local law.
All investments carry a degree of risk. The risk of loss in trading or holding financial instruments can be substantial. The value of financial instruments, including but not limited to stocks, bonds, cryptocurrencies, and other assets, can fluctuate both upwards and downwards. There is a significant risk of financial loss when buying, selling, holding, staking, or investing in these instruments. SQBE makes no recommendations regarding any specific investment, transaction, or the use of any particular investment strategy.
CFDs are complex instruments and come with a high risk of losing money rapidly due to leverage. The vast majority of retail client accounts suffer capital losses when trading in CFDs. You should consider whether you understand how CFDs work and whether you can afford to take the high risk of losing your money.
Digital Assets are unregulated in most countries and consumer protection rules may not apply. As highly volatile speculative investments, Digital Assets are not suitable for investors without a high-risk tolerance. Make sure you understand each Digital Asset before you trade.
Cryptocurrencies are not considered legal tender in some jurisdictions and are subject to regulatory uncertainties.
The use of Internet-based systems can involve high risks, including, but not limited to, fraud, cyber-attacks, network and communication failures, as well as identity theft and phishing attacks related to crypto-assets.
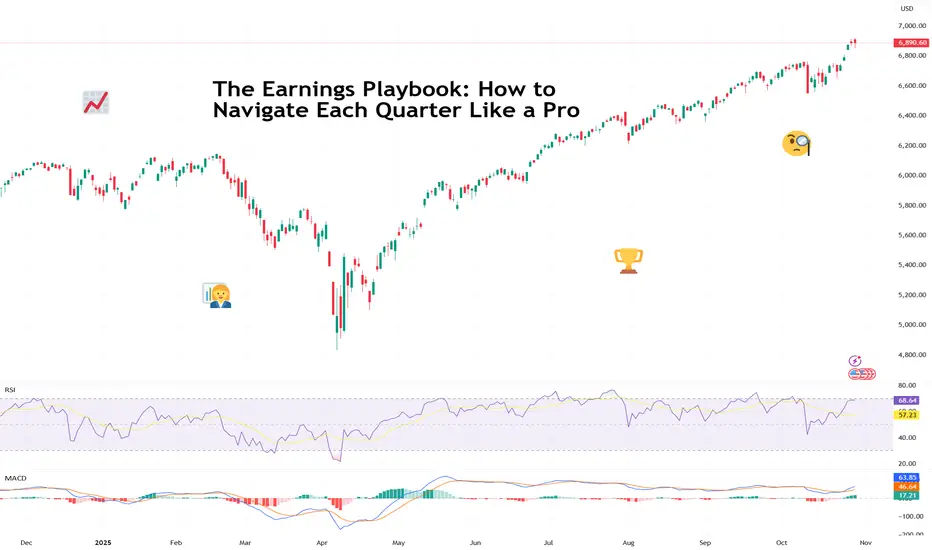
The Earnings Playbook: How to Navigate Each Quarter Like a ProTraders are in the heat of the earnings season and euphoria is sweeping every corner of the market.
The charts twitch, traders stop talking about the Fed for five minutes ( not this week, though ), and online forums turn into a parade of watch-me-trade sessions.
It’s that glorious stretch when companies pop open the books and reveal what’s really been happening behind the scenes.
For professional investors, it’s data heaven. For retail traders, it’s emotional cardio. Stocks can rise 20% on a single upbeat forecast — or plummet before your coffee cools. The trick isn’t just to survive it. It’s to navigate it like a pro.
💼 Know the Seasons (and the Mood Swings)
Earnings season comes four times a year — January, April, July, and October — and each has its own flavor.
Q1 (April): That’s the hangover quarter. Holiday sales meet new-year cost cuts. Traders recalibrate expectations and reality collides with ambition.
Q2 (July): The mid-year checkup. CEOs brag about “momentum,” analysts start sharpening their red pencils. Markets get twitchy.
Q3 (October): The credibility test. Guidance revisions and cautious tones dominate. If the year’s been good, this is where the victory laps start.
Q4 (January): The scoreboard reveal. Everyone tallies their annual wins and losses, and traders begin to bet on who carries the next year’s momentum.
Each cycle has a similar rhythm: hype, reaction, digestion, and speculation. Think of it like a four-act play.
📊 Mind the Gap
One thing to keep in mind whenever you find yourself in the earnings bonanza: the actual numbers matter less than the narrative. ( Looking at you, Oracle NYSE:ORCL )
A company can beat on revenue, miss on profit, and still rally — if the CEO sells a compelling story about the next quarter. Conversely, it can post record earnings and tank because analysts wanted even more.
The pros know to look beyond the headline EPS. They dig into guidance, margins, and segment performance. Is revenue growing because of genuine demand, or just creative accounting? Are margins improving, or did the company quietly cut R&D?
Markets don’t price what’s happened — they price what’s next. That’s especially true for growth stocks like t echnology companies .
🎯 Don’t Chase the Knee-Jerk
Every earnings season has its share of instant overreactions — the “up 10% at open, down 8% by lunch” kind of chaos. That’s when seasoned traders sit back and let volatility do the heavy lifting.
Smart money avoids buying into the frenzy or shorting into despair. Instead, they wait for the second move — when dust settles, algorithms calm down, and humans return to their desks.
🧠 Build Your Own Playbook
To trade earnings season like a pro, you need a plan. Here’s how the veterans prep:
Start early. Check the earnings calendar and mark high-impact names in your portfolio or watchlist.
Study the setup. Look at how the stock’s performed heading into earnings. A big pre-report rally can mean expectations are too high.
Focus on guidance. Earnings beats are old news — future commentary moves markets.
Use position sizing. Never bet the farm on one report. Even the best setups can go sideways.
Don’t forget the macro. Rate cuts, inflation prints, or a stray tweet from the US President can overshadow the best earnings beat.
🕹️ The Big Picture: Earnings as Market GPS
Earnings season is the market’s health check because it tells you which sectors are thriving, which are limping, and how CEOs feel about the future (watch the language: “headwinds” and “volatility” are polite ways of saying buckle up).
Taken together, earnings trends shape the broader narrative — from interest rate expectations to sector rotations. In other words, earnings season is where short-term trading meets long-term investing.
Now go and prepare for the next batch of earnings — Big Tech is on deck this week with Apple NASDAQ:AAPL and Amazon NASDAQ:AMZN reporting today.
Off to you : What’s your strategy this earnings season? Buying the hype or waiting to buy the dip? Share your thoughts in the comments!
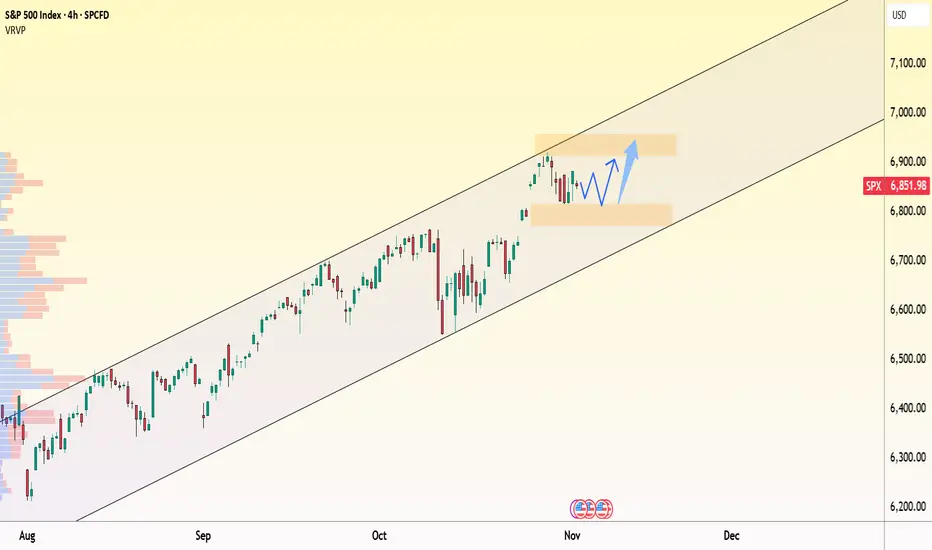
SPX:uptrend remains intact – consolidating for the next breakoutOn the 4-hour chart, the S&P 500 (SPX) continues to move firmly within its ascending channel , with the current range around 6,850–6,900 representing a healthy pause after a strong rally. The nearest support sits at 6,800, where buyers previously stepped in, while short-term resistance remains near 6,900.
From a news perspective, the rally is still being driven by tech and AI sectors , especially after the Amazon–OpenAI partnership deal , which reignited positive sentiment across the market. However, investors remain cautious ahead of upcoming U.S. ADP employment and ISM PMI data , which could influence the Fed’s next rate-cut decision.
Overall, the technical structure still supports an upward bias: SPX is consolidating between 6,800–6,900 before potentially breaking toward the 7,000-point zone , aligning with the upper boundary of the trend channel.
As long as the 6,800 support holds, the market retains room for another bullish leg in the sessions ahead, backed by renewed capital inflows into leading sectors.
This is the END(ing diagonal)The ending diagonal has formed. If you check RSI you will see a double daily and fresh WEEKLY divergence. It will crash hard next week. 6480 is the first target, but it can be just a bounce area. 1.618 level from low to top of the diagonal is at 6400 level on SPX and at 6300 level on US500 - I think we can get a flash-crash into this area next week. And if this is a reversal, it can trend down to February peak and lower according to fibs.
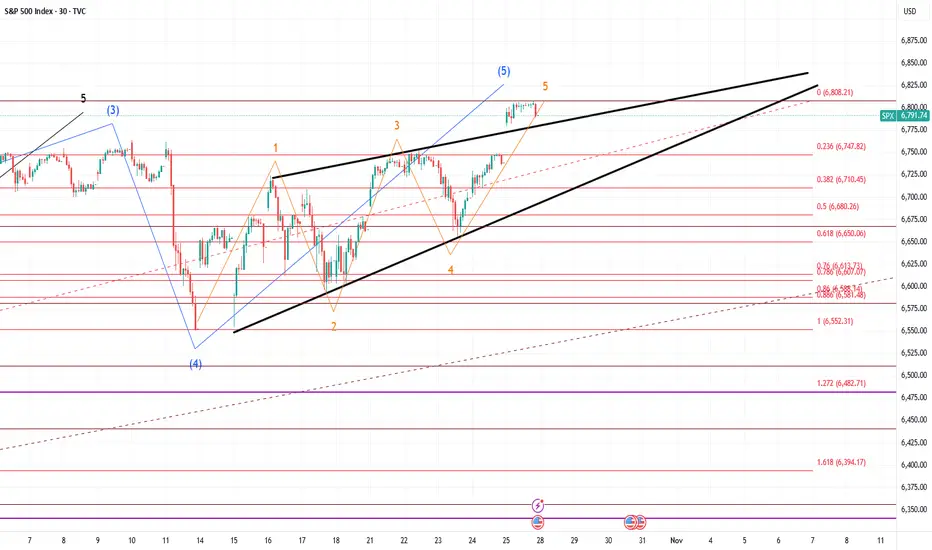

V Pattern In SPX/USDHey fellow traders and followers! Look what I found on the 8hr SPX chart.
Looks like a developing V pattern so far. What could that mean ?
Means up to me.
Here are the numbers; We need to break and hold above the Break Line of 6873.1 area to solidify a long position to Target 1) 6939.7
Target 2) 6966.7
I can't stress enough the importance of the Break Line area being a solid support in order for the trade to have a 8 out of 10 chance to make you money. This move if reached fetches a nice profit $$$ Just look at the points you can gain where I posted it on the chart.
Ok, let's see how things play out... See you at the starting gate $$$

US 500 - Has All the Good News Been Priced?Concerns about excessive stock market valuations, especially when talking about AI focused companies, isn’t something new. In fact, it has been an on-going theme over the last 6 months of the year leading to bouts of risk aversion.
This was again the case late on Monday evening, and throughout the day yesterday when the earnings of Palantir Technologies were in the spotlight. The strange thing was that the earnings from this company, released after the close on Monday, beat analysts’ expectations, however a lack of clarity on future revenue needed to justify a market capitalisation of over $600 billion was what brought the latest concerns of an AI bubble back to the attention of traders, leading to a negative sentiment shift for the wider sector and the US 500 index in general.
Now, this may or may not be the start of a wider correction and much will depend on future risk events, price action and technical trends (more on this below), however the question for traders this time around is whether the positive news flow for US indices in the short term has already been priced? After all the US 500 index only hit a new record of 6925 on October 30th, 5 days ago.
November and December are historically strong performance months for the US 500, however currently traders are faced with several issues to navigate. Only a week ago the Federal Reserve cast some doubt over whether a rate cut in December would happen or not, with policymakers maintaining this stance in their comments at various events since then. This wasn’t expected and has led to some disappointment for traders which weighed on US 500 sentiment.
Q3 earnings have generally beaten expectations but then valuations were already high to reflect this, leading to some potential fatigue. Trade tensions between the US-China have cooled, but concerns still remain about economic growth in both countries, especially in the US, where a US government shutdown has led to the delay of key data releases such as CPI, retail sales and the all-important Non-farm Payrolls update on the current health of the US labour market, a key factor influencing the decision making of the Fed on potential interest rate cuts.
This means the release of today’s US ADP Private Payrolls data at 1315 GMT and the US ISM Services PMI survey at 1500 GMT could have a bigger influence over the direction of the US 500 moving across the week.
Technical levels and trends may also become increasingly important.
Technical Update: Back to Fibonacci Retracement Support
After reaching a new all-time high of 6925 on October 30th, the US 500 index has corrected by 2.9%, easing short-term overextended upside conditions. This pullback may reflect a healthy pause within a broader uptrend, but the question now appears to be whether this marks the extent of corrective downside moves or is the beginning of a phase of further price weakness.
As the chart below shows, latest declines in the US 500 index have now returned to a potential support zone at 6750/6760, marking the 38.2% Fibonacci retracement of the October 10th to 30th rally and the current level of the Bollinger mid-average. This possible support band may limit current declines, but closing behaviour around this area could be important in determining whether buyers can regain the upper hand or if deeper corrective risks can emerge.
Traders could now be watching this 6750/6760 support closely, as closing break below might see increased downside pressure. Such moves could then mean focus shifts to 6711, even 6661, marking the deeper 50% and 61.8% Fibonacci retracement levels.
That said, while the support is currently under pressure, the 6750/6760 range still holds on a closing basis and may help limit further selling pressure, even possibly see renewed attempts at price upside. However, traders may also now be monitoring 6825, equal to half the recent price decline, as a resistance level in the sessions ahead.
If momentum is to shift back toward attempts to renew price strength, a closing break above 6825 may be required to suggest scope to retest the 6925 October 30th all-time high.
The material provided here has not been prepared accordance with legal requirements designed to promote the independence of investment research and as such is considered to be a marketing communication. Whilst it is not subject to any prohibition on dealing ahead of the dissemination of investment research, we will not seek to take any advantage before providing it to our clients.
Pepperstone doesn’t represent that the material provided here is accurate, current or complete, and therefore shouldn’t be relied upon as such. The information, whether from a third party or not, isn’t to be considered as a recommendation; or an offer to buy or sell; or the solicitation of an offer to buy or sell any security, financial product or instrument; or to participate in any particular trading strategy. It does not take into account readers’ financial situation or investment objectives. We advise any readers of this content to seek their own advice. Without the approval of Pepperstone, reproduction or redistribution of this information isn’t permitted.

S&P 500 Technical & Fundamental Outlook — Week of Nov 3–7, 2025🧭 S&P 500 Technical & Fundamental Outlook — Week of Nov 3–7, 2025
Chart View:
Price is consolidating between 6,815 support and 6,921–6,940 resistance, holding just above the major ascending trend line from October.
This area marks a critical inflection: will buyers defend the trend, or will we finally break structure?
📊 Technical Breakdown
Primary Trend: Uptrend intact while above trend line support.
Key Support Zone: 6,800 – 6,815 (buyers last defended strongly).
Major Breakdown Level: Below 6,656 opens the door to 6,550 and new lower lows.
Resistance Zone: 6,921 – 6,940 (previous swing high & supply area).
Bias: Neutral-to-bullish while above 6,815; bearish momentum accelerates under 6,656.
🟢 Bullish Path: Use the trend line as a launchpad to retest 6,921+.
🔴 Bearish Path: Break and close below 6,815 → target 6,656 then 6,550.
🗓 Macro Calendar – Key Events to Watch
Mon (Nov 3) – ISM Manufacturing PMI (48.7 vs 49.4 prior)
→ Soft manufacturing data keeps Fed-cut expectations alive.
Tue (Nov 4) – ECB President Lagarde speaks (2 appearances)
→ Watch EUR/USD volatility; global equity tone may shift if dovish.
Wed (Nov 5) – ADP Employment (+31K expected after –32K prior); ISM Services PMI (50.7 exp)
→ Jobs rebound or slowdown will steer rate-cut bets and risk appetite.
Thu (Nov 6) – Bank of England rate decision (4.00% expected hold) + Governor Bailey speech; FOMC Member Waller speaks (2:30 PM ET)
→ Cross-market rate tone could affect bond yields → equity valuations.
Fri (Nov 7) – U.S. Non-Farm Payrolls + Unemployment + UoM Sentiment (53.0 exp)
→ This is the week’s main volatility catalyst. Strong jobs = hawkish pressure; weak jobs = bullish equities.
💬 Market Sentiment & Headlines
AI Mania Continues: Amazon hit a record after a $38 B OpenAI deal via AWS, fueling tech momentum.
Earnings Strength: 80% of S&P companies beat Q3 estimates; megacap tech remains the driver.
Breadth Concerns: 300+ S&P names closed red Monday — showing the rally is narrow and fragile.
Other Corporate Moves: Kimberly-Clark to acquire Kenvue ($48.7 B), Starbucks China JV announcement.
Macro Backdrop: Investors await clarity on Fed policy path and global rate decisions amid softening manufacturing data.
🧩 Trader’s Take
This week is all about trend-line defense vs breakdown.
Stay flexible:
Above 6,815 → trend continuation bias.
Below 6,656 → prepare for deeper retracement toward 6,550.
Macro data + AI headlines are creating a push-pull market: tech buoyancy vs broader weakness.
📅 Watch the reaction during ISM & NFP — these will likely decide direction for mid-November.
#SPX #SP500 #Futures #TradingView #PriceAction #Fundamentals #TechnicalAnalysis #StockMarket #AIStocks #MacroWeek #NFP #ISM #Fed #Equities #Amazon #OpenAI #NASDAQ #SPX500

SPX500 - Biggest Weekly Loss as AI Valuations Face ScrutinySPX500 – MARKET OUTLOOK | Biggest Weekly Loss as AI Valuations Face Scrutiny 🇺🇸
The S&P 500 posted its largest weekly loss in weeks as investors questioned high AI stock valuations and shifted toward safer assets.
The index remains under bearish pressure while trading below 6,770, with momentum favoring further downside.
🔽 Below 6,770: Bearish continuation toward 6,705 → 6,670 → 6,610.
🔼 Above 6,782: Bullish correction toward 6,814 → 6,842.
Pivot Zone: 6,755–6,765
Support: 6,705 · 6,670 · 6,610
Resistance: 6,798 · 6,814 · 6,842
SPX500 remains bearish while below 6,770, but a confirmed 1H close above 6,782 could trigger a short-term recovery toward 6,814–6,842.

NQ / Future'sToday’s price action was a clear example of structural breakdown. The clues started forming about a week ago and began to solidify by Monday morning, with confirmation coming early Tuesday. It’s simple — once you understand market structure, you can avoid bad entries and emotional trades. I alerted everyone ahead of time not to go long and outlined the most likely scenario, which played out exactly as expected. You had clue's from bitcoin, you had clue's from SPX. Everybody becomes suprised when the market rips and or drops but you have the answers in front of you 24/7, literally.
Potential Range Rebalance After Bullish Exhaustion on SP500Based on Candle Range Theory , the recent large bullish range has been followed by a series of smaller bearish candles, showing reduced momentum and potential exhaustion from buyers. Price is currently retracing into the lower range of the previous expansion, indicating that liquidity may be resting below.
If price fails to reclaim the upper range of the previous bullish candle, we could see continuation to the downside as the market seeks equilibrium within or below that expansion range. However, a strong rejection from the lower boundary could confirm range preservation and set up another bullish leg.
In short : the market’s next move depends on whether this retracement turns into a liquidity grab or a deeper correction beneath the prior candle range.

Agenda 89 --- the path to spy's next major topso I been rambling about agenda 89 and spy cycles for like ages. I also more or less blew my account up not listening to my own advice and my own levels. key thing here is market follows cycles. and no I am not willing to share the prior cycles. this here is for me more than anyone else.
I am not good with numbers so I had chatgpt do the calculations for me and the rationale made sense given my basic college math level knowledge. In fact the cycles that gpt calculated appeared to follow the same cycle rules that I used to detect the historical cycles. I have only 3 historical cycles detected. in recent times. reason being that since 2008 Aladdin took over the market and things changed. there is a certain year where it all did shift but for simplicity only data after 2008 matters because after that Aladdin by blackrock the mega algorithm managed all the trillions that move the market daily. it literally trades with itself. it's too huge to fail so I will not fight it. the cycles have also been shrinking in expansion per say. the next top is likley the last or second to last before some major black swans start happening. At least that's what aladdin has priced in. he knows more about you than yourself and
other notes is that the tops follow wycoff style, the expanded and got more volatile as they progressed and I plan to follow the same pattern in my projections. my projections are half lazy in terms of the tops/bottoms. it can really follow any wycoff. but of note, when all was noted and combined chatgpt described it as a wycoff schematic #1. even though when I typed the pattern that i saw in i labeled it as musical notes. I did not paint very well on chart because things in real life do not follow the textbook 1-1, point is, whipsaw and that's your range there more or less. I am not sure how to past an image here so just google it.
the rules and this is for me to not blow my account up anymore:
1- no timing the market, it dipped? good it can dip lower before tuning up. so expect the trades to be long. were looking at 13 dips before the top in febuary.
2- the numbers can be off slightly. I'm no picasso, can;t time or paint the market. levels evolve and change with time. the range wont change though.
3- the true top is likley a tuesday or a wednesday since historically it was those days so extra bias for them
4- no greed
5- yes this will chop until next year mid febuary - do not blow up. RANGE BOUND.
I'm expecting possibilities of up to 720-730 for the top on spy since that would be two full cycles in geometry which would make sense assuming the prior 3 were 90 degrees each. hence a strong belief of mine that this may be the last market cycle aladdin is pricing in before doomsday events. Aladdin probably knows when WW3 will start before the guys launching the nukes know it will start and has been pricing it in since it took over the markets. that thing is a monster beyond comprehension.

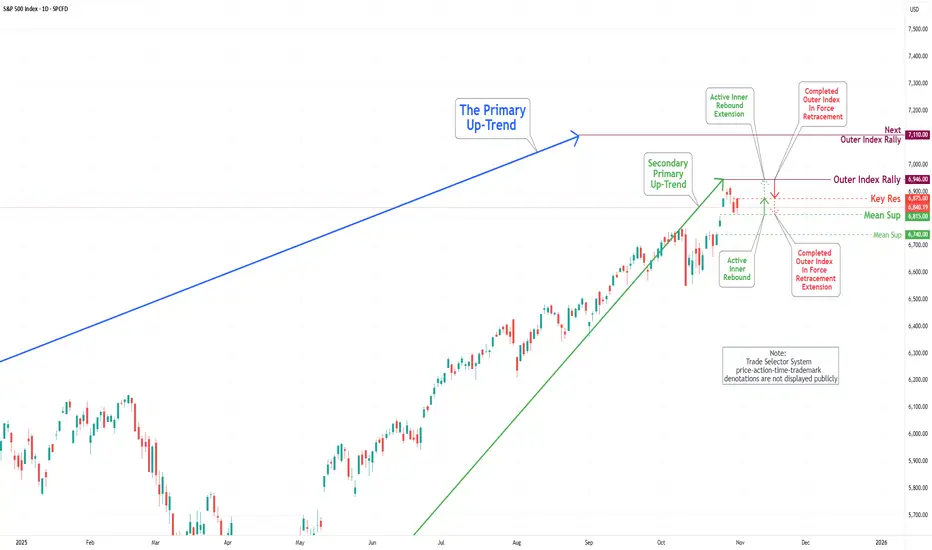
S&P 500 Daily Chart Analysis For Week of Oct 31, 2025Technical Analysis and Outlook:
During the recent trading session, the S&P 500 Index continued its wild ride, highlighting the importance of our key target, which stands as an Outer Index Rally at 6946. Fluctuations between the Mean Support at 6815 and the Key Resistance at 6875 serve as a crucial threshold for market participants. This positioning suggests the potential for further upward momentum, as the prevailing trend indicates a well-structured Active Inner Rebound extension toward the target stated above.
Nevertheless, it is essential to acknowledge the possibility of a sustained and gradual pullback within the current Active Inner Rebound zone. Such a pullback may retest the Mean Support at 6815 and could decline further to the Mean Support at 6740 before ultimately resuming an upward trajectory.
S&P to inflect at the Fib extension about now? Will the SP500 inflect at the fib extension of 1.618 of the prior dip down?
This is an important price level to watch to see if the index is bullish or bearish
My view is that its going to be a bearish outcome, however the market is being a bit naughty at the moment and it may push you over this price level to take out liquidity first before heading lower.
There are very few bears left out there - will they come out of hibernation right about now?

I'm just marking support and resistance day 3 learning trading Just started, don't wait to really get my first 100 dollars. Just excited to really learn and start trading.

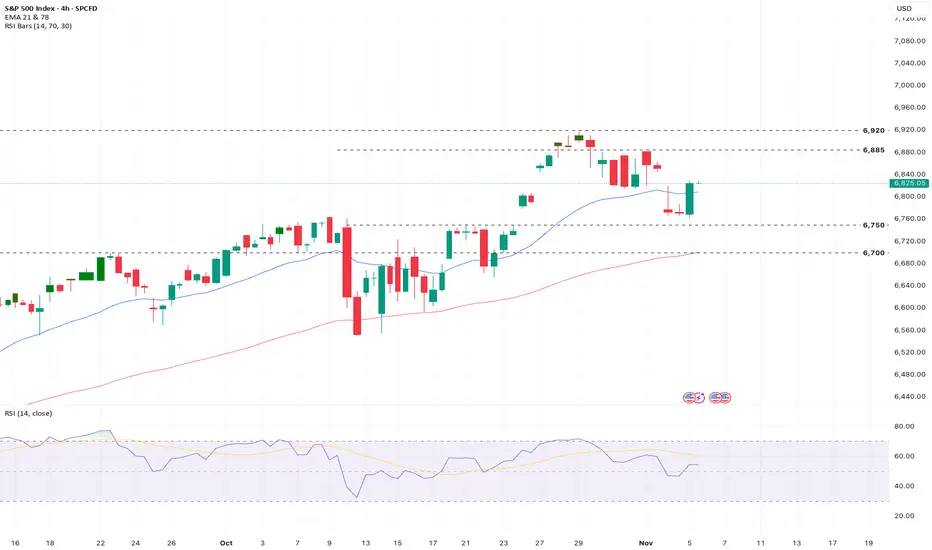
US500 maintains inherently bullish structureFundamental Analysis
US500 maintains an inherently bullish structure, trading above both EMAs. Q3 earnings were strong, with 83% of companies beating expectations and delivering 13.8% blended EPS growth, largely thanks to megacap tech/AI. However, the forward P/E ratio is high at 23.1x (above the 5-year average of 19.9x), signaling elevated valuations. The recent profit taking in high growth names like AMD and Nvidia due to margin concerns and macro headwinds (high rates/inflation) exposes this valuation sensitivity.
Technical Analysis
The index is currently pulling back from all time highs near 6,900, consolidating in a short term support zone of 6,750. Momentum is neutralizing with RSI approx 51.6, indicating a pause rather than a reversal. Key technical battleground: Resistance at 6,885 and 6,920 versus support at 6,750 and the EMA at 6,700. Consolidation is the most probable short term path.
Sentiment Analysis
Sentiment is cautious to slightly negative. The sharp correction in AI leaders (AMD, NVDA) has fueled "AI bubble" fears, overriding fundamentally strong earnings reports. There is a clear, broad sector rotation occurring as investors de-risk and take year end profits from high growth tech toward defensive/value plays. The market is currently driven by nervousness about sustaining premium valuations against persistent macro uncertainty.
Outlook
The near term outlook is moderately cautious. While the long term bullish trend remains supported by healthy corporate earnings, the market faces an inflection point driven by overvaluation concerns in the tech sector. Further short term volatility is expected as the market digests earnings nuances (like margin guidance) and awaits clearer signals on US monetary policy and inflation. A decisive break of the 6,750 support or 6,885 resistance will likely define the next directional move.
Analysis is by Terence Hove, Senior Financial Markets Strategist at Exness
More upside for SPX500USDHi traders,
Last week SPX500USD went up and made a correction down.
So next week we could see more upside for this pair.
Let's see what the market does and react.
Trade idea: Wait for the correction down to finish. After that look for an impulse wave with a correction down on a lower timeframe. After a change in orderflow to bullish you could trade longs.
This shared post is only my point of view on what could be the next move in this pair based on my technical analysis.
But I react and trade on what I see in the chart, not what I've predicted or expect.
Don't be emotional, just trade your plan!
Eduwave

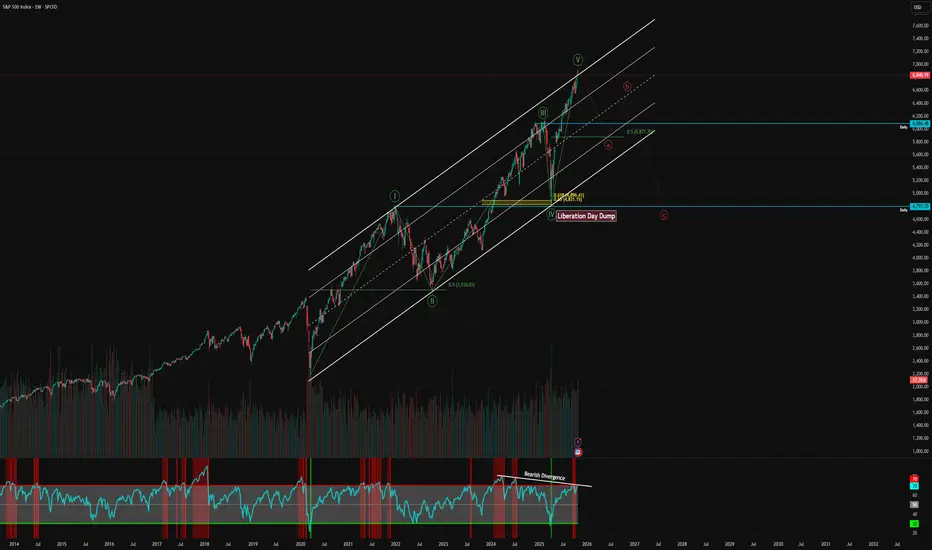
Topping Signal?To me this looks like Wave 5 of the Elliott Wave supercycle in the stock market. We had a monster rally since the liberation day dump, now we are coming up against some strong resistance.
Should we be concerned? So far I have taken a lot of chips of the table. I am still very much long, we don't fight the tape, but if you haven't already started booking profits; have a good hard think about how much higher we could go from here.
The government shutdown will start to filter through the earnings reports next earnings season, especially if it persists over a month. Consumer stocks are showing weakness, whilst the AI trade continue to go vertical, but it will not go on forever - something will eventually give.