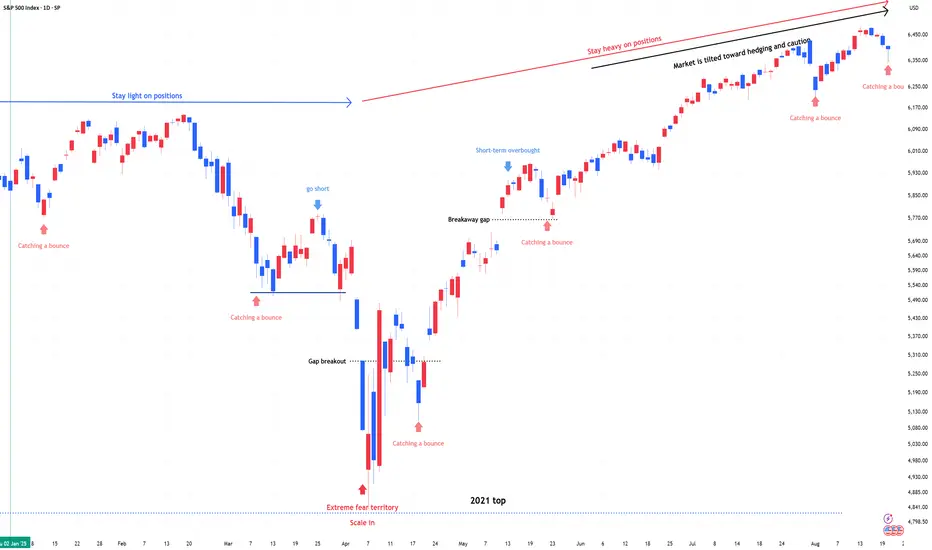
Much support below for the SP500 tomorrow, see the Buy/Sell zone
Grn/Yellow/Red for buy/hold/sell zones
SPX trade ideas

SPX & NDX , Stay heavy on positions.SPX & NDX , Stay heavy on positions. (2x leverage)
Same view as before. No change.
A signal for catching a bounce has emerged.
The bounce signal reflects a swing-to-intraday view and is not tied to the broader trend.
** This analysis is based solely on the quantification of crowd psychology.
It does not incorporate price action, trading volume, or macroeconomic indicators.
S&P REBOUND USING DATA POINTS FROM 10 YEARS BACKTHE MARKETS SHOULD REBOUND END SEPT OR EARLY OCTOBER ACCORDING TO HISTORICAL DATA.
ChatGPT helped analyze this chart that I made. I went back 10 years and analyzed how long pullbacks are after a market rally. I removed some of the major outliers like Covid and 2022 rate hikes to 5.25%. Using our sample test cases that somewhat align with our current market conditions this is what ChatGPT helped me with......
Here’s what your boxes say, numerically (ignoring the crisis outliers):
Durations you marked: 31d, 57d, 61d, 63d, 91d, 91d → avg ~66 days, median ~62 days (about 2 months).
Drawdowns you marked: ~6.0%, 9.9%, 10.1%, 11.4%, 15.9%, 17.7%, 18.3% → median ~11.4%, mean ~12.8%.
Most of the time, the “routine” pullback sits ~8–12%; the 15–18% drops do happen, but usually finish quickly (2 monthly bars).
What that implies for this pullback
Using the current level shown on your chart (~6,349):
Typical reset (most common):
–8% to –12% → ~5,84k–5,59k.
That corridor overlaps your MA-ribbon cluster (~5,77k → 5,57k → 5,48k → 5,39k → 5,30k), which is where past pullbacks often end in bull trends.
Deeper but still “normal”:
–15% to –18% → ~5,40k–5,21k, i.e., probing the lower ribbon (~5.39k–5.30k) without breaking the longer-term uptrend.
Time expectation: Your history points to ~2 months on average (range 1–3 months). If this pullback is already one monthly bar in, the base-case is another 1–2 bars of chop/weakness before the trend attempts higher—unless buyers reclaim highs sooner.
Signals to watch on your chart
Monthly closes vs. the ribbon
Healthy: wicks into 5.7k–5.6k that close back above the upper/mid ribbon.
Caution: Two monthly closes < ~5.30k (lower ribbon) plus a flattening ribbon.
RSI(14) monthly (yours is ~70 and curling): a normal reset is 55–60 while price holds the ribbon. Sustained <50 shifts risk to a longer correction.
MACD monthly: a gentle histogram fade with price respecting the ribbon = routine pullback. A bearish cross with closes below the lower ribbon flags the 15–18% scenario or worse.
Quick map (actionable zones)
Shallow buy-the-dip: 5,75x–5,65x
Deeper, still-bull: 5,45x–5,32x
Trend-change risk: persistent closes <~5,30x
Bottom line: with the crisis moves removed, your own data argues the current pullback most likely lasts ~2 months total and bottoms ~8–12% off highs, near the upper/mid MA ribbon. Only if monthly candles start living below ~5.30k (and RSI/MACD roll hard) do the 15–18%/multi-month outcomes become the base case.

Upside move at EndThis upside ongoing move likely to end near 6500,
on touch it may decline to break Black trendline.
As per #ElliottWave internal 2-4 connected trendline
will break and it will confirm completion of internal wave5.
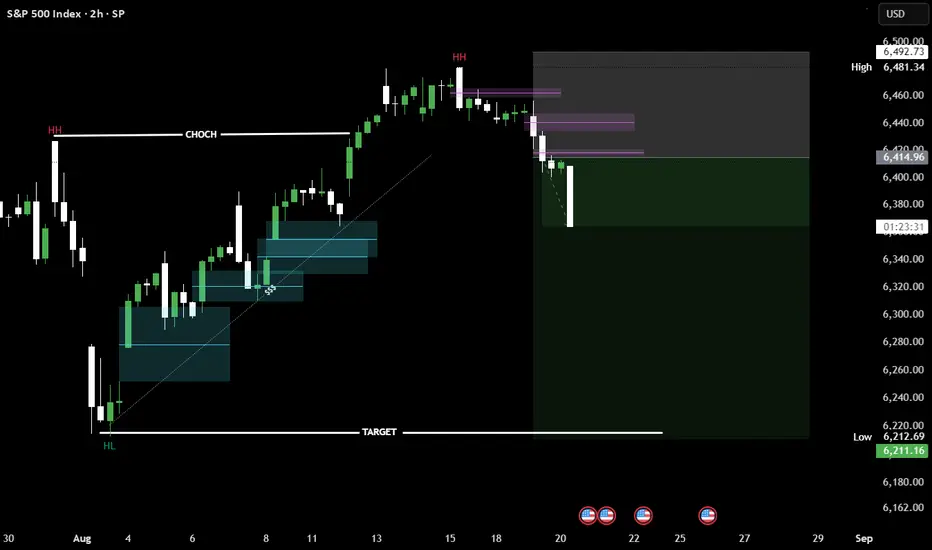
SP500- liquidity hunt in playPrice formed a Change of Character (CHOCH) after printing equal highs, signaling weakness.
Supply zones got respected, confirming bearish order flow.
Now targeting liquidity at the prior Higher Low (HL) around 6210.
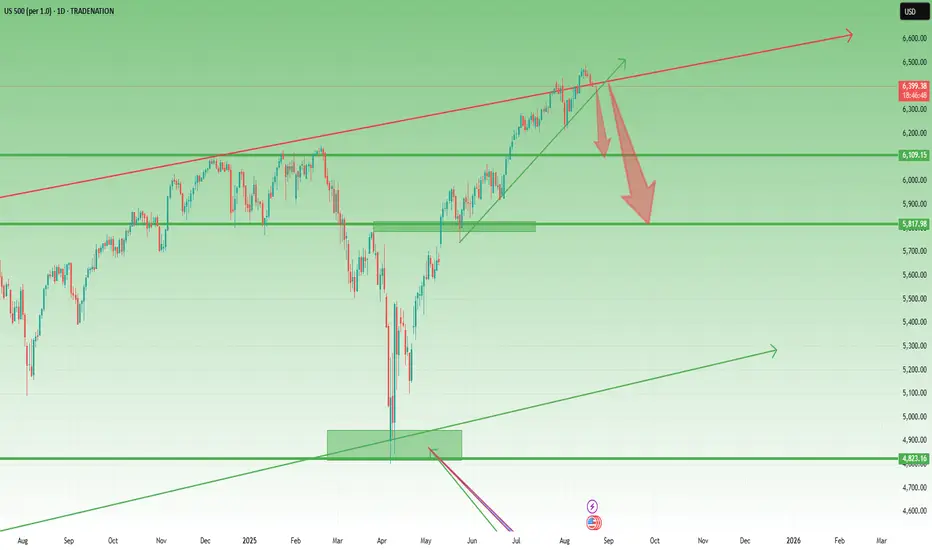
S&P 500 ,,, POSSIBLE DEEEEEP CORRECTIONTo be cautious, I exited my position completely yesterday. If the price moves back above the trend line, it will confirm the previous drop was a pullback to the broken price level. Otherwise, it's likely the start of a deeper correction, and I will remain on the sidelines until it is over.

S&P 500 20.08.2025(SPX) — Daily Chart Analysis
Market Overview
The index failed to sustain momentum above the 6490 monthly resistance and has started a corrective pullback. Price action shows rejection at the upper boundary, suggesting a short-term bearish phase within the broader uptrend.
Technical Signals & Formations
Strong rejection from the 6490 MN1 resistance.
Bearish candle formation indicates a deeper correction.
EMA 144 (6023) remains below, acting as dynamic support.
Possible corrective wave toward the 6215–6150 zone.
Key Levels
Resistance: 6490 (MN1), 6420 (local high)
Support: 6215 (H4), 6150 (monthly pivot), 6023 (EMA 144)
Scenario
Primary: Correction continues toward 6215–6150, where buyers may step in.
Alternative: A break above 6420 would invalidate the correction and open a retest of 6490.

S&P 500 ETF & Index– Technicals Hint at a Possible Correction📉📊 S&P 500 ETF & Index at Resistance – Technicals Hint at a Possible Correction 🔍⚠️
Everything here is pure technicals— but sometimes, the market whispers loud and clear if you know how to listen. 🧠📐
The VOO ETF, which tracks the S&P 500 , has now reached the upper boundary of a long-term ascending channel, once again brushing against resistance near 590.85. This zone has consistently led to major pullbacks in the past.
On the right panel, the US500 Index mirrors this move—pushing toward all-time highs, right as broader sentiment turns euphoric. Technically, both charts are overextended and pressing into key zones.
👀 Potential Path:
🔻 Rejection from current zone ➝ Down toward 526.17, then 465.72 (green support channel)
🔁 Possible bounce after correction — trend still intact long term
And while we’re keeping it technical, it’s worth noting that the Buffett Indicator (Stocks-to-GDP) i s currently screaming “overvaluation.” This doesn't predict timing—but it adds macro context to an already overheated chart setup.
The lesson? Price respects structure. Whether or not the fundamentals are in agreement, the charts are warning that now may not be the time to chase.
History doesn’t repeat, but it often rhymes. Stay sharp, stay technical. 🎯
One Love,
The FX PROFESSOR 💙
ps. the beauty of these levels? Tight Stop loss- excellent R/R
Disclosure: I am happy to be part of the Trade Nation's Influencer program and receive a monthly fee for using their TradingView charts in my analysis. Awesome broker, where the trader really comes first! 🌟🤝📈

US500 Intraday Buy: Dips Attracting Buyers Near Key SupportUS500 – Buy Limit
Entry: 6396
Target: 6516
Stop Loss: 6356
Type: Intraday
Trade Idea:
Levels close to the 78.6% pullback level of 6395 found buyers, suggesting demand remains intact.
Setbacks should be limited to yesterday’s low, with overnight losses contained.
The primary trend remains bullish, and the 20 1-day EMA at 6384 underpins price action.
Preferred trade is to buy into dips for a potential rebound.
Resistance Levels: 6421 / 6467 / 6490
Support Levels: 6393 / 6369 / 6348
Next Volatile Events:
20/08/2025 19:00 — FOMC Minutes (US)
21/08/2025 01:00 — Jackson Hole Symposium (US)
Disclosure: I am part of Trade Nation's Influencer program and receive a monthly fee for using their TradingView charts in my analysis.

8/20/25 SPX Trade Plan📊 Quantum's Trade Plan 📊
TVC:VIX - TVC:DXY - #10Y = Caution📈
⚪️ 6400 Pivot
🟢 If 6400 fails then short - 6390--6388--6375--6364
🔴If 6400 hold then long - 6409--6426--6440--6445
🔵 -Dex with sell walls at 6400 & 6450
🟠 Vanna neutral - 6405-6410 vanna flip
⚫️ Volume + Flow must support thesis


US500: Bulls Pause as Pullback Risks GrowUS500 has been riding an impressive uptrend, with buyers pushing the index to fresh highs above 6,440, but the recent stalling near resistance suggests that momentum may be losing steam. With growth concerns, central bank caution, and a round of key economic data on deck, the risk of a corrective pullback is building. This setup highlights the importance of watching whether support levels hold or if sellers gain the upper hand.
Current Bias
Bearish (Short Term) – While the broader trend remains bullish, near-term technicals and macro uncertainty point toward a corrective pullback.
Key Fundamental Drivers
US Earnings Season: Mixed corporate earnings, with strength in tech offset by weakness in cyclicals.
Fed Policy: Markets are still weighing timing of potential rate cuts, but sticky inflation data and cautious Fed commentary keep rates elevated.
Bond Yields: US yields remain relatively high, pressuring equities when safe-haven flows emerge.
Macro Context
Interest Rates: The Fed is in a “wait-and-see” mode, balancing sticky services inflation against slowing growth. Rate cuts are still priced for later this year, but not aggressively.
Economic Growth: US economy shows signs of slowing, with softer retail sales and housing data, though labor markets remain resilient.
Commodities/Flows: Energy costs are stabilizing, but higher oil prices in recent weeks could add inflationary pressure.
Geopolitics: Trade tensions, tariffs, and Middle East instability add layers of risk, supporting defensive positioning.
Primary Risk to the Trend
A surprise dovish shift from the Fed or stronger-than-expected US earnings could quickly reignite bullish momentum and push US500 higher, invalidating the pullback scenario.
Most Critical Upcoming News/Event
FOMC Minutes & Powell Speeches – Markets will look for clarity on rate cut timing.
US CPI & PPI Data – Any upside surprises could weigh heavily on equities.
Leader/Lagger Dynamics
The US500 is a leader, often dictating global equity sentiment. Movements in US500 ripple into NASDAQ, DAX, FTSE, and risk-sensitive FX pairs such as AUD/JPY. Its role as a global risk benchmark makes it highly influential.
Key Levels
Support Levels: 6,370, 6,231, 5,920
Resistance Levels: 6,447 (recent high), 6,500 psychological barrier
Stop Loss (SL): 6,480 (above recent highs)
Take Profit (TP):
TP1: 6,370
TP2: 6,231
TP3: 5,920
Summary: Bias and Watchpoints
US500 bias is shifting to neutral-to-bearish, with the index showing signs of fatigue at highs around 6,440–6,450. A pullback toward 6,370 → 6,231 is possible, with 5,920 as an extended target if risk sentiment deteriorates. A protective stop at 6,480 is key in case bulls regain momentum. Traders should keep a close eye on Fed communication and US inflation data, as these remain the most powerful catalysts for near-term direction. With the US500 acting as a leader for global equities, its moves will likely shape broader market sentiment across stocks, indices, and even risk-sensitive currencies.

Portfolio Update Aug 20 2025I sold all ORCL stocks yesterday as I see the market topped. Big tech companies are retracing now, so this might be the peak for now.
We have Jackson Hole symposium in the upcoming days which may lead to policy changes. We also waiting to see tariff effect in the 3rd quarter earnings. Plus Ukraine war updates.
Disclaimer: This content is NOT a financial advise, it is for educational purpose only.

S&P500 H4 | Bearish dropBased on the H4 chart analysis, we could see the price rise to the sell entry at 6,428.75, which is a pullback resstance and could drop from this level to the take profit.
Stop loss is at 6,488.82, whichis a swing high reistance.
Take profit is at 6,350.26, whichis an overlap support that lines up witht he 50% Fibonacci retracment.
High Risk Investment Warning
Trading Forex/CFDs on margin carries a high level of risk and may not be suitable for all investors. Leverage can work against you.
Stratos Markets Limited (tradu.com ):
CFDs are complex instruments and come with a high risk of losing money rapidly due to leverage. 65% of retail investor accounts lose money when trading CFDs with this provider. You should consider whether you understand how CFDs work and whether you can afford to take the high risk of losing your money.
Stratos Europe Ltd (tradu.com ):
CFDs are complex instruments and come with a high risk of losing money rapidly due to leverage. 66% of retail investor accounts lose money when trading CFDs with this provider. You should consider whether you understand how CFDs work and whether you can afford to take the high risk of losing your money.
Stratos Global LLC (tradu.com ):
Losses can exceed deposits.
Please be advised that the information presented on TradingView is provided to Tradu (‘Company’, ‘we’) by a third-party provider (‘TFA Global Pte Ltd’). Please be reminded that you are solely responsible for the trading decisions on your account. There is a very high degree of risk involved in trading. Any information and/or content is intended entirely for research, educational and informational purposes only and does not constitute investment or consultation advice or investment strategy. The information is not tailored to the investment needs of any specific person and therefore does not involve a consideration of any of the investment objectives, financial situation or needs of any viewer that may receive it. Kindly also note that past performance is not a reliable indicator of future results. Actual results may differ materially from those anticipated in forward-looking or past performance statements. We assume no liability as to the accuracy or completeness of any of the information and/or content provided herein and the Company cannot be held responsible for any omission, mistake nor for any loss or damage including without limitation to any loss of profit which may arise from reliance on any information supplied by TFA Global Pte Ltd.
The speaker(s) is neither an employee, agent nor representative of Tradu and is therefore acting independently. The opinions given are their own, constitute general market commentary, and do not constitute the opinion or advice of Tradu or any form of personal or investment advice. Tradu neither endorses nor guarantees offerings of third-party speakers, nor is Tradu responsible for the content, veracity or opinions of third-party speakers, presenters or participants.

S&P500: Losing Momentum !I see the rally comes to end, the recent upside move has no momentum. The stocks need a new catalysts to continue, but I do not think this to happen. I suggest that US500 to go down in the next 30 days or so.
Disclaimer: This content is NOT a financial advise, it is for educational purpose only.

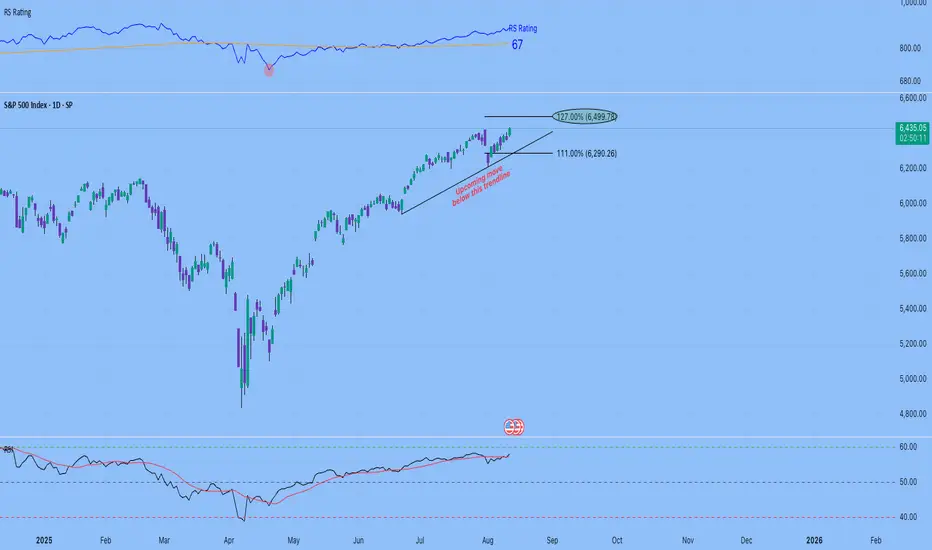
S&P 500 Shows Early Signs of Momentum Loss Ahead of Jackson HoleThe S&P 500 has begun to show signs of momentum loss ahead of the Jackson Hole meeting. The number of member stocks trading above their 200-day moving average has not increased, even as the index made new highs. RSI is showing a negative divergence, and the index has slipped below its short-term yellow trendline.
In addition, crypto markets sold off early Monday, and the VIX opened the week with a gap higher, moving above its short-term downtrend. These are still only early signals and not yet concrete confirmation, but traders should be cautious of potential profit-taking ahead of Jackson Hole, where Powell may push back against expectations for rapid rate cuts.

US500 – Has the Correction Started?1. What Happened Yesterday
Yesterday, US500 dropped around 1%, signaling that a meaningful correction could be starting. Unlike Nasdaq, which already broke under two key support levels, here the price is still above the trendline that began back at the end of May, when the index broke through the important 5800 resistance.
The rise since April has been huge and not fundamentally justified, making the index vulnerable to a reversal towards more sustainable levels.
________________________________________
2. Key Question
Has the correction really started, or will we first see another spike before the drop?
________________________________________
3. Why More Downside is Likely
• Trendline vulnerability: A break under 6380 could trigger acceleration to the downside.
• First bear target: 6100, the old ATH.
• Bigger picture: A move under 6000 remains likely, with 5800 as a longer-term destination.
• Risk/reward setup: Any spike higher should be seen as a selling opportunity. Around 6500 would be ideal to short.
________________________________________
4. Trading Plan
• Sell spikes, especially near 6500).
• Watch 6380 – break here could open the way towards 6100.
• Medium/long term bias: Bearish, with more room down than up.
________________________________________
5. Final Note 🚀
The market must confirm, but the strategy is clear: don’t chase the bounce, sell the strength and ride the correction.
Disclosure: I am part of TradeNation's Influencer program and receive a monthly fee for using their TradingView charts in my analyses and educational articles.
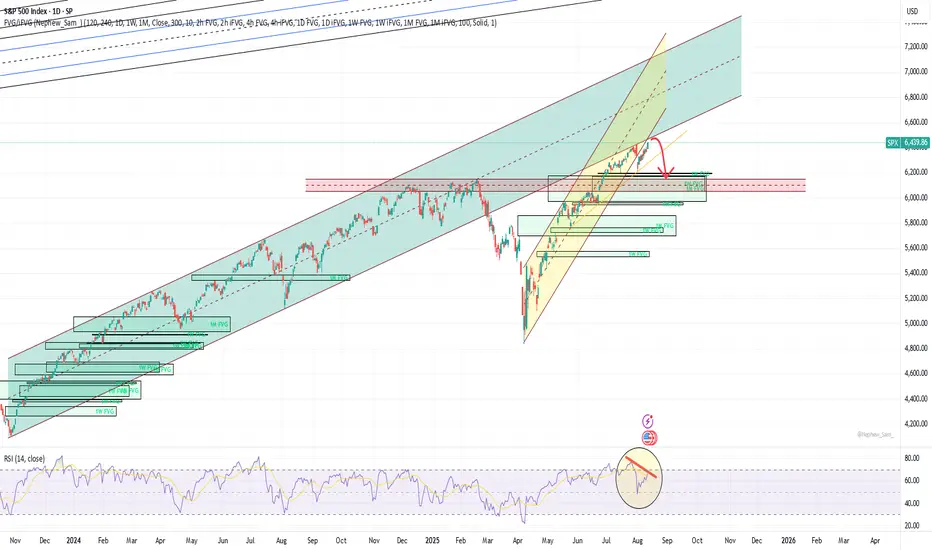
Resistance and divergenceThe price is at the bottom of the old broken channel right now that serves as a resistance. Solid 1d divergence on RSI.
6180 is the minimum target - 1W and 1M FVG start there. Retest of the February ATH at 6150 is probable. A spike to 6100 and below is also possible.
$SPX500 Short Trade - Target 6414 - Easy MoneyFOREXCOM:SPX500 Short Trade
Entry: 6450-6460
TP: 6414
This is good trade.
Don't overload your risk like Greedy gambler!!!
Be Disciplined Trader, what what you can afford.
Use proper risk management.
Disclaimer: Trading is risky, only idea, not advice.

New Bear Market? Heavy Tech SelloffToday the markets were shattered by weakness in mega cap tech.
All major leading companies in the QQQ were severely down.
We saw the majority of the S&P 500 sectors green with health care leading the charge.
Despite all indices closing negative this was not a full fledge market sell.
Commodities were hit across the board. Gold, Nat gas, Oil, Uranium, Silver were all down.
It seems the market is de risking into J Powell Jackson Hole meeting on Thursday / Friday.
Today we closed out NASDAQ:MSFT NASDAQ:PLTR short & trimmed AMEX:MSOS puts for over 105%
We were very active on the option and swing trading side of the market.

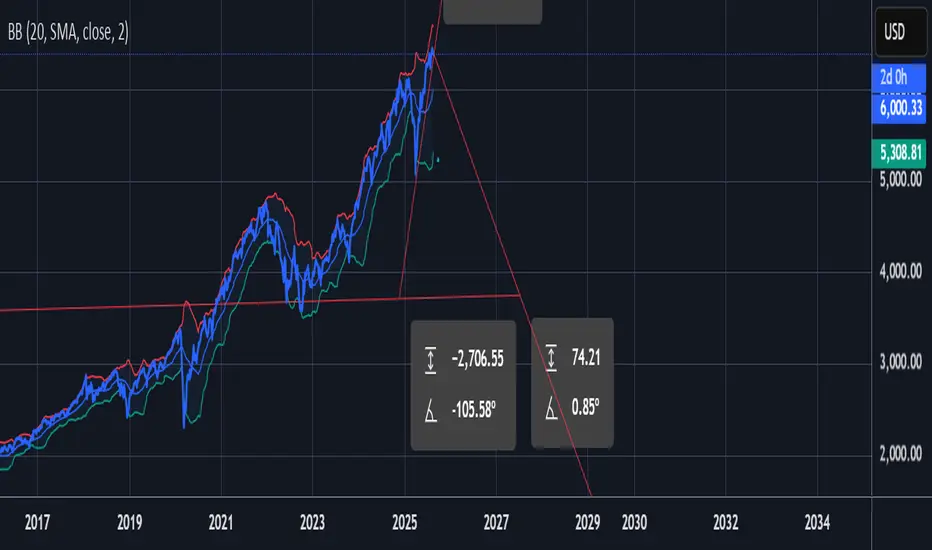
I think this bubble will popWelcome fellow traders and investors.
As you might have noticed… a lot of markets are topping at this moment. I think there will be a time that this market corrects to its true value. At this moment i’m looking at a 25% dip… If might sound horrible but we we’re at this point in april.
Im watching the S&P 500 for levels around $4800 and $4500.
I hope you can get the conversations started with my opinion ;-) Good luck and enjoy the ride down… or up

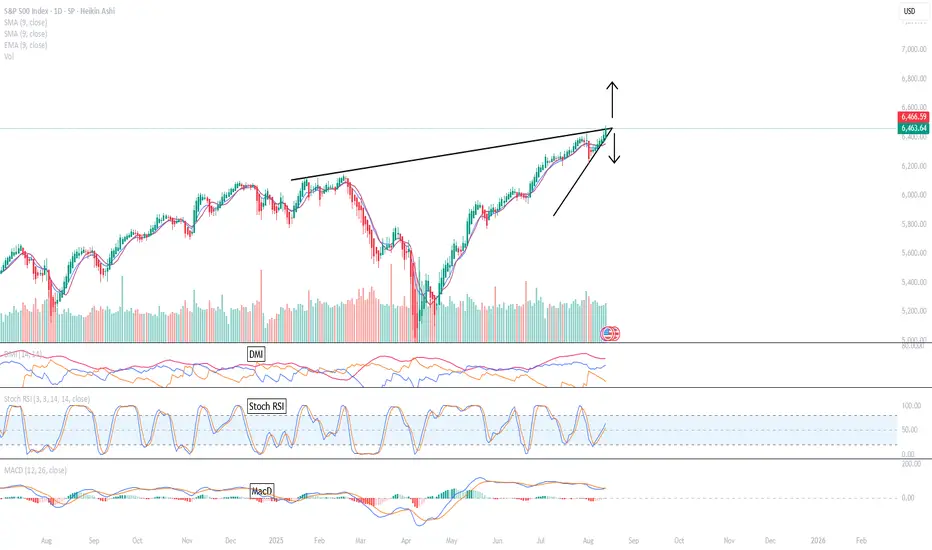
The S&P could be going up OR down ... (I changed my mind)
but the daily indicators are looking more to an upward move now.
I drew a previous chart anticipating that the market would be bearish. (Please look at my previous chart for more details) But looking at the daily indicators, they look too bullish for me. As well, the S&P technically traded out of the triangle today which indicates a bullish trend. And if you look at the DIA or the NDQ they look bullish too. And these 3 indices typically trade in the similar direction.
(This is going to sound a lot like my previous chart.)
Tomorrow, the jobless claims are being reported, which should drive the market either up or down. But looking at the daily chart, it will probably go up, but I am not ruling out anything right now.
I am a technical trader but I believe the fundamentals drive the market.
I am using the Heikin Ashi candlesticks.
1) They show more of a directional movement within candlesticks.
2) They tend to filter out the market noise so you can see the market direction better.
3) It reduces false signals, allowing you to stay in the trade longer.
4) And, it also gives you a smoother appearance making it easier to see trends and reversals.
But I often switch between regular candlesticks as those are the candlesticks I started trading with and I still do get a little bit of information from the regular candlesticks.
I think we had an ascending triangle forming on the S&P with the tip forming on Friday, August 15th.
Usually, the chart can exit 2/3 before the tip. So it can start exiting the triangle before now and August 15, 2025 usually with some fundamental trigger. I suspect the trigger would be the jobless claims report on Thursday, August 14, 2025. It seems that the S&P may have exited the triangle upward today.
I was thinking the market would move lower tomorrow based on the technicals, but the daily indicators are looking too bullish right now. Therefore, I am having more of a conservative approach and I will be prepared for both directions tomorrow.
I am undecided on the targets or stops as of yet in either direction.
But if you look at my previous targets and stops they usually follow a pattern.
My trading plan only entails me to use 10% of my total account. If I am wrong on this trade, I will not implode my account.
Trade at your own risk, make sure you have stops in place, use a trading plan and only use 10% or less of your account for trading to limit your risk.
Any comments and questions are welcome.... especially this time, since I changed my mind. LOL!
Happy Trading!