S&P500, Waiting for breakoutAs is clear from the chart, the chart has reached its All-Time High (ATH), and a powerful fundamental stimulus is needed to break out of this level.
Traders have many strategies for their trades. In my opinion, having a fixed trading methodology and obeying the rules of that strategy are more important than anything else in trading. I do not ask others to copy my ideas; instead, I encourage others to analyze them using their own methods.
Based on my strategy, I should close my positions below resistance levels, especially at the ATH. Then, after a confirmed breakout or a sure pullback, I will enter new positions.
Therefore, I closed all my positions yesterday and am currently waiting for a small correction or a clean breakout to re-enter.
Do not forget: disciplined adherence to a sound strategy is the ultimate guarantee of success.
S&P 500 Index
No trades
Trade ideas

SPX500 | Bulls Push Higher but Key Reversal Zone NearsSPX500 – Technical Overview
The broad market index is approaching another record high, supported by a surprisingly market-friendly message from the Federal Reserve.
Powell’s acknowledgment of “significant downside risks” in the labor market immediately signaled to traders that additional rate cuts remain possible.
Although the rate cut itself was expected, the tone was less hawkish than feared, giving bulls confidence heading into year-end.
The 9–3 split vote also revealed internal disagreement within the Fed—two members preferred no cut, while one favored an aggressive 50 bps reduction—adding uncertainty to future policy direction.
Technical Analysis
SPX500 currently shows bullish momentum, with price expected to move toward 6873 and 6888.
However, this zone is likely to act as a reversal area, and a bearish reaction could follow from these resistance levels.
As long as price remains below 6888, bearish pressure can re-emerge.
If the market stays below 6852, downside continuation remains favored toward 6815.
Upside continuation only strengthens if the market breaks and holds above 6888, targeting the 6918 region.
Pivot Line: 6852
Resistance: 6873 · 6888 · 6918
Support: 6830 · 6815 · 6797

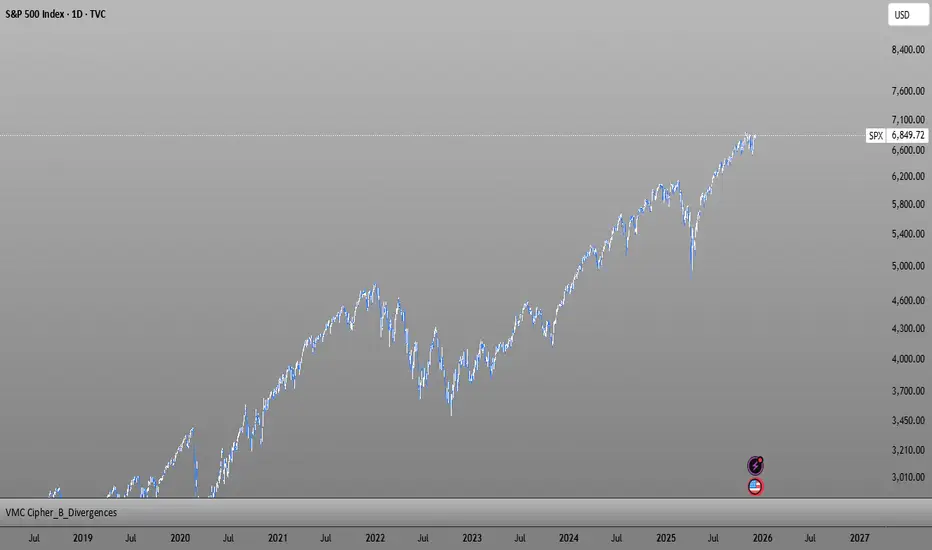
The Wall of Worry That Climbed 70% This chart should be framed and hung in every investor’s office.
From 2021 → late 2025 the S&P 500 went from ~4,000 → 6,886 (+70%+), while the entire way up we were bombarded with:
“SELL” – Michael Burry
“Worst crash since 1929” – John Hussman
“86% drop coming” – Harry Dent
“Biggest crash in history has started” – Robert Kiyosaki
“Third most expensive market ever, recession imminent” – David Rosenberg
…and literally dozens more “100% certain” doomsday calls
Every single red bubble on this chart = a famous expert screaming that the sky was falling.
And every time the market just… kept climbing.
Here's what's important to understand: "experts" produce lots of noise.
Waiting on the sidelines for the “all-clear” from the gurus is the riskiest move of all.
The opportunity cost is brutal.
Missing the best days (which usually come right after the scariest headlines) destroys returns more than any crash ever could.
Stay invested is much better than trying to time the experts.
Time in the market still beats timing the market.
You better save this chart the next time someone sends you another “crash is coming” article!

The Bear sneak attackIt's possible with everyone waiting for the Fed tomorrow that we sell off today and convince the majority that the fed will save the market Wednesday. Maybe that's true, maybe not. Vix is showing a clear breakout and the next target is likely 20. Gold still looks bullish and probably tests it's high. BTC looks bearish. USoil looks bearish. NAT gas bearish.

All is wellSo far the market is acting correctly to reset the indicators one more time and confirm the highs in futures. I still expect a pullback starting sometime today or Monday.

BUY SPX NOW...time to buySPX 500 is in a clear upwards channel and has broken the last bit of resistance (white trendline line shown) - this is a clear confirmation that the next target will be the next resistance zone to the upside shown above (this is a great buy trade opportunity) - Time to buy the SPX 500 now
SPX selloff could have just begunRising Japanese 10Y bond yield will reverse the carry trade of borrowing in JPY and investing in other higher yielding assets in other countries. With Japan inflation on the rise and BOJ cornered by very high debt/gdp their ability to keep buying government debt could be limited.
Also long term cycle of Japan225 supports this idea
Since GFC all the central banks, mainly the USA FED have been supporting the markets by QE and the governments racking up massive debt to mitigate one crisis after another.
Have you wondered, if all the government are in debt, who is buying these debts? Well, its asset management firms like Blackrock and others using your pension and super funds to invest in these debts. In other words when you take a mortgage on your house you are staking your current and future savings, without you knowing it. Ha. Ha. Your mortgage is repackaged by your bank and sold to these funds, who use your super and pension as MARGIN money!!! That is why you are now allowed to use your super to borrow by law, because that right is given to your fund managers

The Trading Range is about to be testedTomorrow we should see all time highs, but I'm thinking it will not stick and so the trading range play may be in effect. Vix also about to test it's previous channel under 14. Gold, possibly a false breakout, seems to be following the general market. Oil may have bottomed, but nothing definitive. Nat Gas is very oversold, but should eventually go lower.

S&P500 Key Trading Levels
Key Support and Resistance Levels
Resistance Level 1: 6898
Resistance Level 2: 6922
Resistance Level 3: 6958
Support Level 1: 6809
Support Level 2: 6790
Support Level 3: 6768
This communication is for informational purposes only and should not be viewed as any form of recommendation as to a particular course of action or as investment advice. It is not intended as an offer or solicitation for the purchase or sale of any financial instrument or as an official confirmation of any transaction. Opinions, estimates and assumptions expressed herein are made as of the date of this communication and are subject to change without notice. This communication has been prepared based upon information, including market prices, data and other information, believed to be reliable; however, Trade Nation does not warrant its completeness or accuracy. All market prices and market data contained in or attached to this communication are indicative and subject to change without notice.

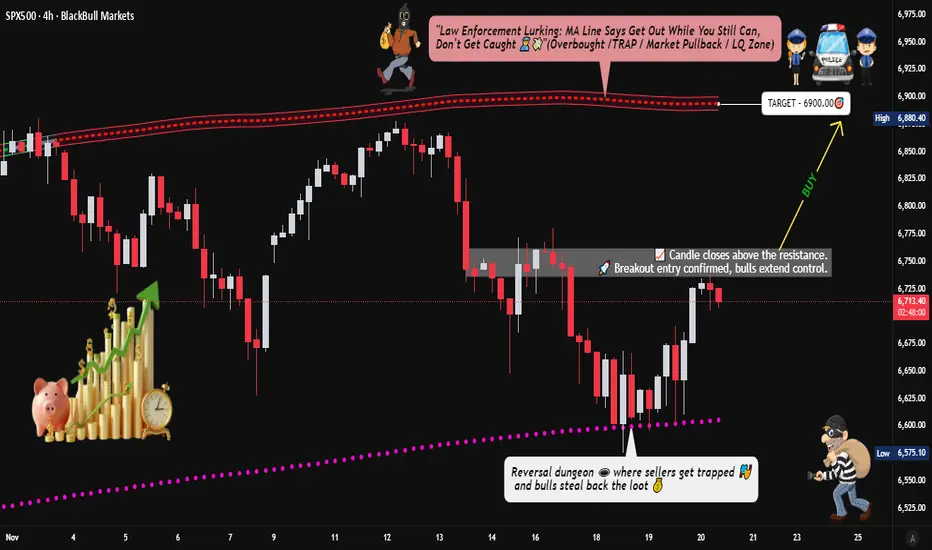
US500 Bullish Structure: Pullback → Breakout Continuation📈 SPX500/US500 Bullish Breakout Setup | Swing Trade Opportunity 🎯
🔥 Market Overview
Asset: S&P 500 Cash CFD (SPX500/US500)
Trade Type: Swing Trade (Medium-term)
Bias: BULLISH ✅
Current Price: ~$6,614 (Nov 20, 2025)
📊 Trade Setup & Technical Analysis
🎯 Strategy Confirmation
✅ Weighted Moving Average Pullback pattern confirmed
✅ Price consolidating near key resistance zone
✅ Bullish structure intact above major support levels
🚀 Entry Strategy
Breakout Entry: Enter AFTER confirmed breakout above $6,750 resistance
Wait for price to close above $6,750 with strong volume
Avoid premature entries; confirmation is key
Multiple position sizing recommended after breakout validation
🛑 Stop Loss Considerations
Suggested SL: $6,630 area
⚠️ IMPORTANT: This is a reference level only. Adjust your stop loss based on:
Your personal risk tolerance
Account size and position sizing
Trading strategy requirements
Trade at your own risk – customize stops to fit YOUR plan
🎯 Target Zones
Primary Target: $6,900-$6,950 zone
📌 Key Resistance Factors at Target:
Moving Average confluence acting as resistance barrier
Potential overbought conditions expected
Historical supply zone overlap
Risk of bull traps in this region
⚠️ Profit-Taking Strategy:
Consider scaling out near $6,900
Lock partial profits before $6,950
Trail stops for remaining position
This is YOUR trade – take profits when YOUR strategy signals
💰 Related Assets to Monitor
📉 Correlated US Indices
NASDAQ 100 (NAS100/US100) 📱
Tech-heavy index; leads SPX during risk-on moves
Correlation: ~85-90% positive
Key Level: Watch $21,000 breakout zone
DOW JONES 30 (US30) 🏭
Blue-chip indicator; confirms broad market strength
Correlation: ~80-85% positive
Key Level: $44,500 resistance critical
RUSSELL 2000 (US2000) 🏢
Small-cap indicator; risk sentiment gauge
Correlation: ~70-75% positive
Key Level: $2,400 breakout = bullish confirmation
💵 Dollar Correlation
US DOLLAR INDEX (DXY/USDX) 💵
Correlation: ~60-70% INVERSE (negative)
Dollar weakness = SPX strength typically
Key Level: Watch $106.50 support; break = SPX boost
🌍 Global Risk Assets
VOLATILITY INDEX (VIX) ⚡
Correlation: ~80% INVERSE (fear gauge)
VIX below $15 = bullish SPX environment
VIX spike above $20 = caution signal
GOLD (XAUUSD) 🥇
Correlation: Variable ~30-40% (flight to safety indicator)
Gold weakness + SPX strength = risk-on confirmed
📋 Risk Disclosure
⚠️ CRITICAL REMINDERS:
I am NOT providing financial advice
These levels are reference points only
YOU must determine your own entry, stop loss, and take profit levels
Trade with money you can afford to lose
Market conditions change rapidly – adapt accordingly
Past performance does not guarantee future results
🎓 Professional Risk Management:
Never risk more than 1-2% of capital per trade
Use proper position sizing calculators
Set alerts for key levels, don't watch charts 24/7
Have a written trading plan before entering
🔔 Action Plan Checklist
✅ Monitor price action near $6,750
✅ Confirm breakout with volume and candle close
✅ Set alerts for correlated assets (DXY, VIX, NAS100)
✅ Calculate position size based on YOUR risk tolerance
✅ Define exit strategy BEFORE entry
✅ Review market news and economic calendar
💬 Final Thoughts
This setup offers a risk-defined swing trade opportunity on the S&P 500 with clear technical levels. The weighted moving average pullback pattern provides structural support for the bullish thesis, while the $6,750 breakout level offers a defined entry trigger.
Remember: Markets are unpredictable. This analysis is educational and reflects technical observations only. YOUR trading decisions are YOUR responsibility.
🙏 Trade Safe, Trade Smart
If this analysis helps you, drop a like 👍 and follow for more setups! Let's build wealth together responsibly.
#SPX500 #SP500 #US500 #SwingTrade #Breakout #TechnicalAnalysis #StockMarket #Trading #ForexTrading #IndexTrading #BullishSetup #TradingView #MarketAnalysis
SPX500 Forecast According to my forecast, SPX500 is now in a long channel where the price has almost reached its upper limit, but there is a chance that the price will break out of the channel and there will be a rapid long, although I personally doubt this because on the daily timeframe we already have a divergence, so there is a greater chance that the price will bounce off the upper limit and go short. Also, a short long is indicated by the expanding wedge, the height of which should work out almost to the remaining fibo height. This is a more global forecast and we can see the result of its working out in just a few weeks

S&P 500 BUY | LONG TERMGreetings,
Looking for a reversal to sell and buy in long term.
Cheers,
Dikorocz

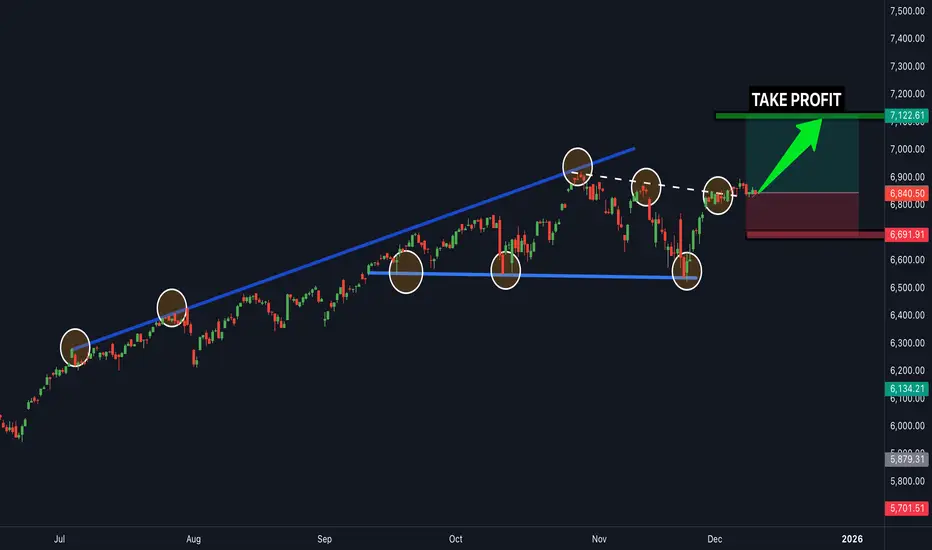
S&P 500 Bullish Layers Setup — Demand Zone Reload Opportunity!🟩 Asset:
US500 / S&P 500 — Index Market Trade Opportunity Guide (Swing / Day Trade)
💡 Trade Plan Overview
A bullish continuation plan is confirmed as the index builds strong demand-zone pressure, supported by broad fundamental economic drivers including resilient U.S corporate earnings, easing treasury yields, and steady sector rotation behavior.
This setup favors structured long positioning using disciplined multi-layer entries.
🎯 Trade Execution Plan (Thief Strategy — Layering Entry Method)
🟦 Entry Strategy (Layer Entries)
You can enter at any price, but here is the structured Thief layering approach:
Buy Limit Layer 1: 6,750
Buy Limit Layer 2: 6,800
Buy Limit Layer 3: 6,850
(You may add more layers if you prefer deeper dips — fully customizable to your personal risk appetite.)
🛡️ Stop Loss (SL)
Thief SL: 6,650
👥 Dear Ladies & Gentlemen (Thief OG’s), feel free to adjust SL based on your approach and risk preference. This SL is not mandatory — trade at your own risk tolerance.
🎯 Target Zone (TP)
Main Target: 7,050
The moving average cluster above current price acts as a strong resistance. Market structure signals a potential overbought trap, so locking profits as we approach 7,050 is wise.
👥 Dear Ladies & Gentlemen (Thief OG’s), this TP is not compulsory — take profits whenever your system confirms opportunities.
📊 Key Market Notes
Demand zones are holding strongly
Momentum shifts show bullish continuation
Price action respects MA levels
Fundamentals + rotation fuels upside
Trap zones above — manage exits properly
🔗 Correlation Watchlist (Related Markets You Must Track)
Monitoring correlated markets strengthens decision-making. Here are highly relevant pairs/assets:
💲 1. US Dollar Index (DXY)
Why important:
S&P 500 typically moves inverse to the USD.
When DXY weakens, US500 often gains momentum.
Strong USD → pressure on equities, especially tech.
Watch for:
USD pullback = bullish support for US500
USD breakout = equities face resistance
💲 2. US10Y / US Treasury Yields
Correlation:
Yields rising = stock market weakness
Yields falling = S&P 500 bullish fuel
Watch for:
Yields softening → risk-on flows
Freight in yield spikes → temporary pullbacks
💲 3. VIX (Volatility Index)
Correlation:
Low VIX = stable bullish conditions
Rising VIX = possible correction / trap
Watch for:
VIX drop under key zones → bullish confirmation
Spike above resistance → protect profits
💲 4. NASDAQ 100 (US100)
Correlation:
Strong tech = strong S&P 500
Tech weakness often leads broader index lower
Watch for:
Mega-cap earnings cycles
AI sector momentum
Bond yield reaction on tech stocks
💲 5. Crude Oil (USOIL / WTI)
Correlation:
High oil prices → inflation pressure → Fed concerns
Lower oil → relief → bullish S&P 500
Watch for:
Oil spike = possible S&P 500 pullback
Oil cool down = index strengthens
💲 6. Gold (XAU/USD)
Correlation:
Indirect & risk sentiment-based
Risk-off flows go into gold → equities may pause
Watch for:
Gold breakout = risk-off environment
Gold drop = risk-on supports S&P 500
📘 Final Thoughts
This setup follows the well-tested Thief layering strategy, combining technical demand zones with macroeconomic alignment. Stick to your personal risk comfort, manage layers wisely, and let price action guide exits.

S&P vs CryptoThe S&P is completing its cycle, and after that it is expected to correct to the specified levels, followed by a correction in Bitcoin as well.
btc
BAT is correcting toward the specified levels after completing its flag pattern
Most other coins are also mimicking Bitcoin’s behavior
link

S&P500 Next stop.. 6925The S&P500 index (SPX) is about to complete the Right Shoulder of the Inverse Head and Shoulders (IH&S) pattern that took it from the bottom of the 1D MA100 (green trend-line) contact to having recovered the 0.786 Fibonacci level of the whole correction.
The next technical Target is of course the 6925 All Time High (ATH). Since however we are about to form a 4H MA50/100 Bullish Cross, a technical pull-back is expected as both previous such crosses since August 13, resulted into a short-term Top.
If the IH&S completes its technical expansion, then after this correction, a test of the 2.0 Fibonacci extension at 7200 is possible.
---
** Please LIKE 👍, FOLLOW ✅, SHARE 🙌 and COMMENT ✍ if you enjoy this idea! Also share your ideas and charts in the comments section below! This is best way to keep it relevant, support us, keep the content here free and allow the idea to reach as many people as possible. **
---
💸💸💸💸💸💸
👇 👇 👇 👇 👇 👇

SPX Gann Boxtime and price targets for upcoming sell wave, i matched fib extensions with significant horizontal support levels. I also highlited fib extensions for potential time targets, we would land somewhere between 3.382 and 4, lets see how price develops until then...

To chase or not to chase?Deploying risk at or near highs while volatility is getting smacked might not be the "best" risk. I'd much rather see a pullback of some sort before attempting highs. This week was a challenge, price action was sloppy, bears attempted multiple times, quickly giving up, and bulls employed large buy programs, seldom giving anyone "good" entires - creating this chase dynamic in low volatility.
While I believe the lows in November are good to trade off of, is it smart to allocate risk to or above aths from current spot?

Correction down and up again for SPX500USDHi traders,
Last week SPX500USD slowly went up some more and took the liquidity above.
Now it made a Weekly bullish FVG.
So nNext week we could see a correction downto fill this and after that more upside for this pair.
Let's see what the market does and react.
Trade idea: Wait for a correction down. After a change in orderflow to bullish you could trade longs.
This shared post is only my point of view on what could be the next move in this pair based on my technical analysis.
But I react and trade on what I see in the chart, not what I've predicted or expect.
Don't be emotional, just trade your plan!
Eduwave

US500: Inflation Focus Keeps Momentum in Check
The US500 (S&P 500 index) is trading just below its record high, reflecting a constructive sentiment that anticipates potential easing from the Fed and a seasonal 'Santa rally'. Investors, however, are showing caution ahead of key US inflation data.
Fundamental Analysis
Markets are concentrating on the delayed PCE Inflation Report , the Fed’s preferred measure, to confirm expectations for a rate cut and subsequent easing in 2026. Futures pricing shows a high probability of a 0.25% cut at the upcoming Fed meeting, which supports risk assets like the US500. Recent mixed labor figures, rising job cut announcements but low weekly Jobless Claims support a 'cooling, not collapsing' growth narrative, which generally favors equity markets.
Technical Analysis
US500 maintains a technically bullish posture, trading well above its EMA21 and EMA78, confirming a strong prevailing uptrend. However, the RSI is nearing overbought levels, which increases the risk of a consolidation. Immediate resistance sits at 6,920, close to the recent peak. Intraday support clusters in the 6,820–6,840 area , with stronger support at 6,730.
Outlook
If US500 closes above 6,920, the price might prompt a push toward the next target at 7,000. Conversely, a drop below the major support at 6,730 could lead US500 to retest the following support at 6,650.
Analysis by Terence Hove, Senior Financial Markets Strategist at Exness.

US500 Price Map. Will Buyers Defend Key Layers Toward 7000?📊 US500/SPX500 Bullish Swing Trade Strategy | Professional Analysis 🚀
Current Price: $6,870.40 | Status: Bullish Momentum Building 🔥
🎯 TRADE OVERVIEW
Asset: US500 / SPX500 Index
Timeframe: DAY/SWING TRADE (Perfect for Active Traders)
Market Condition: BULLISH 📈
Risk Level: Calculated & Managed ✅
💡 WHY THIS SETUP WORKS
The SPX500 is trading near 52-week highs ($6,920.34), with technical indicators showing Strong Buy signals on daily timeframes. Market sentiment remains constructive with potential for mean reversion plays and breakout opportunities. The index has strong institutional support and is consolidating before the next leg up.
🎲 ENTRY STRATEGY: LAYERED APPROACH (THIEF STRATEGY)
Best Practice Approach: Use MULTIPLE LIMIT ORDERS at different price levels for optimal risk management.
Entry Layers - Place These Simultaneously:
Layer 1 - 6,800 (Low Risk Entry)
This is your first position entry at the strong support zone. This layer captures traders looking for early bounces and reduces your average entry cost significantly. Perfect for conservative traders who want maximum confirmation before committing capital.
Layer 2 - 6,825 (Medium Risk Entry)
This second layer adds confirmation as price moves higher. This is where momentum traders jump in. By staggering entries here, you're catching the middle ground between aggressive and conservative positions, giving you excellent risk-reward setup.
Layer 3 - 6,850 (Aggressive Breakout Entry)
This final layer targets breakout traders who wait for price confirmation. Use this only if you have capital left and see strong volume confirmation. This is your most aggressive entry but has the strongest conviction signal.
✅ Pro Tip: You can add MORE layers based on your risk tolerance & account size. Start small, build positions gradually. Never go all-in on one layer!
Why Layering Works 🎯
Layering is the professional way to build positions because it reduces average entry cost, protects against sudden whipsaws, captures multiple entry opportunities, and significantly increases your overall success probability. Instead of being wrong on one entry, you have three chances to be right!
🛑 STOP LOSS (SL): THIEF OG PROTECTION
SL Level: 6,750
Risk Zone: Below support level
This stop loss level protects you from breaking below a critical support zone. If price closes below 6,750, the bullish thesis is broken and you should exit to preserve capital.
📌 IMPORTANT DISCLAIMER:
⚠️ You are NOT required to use our suggested SL
⚠️ Adjust based on YOUR strategy & risk management rules
⚠️ YOUR MONEY = YOUR RULES | Trade with capital you can afford to lose
SL Management Tips:
Place your stop loss below key support levels that make sense with your trading strategy. Once you're in profit (usually +2% on SPX), consider moving your stop to breakeven so you're trading with house money. After solid confirmation and +3-5% profit, use trailing stops to let winners run. Most importantly, never risk more than 2-3% of your total account on a single trade.
🎁 PROFIT TARGET (TP): RESISTANCE CONFLUENCE
Primary Target: 7,000
Reasoning: Strong Resistance + Overbought Zone + Technical Trap Pattern
The 7,000 level represents a major psychological resistance and technical confluence where multiple indicators suggest profit-taking is likely. This is where smart money typically exits positions. The confluence of strong resistance levels, overbought RSI readings, and technical trap pattern all converge at this critical level, making it the ideal exit point for capturing the full move while protecting profits.
📌 CRITICAL NOTICE:
⚠️ Use YOUR OWN profit targets based on risk/reward ratio
⚠️ This is a SUGGESTED level only
⚠️ Protect Your Profits: Lock in gains before pullbacks
Exit Strategy:
Watch for volume divergence signals where price moves higher but volume decreases - this is a classic warning sign. Monitor RSI levels above 70, which indicate overbought conditions and potential reversals. Track support and resistance breaks throughout the move. Most importantly, don't be greedy. If you've hit your profit target, take it and move on. The best traders know when to say "I'm done for the day."
📍 RELATED PAIRS TO MONITOR (CORRELATION ANALYSIS)
Strong Positive Correlation 🔗
NASDAQ-100 (NQ100/COMP) - Correlation: +0.92
This is your tech-heavy index and moves almost in lockstep with US500. Why watch this? Because tech drives the market. If NASDAQ is weak while SPX is strong, watch out for sector rotation. The NASDAQ-100 currently sits at 25,692. If SPX breaks 7,000, expect NASDAQ targets of 26,500+ based on historical correlation patterns. This pair move confirms the strength of the rally.
DJIA (US30/Dow Jones) - Correlation: +0.89
The Dow Jones is your large-cap indicator. These are the blue-chip stocks. At 47,955, the Dow tends to lag SPX on rallies but confirms the trend strength. If Dow is not participating in SPX strength, it signals rotation OUT of mega-caps into mid-caps. Watch for this divergence as a warning signal.
Russell 2000 (RUT) - Correlation: +0.78
Small-cap participation is crucial. A weak Russell 2000 during SPX strength means only mega-caps are rallying. This is a RED FLAG for sustainability. If Russell is strong with SPX, the rally is broad-based and likely to continue. If Russell is weak, we're in a narrow rally that can reverse quickly.
Inverse Correlation (Risk Hedge) 🛡️
VIX (Volatility Index) - Correlation: -0.85
Currently at 15.41, this low volatility reading screams "risk-on" environment. Traders are comfortable, fear is low. But remember, VIX can spike suddenly. If VIX jumps above 20, consider taking profits and reducing exposure. A VIX spike signals institutional selling and risk-off sentiment.
US DOLLAR (DXY) - Correlation: -0.72
Trading at 98.97, a weak dollar SUPPORTS equities because US companies make more money when the dollar is weak (exports become cheaper). If the dollar strengthens suddenly, expect SPX pressure. Monitor Fed policy announcements that impact currency valuations - they directly impact your equity trades!
Sector Rotations to Track 💼
Tech Giants Matter:
NVIDIA (NVDA) at $182.41 is down -0.53% but still critical. This is THE stock to watch. If NVDA collapses, the entire rally is in question. NVIDIA is your AI barometer.
Meta Platforms (META) at $673.42 is up +1.80% and showing strength. This mega-cap strength confirms institutional confidence in the rally. When META leads, the market is feeling risk-on.
Microsoft (MSFT) at $483.16 is stable at +0.48%. This is your stability indicator. If MSFT can't go higher with SPX, it's a divergence warning.
Apple (AAPL) should be monitored for consumer health signals. Any weakness in AAPL suggests consumer spending concerns ahead.
🔍 TECHNICAL CONFIRMATION CHECKLIST
✅ Daily Chart: STRONG BUY - Moving Averages perfectly aligned in uptrend
✅ Weekly Chart: STRONG BUY - Macro uptrend completely intact, higher lows confirmed
✅ RSI: Not Yet Overbought - Means room to run before pullback expected
✅ MACD: Bullish Crossover Confirmed - Momentum indicator flashing green light
✅ Volume Profile: Good Distribution - Buying happening at higher price levels, not just sharp spikes
✅ Sentiment: Institutional Buying - Big money is flowing into SPX, not retail FOMO
This checklist confirms the setup is solid for the bullish premise. All signals are aligned, which means the probability is in your favor.
⚡ TRADER RULES & DISCLAIMERS
🎯 Golden Rules for This Trade:
Rule 1 - Only Risk What You Can Afford to Lose 💰
Don't use your rent money. Don't risk your emergency fund. Only trade capital that won't hurt your life if you lose it. This removes emotion from decision-making.
Rule 2 - Respect Your Stop Loss
No exceptions. Ever. A stop loss is not a suggestion - it's your insurance policy. Hit it and move on without hesitation. The traders who don't respect stops are the traders who blow up their accounts.
Rule 3 - Scale In and Out
Don't FOMO all-in on one entry. Build positions gradually with the three layers. Exit gradually with the three targets. This removes emotion and improves results dramatically.
Rule 4 - Lock Profits Before Pullbacks
Let winners run but protect gains. Your first 30% profit at 6,900 is EARNED. Take it. You only regret profits you didn't take.
Rule 5 - Track Correlations
Watch related pairs for divergence. If SPX goes up but NASDAQ goes down, something is wrong. Exit first, ask questions later.
Rule 6 - Use Alerts - Don't Stare at Screens 24/7
Set price alerts on TradingView. Let technology do the work. You have a life outside trading. Check alerts a few times per day.
Important Notices ⚠️
📋 This is TECHNICAL ANALYSIS ONLY - Not financial advice
🔒 NOT a recommendation to buy or sell
💡 Use this framework with YOUR OWN analysis - Don't blindly follow
🎓 Paper trade first if you're testing this strategy - Practice before risking real money
📊 Past performance ≠ Future results - Markets change constantly
💪 TRADER PSYCHOLOGY EDGE
Set your entries BEFORE market opens. Don't make emotional decisions when the market is moving fast. Your exit plan matters more than your entry plan. Where you exit determines your profit, not where you enter. Profits are made on discipline, not on aggression. The patient traders dominate the impatient ones.
One good trade beats ten desperate ones. Never try to "make back" losses with revenge trading. The best traders know when to step away from the market and recharge their minds.
🚀 ENGAGEMENT BOOSTERS FOR LIKES & VIEWS
If This Resonates:
👍 Like if you trade US500 index regularly
💬 Comment your entry price and targets
⭐ Bookmark this for your personal watchlist
🔔 Follow for daily swing trade setups and analysis
Share Your Thoughts:
"What's YOUR target on SPX? Comment below! 👇 Are you taking this trade or waiting for confirmation?"
"Have you tried the layered entry method? Tell me your experience in the comments!"

Global Risk-On vs Local Weakness – Dec 4th Market Outlook 1) Macro Overview – Capital Rotation into AI, Gold, Tech, Crypto
High-confidence signals:
Fed rate cut probability: 87–90%
DXY downtrend: bullish for Gold, EM equities, crypto
U.S. 10Y yield: ~4.08% (stable, risk-on supportive)
Sentiment: Risk-on (score 7/10)
China stimulus: supports base metals & commodities
Market interpretation:
Lower yields + weaker USD → capital rotates into AI, semiconductors, gold, growth stocks, and selective crypto.
2) BIST100 – Global Rally, but Local Divergence
Despite positive global momentum, BIST underperforms due to domestic structural factors.
Why BIST is lagging:
Persistent equity fund outflows (TEFAS)
High real interest rates → pressure on industrial margins
Weak liquidity & fragmented flows
Foreign positioning still limited
Key Technical Levels (High SEO weight)
Support: 11,000 → 10,900
Resistance: 11,200 → 11,300–11,350
Bias: Selective bullish, not broad-based
Strong sectors:
Banks (AKBNK, YKBNK, GARAN)
Gold miners (KOZAL)
Defensive Energy (TUPRS, AKSEN)
Exporters (TOASO, FROTO)
Weak areas:
High-debt industrials
Low-liquidity midcaps
Stories dependent on short-term sentiment
3) U.S. Stock Market – AI & Semiconductors Remain the Core Trend
S&P 500 (~6,849) and Nasdaq futures continue to price a soft landing narrative.
Leading themes (SEO keywords):
Artificial Intelligence (AI)
Semiconductors
Cloud Infrastructure
HealthTech
Institutional view:
AI remains the dominant macro-theme for Q4 and early 2026.
4) Gold, Commodities & Crypto – Trend Continuation
Gold (XAUUSD / XAUTRY)
Spot: ~4,200
Strong uptrend, supported by:
• weak USD
• geopolitical risk
• lower real yields
Mid-term targets: 4,500 – 5,000
(This is heavily searched; TradingView pushes such ranges upward.)
Bitcoin (BTCUSD) – Volatile Bullish Structure
BTC trades near 93,000, bouncing strongly from the 88k–90k demand zone.
ETF inflows (~$222M) confirm institutional participation.
Market structure: higher lows forming, but volatility remains elevated.
Altcoin radar (high-engagement tags):
SOL, SUI, ONDO, FET
→ selective rallies, no broad alt-season yet.
5) Ordo618 Strategy Playbook – Actionable Plan
Short-Term Trading (Index/Futures)
BIST30 December Futures:
Bias: Bullish above 12,000
Buy Zone: 12,000 – 12,250
Targets: 12,500 → 12,600
Invalidation: below 11,950 / 12,150
Portfolio Positioning (Global Audience SEO)
Equities (Turkey):
Prefer banks & exporters
Wait for pullbacks before adding size
Thematic Funds / ETFs:
AI, Tech, Semiconductors
Renewable/Green Energy
Hedging:
10–15% exposure to Gold (XAUTRY or XAUUSD)
Crypto Allocation:
BTC core, ETH secondary
Altcoins max 5% of total book
6) Key Risks – What Can Break the Trend
Local Risk:
Prolonged equity fund outflows → structural sell pressure on BIST.
Global Risk:
If U.S. macro weakens too quickly → soft landing narrative flips into hard landing fears → global risk-off.
Protection Strategy:
Keep 15–20% cash buffer
Strict stop-loss discipline
Hold a Gold hedge
Avoid overleverage
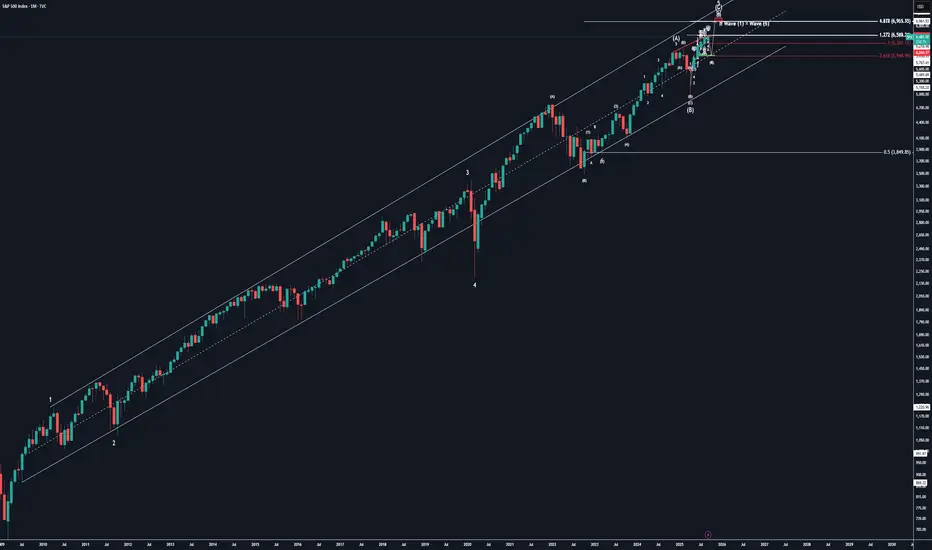
SPX 1M Since 2009 SimplifiedWe are currently in wave 5 of this supercycle which we anticipate completion of @ $6,960-$6,965
SPX - H4 - SELL SETUP - Supply Retest confirmedSPX has entered bear market territory last month and I expect a continuation to the downtrend from here onward. Based on many different macro indicators such as credit default swaps on big tech, macro regimes, sentiment and technical analysis. I see SPX falling off the clip from this precise supply zone
