SPX: rte-cut hypeJust a week before the September FOMC meeting, the S&P 500 reached another fresh, new all-time highest level at 6.594 at Friday's trading session. The index managed to gain another 1,6% for the week. The latest move is sort of gearing-up for the forthcoming FOMC meeting, where the market is expecting to see a 25 bps cut by FED officials. The jobs and inflation figures posted during the week, showed further stabilisation in inflation levels, but also weakening of the US jobs market. Both figures are supportive of the Fed to make a decision over a quarter-point rate cut. However, analysts are noting that the tone and rhetoric of Fed Chair Powell in after the meeting press conference on September 17th, will be crucial for the next move of US equity markets. Certainly, this will mark the most important day for financial markets in the week ahead.
Tech companies are again the ones that are driving the market to the higher grounds, TSLA gained 7,36% on Friday, continuing a recent upward trend. Despite no major announcements from Tesla, the stock has gained nearly 12% over the past week, driven by investor optimism that declining interest rates could boost car sales. The artificial intelligence tech firm Super Micro Computer jumped 6% after announcing it had begun volume shipments of its Nvidia Blackwell Ultra solutions to customers globally. Warner Bros Discovery rose nearly 8%, building on Thursday’s 29% surge, after reports in the news indicated that Paramount Skydance is preparing a takeover offer.
SPX trade ideas

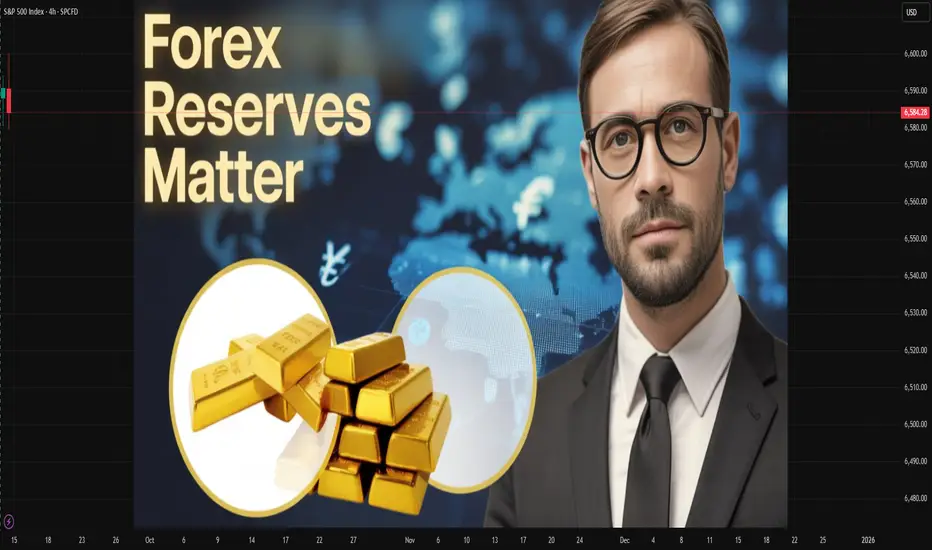
Why Forex Reserves Matter in Trading1. What Are Forex Reserves?
Forex reserves are assets held by a nation’s central bank in foreign currencies, precious metals like gold, Special Drawing Rights (SDRs) from the International Monetary Fund (IMF), and other reserve assets. These reserves are not just passive holdings; they are active instruments used for monetary policy, currency stabilization, and ensuring global payment obligations.
Key Components of Forex Reserves
Foreign Currencies – Typically held in USD, EUR, JPY, GBP, and increasingly CNY.
Gold Holdings – A traditional hedge against inflation and currency risk.
SDRs (Special Drawing Rights) – An IMF-backed reserve asset that supplements official reserves.
IMF Reserve Position – Access to IMF funding if needed.
2. Why Countries Accumulate Forex Reserves
Stability in Currency Markets
Countries need reserves to intervene in forex markets to prevent excessive volatility in their domestic currency.
Confidence for International Trade
Exporters and importers prefer dealing with countries that can guarantee payment stability.
Debt Servicing
Reserves allow governments to service foreign debt obligations without defaulting.
Buffer Against Economic Shocks
Acts as insurance against sudden capital flight, trade imbalances, or geopolitical crises.
Support for Sovereign Credit Ratings
Higher reserves improve investor confidence and reduce borrowing costs.
3. Importance of Forex Reserves in Global Trading
3.1 Stabilizing Currency Values
A currency’s exchange rate plays a central role in trade competitiveness. For example, if the Indian Rupee depreciates too rapidly, imports like oil and electronics become expensive. The Reserve Bank of India (RBI) can sell USD from its reserves to supply dollars in the forex market, stabilizing the rupee.
3.2 Controlling Inflation
Imported inflation is a major risk for countries dependent on foreign goods. By using reserves to maintain a stable currency, central banks reduce inflationary pressures, which directly impacts stock and bond markets.
3.3 Investor Confidence
High reserves attract foreign institutional investors (FIIs) because they see lower risk of capital restrictions. Conversely, low reserves signal vulnerability, causing capital flight.
3.4 Crisis Management
During the 1997 Asian Financial Crisis, countries with low reserves like Thailand suffered massive currency collapses, while nations with higher reserves recovered faster.
4. How Forex Reserves Impact Trading Across Markets
4.1 Currency Trading (Forex Markets)
Traders closely monitor reserve levels to predict central bank interventions.
A rise in reserves indicates strong capital inflows or trade surpluses, usually strengthening the currency.
A fall in reserves may mean heavy intervention to defend the domestic currency, creating volatility.
4.2 Equity Markets
Strong reserves signal economic resilience, attracting long-term investments.
For export-driven companies, reserve usage can stabilize currency swings, reducing earnings risk.
4.3 Bond Markets
Nations with healthy reserves are seen as safer borrowers.
Sovereign bond yields fall when reserves are high, lowering borrowing costs.
4.4 Commodity Trading
Forex reserves influence global demand for commodities. For example, when China builds reserves, it often buys U.S. Treasuries and commodities, boosting global demand.
Gold prices also respond directly to central bank reserve diversification strategies.
5. Case Studies: Forex Reserves and Trading Dynamics
5.1 China
Holds the world’s largest reserves (over $3 trillion).
Uses reserves to keep the yuan stable, ensuring export competitiveness.
Global traders watch China’s reserve reports to gauge trade and commodity flows.
5.2 India
As of 2025, India’s reserves are above $650 billion.
Provides a cushion against oil import costs and FII outflows.
Traders interpret rising Indian reserves as bullish for the rupee and equity markets.
5.3 Russia (Post-Sanctions)
Sanctions froze Russia’s dollar reserves in 2022.
Moscow shifted to gold and yuan, changing global reserve composition.
Traders saw sharp volatility in ruble trading due to limited access to USD reserves.
6. Forex Reserves as a Trading Indicator
For traders, reserves serve as a leading indicator of currency and capital flow trends.
Rising Reserves: Suggests export growth, capital inflows, and stable currency → bullish sentiment.
Falling Reserves: Signals interventions, capital flight, or trade deficits → bearish sentiment.
Traders often combine reserve data with:
Balance of Payments (BoP) reports
Capital account movements
Central bank policy signals
7. Risks of Over-Reliance on Reserves
While reserves are critical, there are risks:
Opportunity Cost – Funds invested in low-yield assets like U.S. Treasuries could have been used domestically.
Geopolitical Risk – Sanctions can freeze reserves held abroad.
Currency Depreciation of Reserve Assets – Holding too many USD assets can hurt if the dollar weakens.
False Security – Excessive reliance may delay structural economic reforms.
8. Future of Forex Reserves in Global Trading
Shift Toward Gold & Yuan – Central banks are diversifying away from the USD.
Digital Reserves (CBDCs) – Future reserves may include digital currencies issued by central banks.
Geopolitical Weaponization of Reserves – The Russia-Ukraine war highlighted how reserves can be frozen, making diversification essential.
AI and Data-Driven Reserve Management – Advanced analytics will improve reserve allocation strategies.
9. Lessons for Traders and Investors
Currency traders should track reserve levels as part of fundamental analysis.
Equity investors should see reserves as a buffer against volatility.
Bond traders should link reserves with sovereign credit risk.
Commodity traders should monitor how reserve diversification affects gold and oil demand.
Conclusion
Forex reserves are not just a financial cushion for governments; they are a critical trading signal that reflects a country’s economic health, ability to withstand crises, and global credibility. From stabilizing exchange rates to influencing global capital flows, reserves touch every corner of financial markets.
For traders, understanding the dynamics of reserves means being able to anticipate currency movements, equity flows, bond yields, and commodity prices with greater accuracy. In a world of heightened volatility, forex reserves remain one of the most powerful forces shaping international trade and financial stability.
S&P500 | H2 Double Top | GTradingMethodHello Traders,
Watching the S&P for a potential double top.
It also aligns with the retest of the rising wedge, which is has already broken to the downside. This kind of confluence gives me extra excitement about a trade.
What I still need to happen for me to open the trade:
- H2 candle close in the entry range
- H2 candle that closes in the range needs a certain closure rate
- RSI needs to create another divergence
- Volume needs to be lower on T2, although my system does give exceptions if there is a data release, in this case FOMC, so exception will likely apply.
📊 Trade Plan:
Risk/reward = Between 3.3 and 4.3
Entry price = Between 6630 and 6639.9
Stop loss price = Between 6649.2 and 6656.8
Take profit level 1 (50%) = 6576
Take profit level 2 (50%) = 6553
I would ideally like my stop loss above the rising wedge, that way it needs to break through both barriers.
Also, if this pattern plays out, I think it will drag the crypto market down with it... Unfortunately.
💡 GTradingMethod Tip:
Always predefine your risk before entering a trade. This is a non negotiable to becoming a professional trader.
🙏 Thanks for checking out my post!
Make sure to follow me for updates and let me know in the comments — do you see the wedge retest as bearish, or do you think the bulls have more room to run?
📌 Please note: This is not financial advice. This content is to track my trading journey and for educational purposes only.
Peace
G

S&P 500 Index Holds Near Record High Ahead of Fed AnnouncementS&P 500 Index Holds Near Record High Ahead of Fed Announcement
At 21:00 GMT+3 today, the Federal Reserve will announce its interest rate decision, followed by Jerome Powell’s press conference. The rate is widely expected to be cut from 4.25%–4.50% to 4.00%–4.25%.
This will conclude a prolonged intrigue fuelled by President Trump:
→ his constant criticism of Powell for pursuing an “overly tight” policy;
→ the decision to dismiss Federal Reserve Board member Lisa Cook, which markets perceived as direct pressure on the regulator’s independence.
In anticipation of the outcome, traders are showing optimism. The S&P 500 index reached a new all-time high yesterday, climbing above 6,640 points. This morning the price pulled back slightly, which can be interpreted as a short-term correction ahead of a key event. Effectively, the market has already priced in the expected policy easing, viewing it as a catalyst for further growth.
Technical Analysis of the S&P 500 Chart
Six days ago, when analysing the 4-hour chart of the S&P 500 (US SPX 500 mini on FXOpen), we noted that:
→ the price was oscillating within an upward channel (marked in blue);
→ in September, the index has been following a steep bullish trajectory (marked in orange), with its lower line showing signs of support.
Since then, favourable inflation data helped the bulls break above the channel’s upper boundary (highlighted with an arrow).
Possible scenarios:
Bullish perspective:
→ The breakout candle above the blue channel has a long body, signalling strong buying momentum – an imbalance, also known in Smart Money Concept (SMC) as a Fair Value Gap (FVG).
→ The local level of 6,600, once resistance, has now turned into support; the next target could be the psychological level of 6,700.
→ The price is consolidating above the blue channel’s upper boundary, indicating robust demand.
Bearish perspective:
→ The upper boundary of the orange channel may act as resistance.
→ The RSI indicator, although off overbought territory, remains close to it – potentially deterring buyers from entering at elevated prices.
Taking all of this into account, the current balance could easily be disrupted once the Fed announces its rate decision – arguably the most significant event of the month in the economic calendar. Be prepared for spikes in volatility, as sharp moves in either direction are possible.
This article represents the opinion of the Companies operating under the FXOpen brand only. It is not to be construed as an offer, solicitation, or recommendation with respect to products and services provided by the Companies operating under the FXOpen brand, nor is it to be considered financial advice.

Up and down all aroundJust a possible path according to EW theory. This 5-wave move can extend into the end of the year.

US500Success in forex and stocks comes from a combination of knowledge, discipline, and patience. Understanding market trends, economic factors, and company fundamentals is crucial, but equally important is controlling emotions and sticking to a well-planned strategy. Continuous learning, adapting to changing conditions, and managing risk wisely can turn opportunities into consistent growth over time. Consistency, not luck, separates successful traders from the rest.

S&P500 | H1 Head and Shoulders | GTradingMethod👋 Hello again fellow Traders,
I already have a short open from 6 633.7, but I’d love to see a Head & Shoulders pattern develop so I can scale into more shorts.
So far, the build-up looks promising — volume has picked up significantly on this drop, which is a bearish signal. That said, I’m still waiting on confirmation before committing further.
📊 Trade Plan:
Risk/Reward: 3.1
Entry: 6 614.3
Stop Loss: 6 625.4
Take Profit 1 (50%): 6 586.9
Take Profit 2 (50%): 6 570.2
🔎 What I Need to See First:
A 30m candle to reach and close in range
Lower volume on the candle that closes in range vs. the left shoulder
More candles forming the right shoulder
💡 GTradingMethod Tip:
Patience is key. The best trades usually come when all conditions align — not just some of them.
🙏 Thanks for checking out my post! Make sure to follow me for updates, and keen to hear what your prediction is.
📌 Please note: This is not financial advice. This content is to track my trading journey and for educational purposes only.

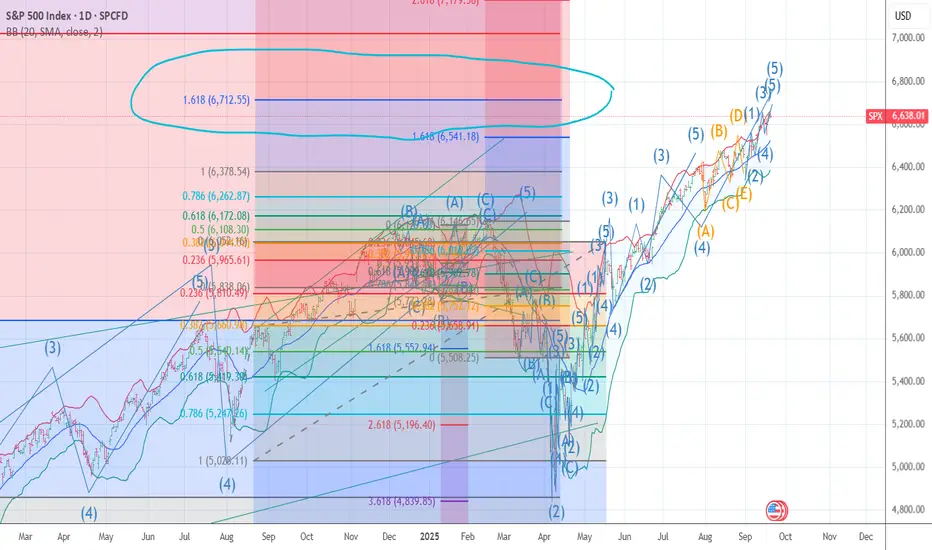
My top wave count alt 6681/6712I have moved back into puts for 2027 rather deep in the money As we are now up almost 24 to 26 weeks in this rally .The PUT to call ratio is now into level I see as mind blowing on 5 10 and now 20 day . and also have three bearish Divergences from Rsi to two of my private models .I have a major turn once again based on the Spirals 2/19 top and 4/7 low they are due near the end of next week . I am now 95 % in Puts and will move to 115% next week based on the dates or is the sp cash can rally to 6709 next week Best of trades WAVETIMER
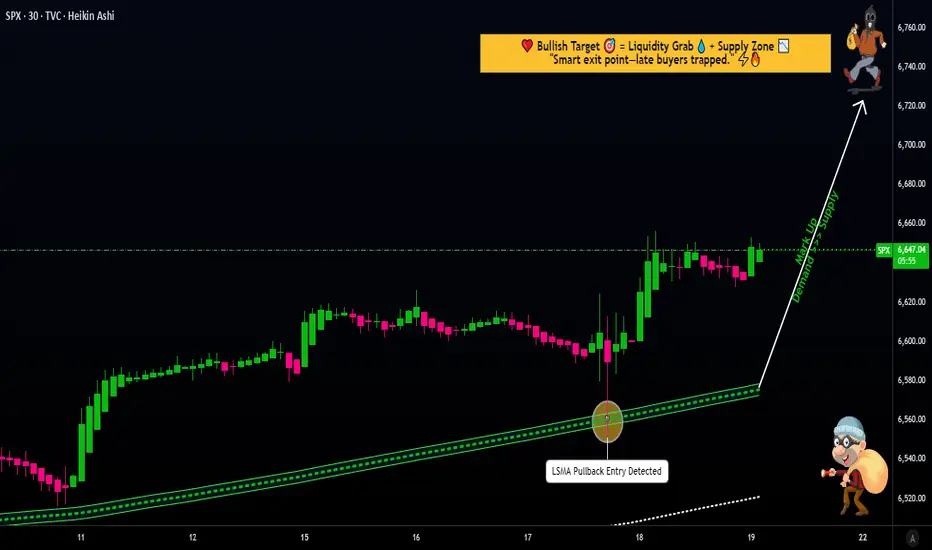
SPX500 Trading Strategy Explained: From Entry to Exit⚡ SPX500 “STANDARD & POOR” Indices Market Wealth Strategy Map ⚡
(Swing / Day Trade Plan – Thief OG Style)
🧭 Plan
📈 Bias: Bullish confirmed with 30m LSMA pullback + 0.786 Fibonacci-based MA confluence.
💡 Entry Approach (Thief Layering Strategy™):
Instead of one-shot entry, I place multiple buy-limit layers to average into strength. Example setup:
Buy limit: 6600
Buy limit: 6620
Buy limit: 6640
👉 You can extend or adjust the layering based on your own strategy.
🎯 Stop Loss (SL)
This is my Thief SL @6560.
⚠️ Note to Ladies & Gentlemen (Thief OG’s): This SL is not a recommendation. Use your own judgment — protect your loot at your own risk.
💰 Target (TP)
📌 6750 — sitting at strong resistance + overbought zone + possible bull-trap.
⚠️ Again, OG’s — this is not financial advice. Take profit when it fits your plan. Secure the bag, then enjoy the loot!
🔍 Related Pairs to Watch
Keep an eye on these correlated assets to confirm the SPX500’s move:
NASDAQ:NDX (Nasdaq 100): Tech-heavy index with strong correlation to SPX500. If tech stocks are pumping, it’s a bullish signal for our trade. 📊
TVC:DXY (US Dollar Index): A weaker dollar often boosts equities. Watch for inverse correlation—DXY dropping could mean SPX500 is ready to fly! 🚀
TVC:VIX (Volatility Index): Low VIX levels signal market calm, supporting our bullish setup. A spike in VIX could warn of trouble, so stay sharp! ⚡
Key Correlation Insight: SPX500 often moves in tandem with NASDAQ:NDX due to shared tech giants (think Apple, Microsoft). If NASDAQ:NDX is rallying, it’s a tailwind for our trade. Conversely, a rising TVC:DXY or TVC:VIX could signal caution.
📝 Thief Note
Dear Ladies & Gentlemen (Thief OG’s):
This map is my personal swing/day trade playbook — not a fixed recommendation. Layer entries, cut losers fast, and loot when you can. Market moves are wild; manage risk like a true OG.
✨ “If you find value in my analysis, a 👍 and 🚀 boost is much appreciated — it helps me share more setups with the community!”
⚠️ Disclaimer: This is a Thief-style trading strategy shared just for fun & educational vibes. Not financial advice. DYOR & trade responsibly.
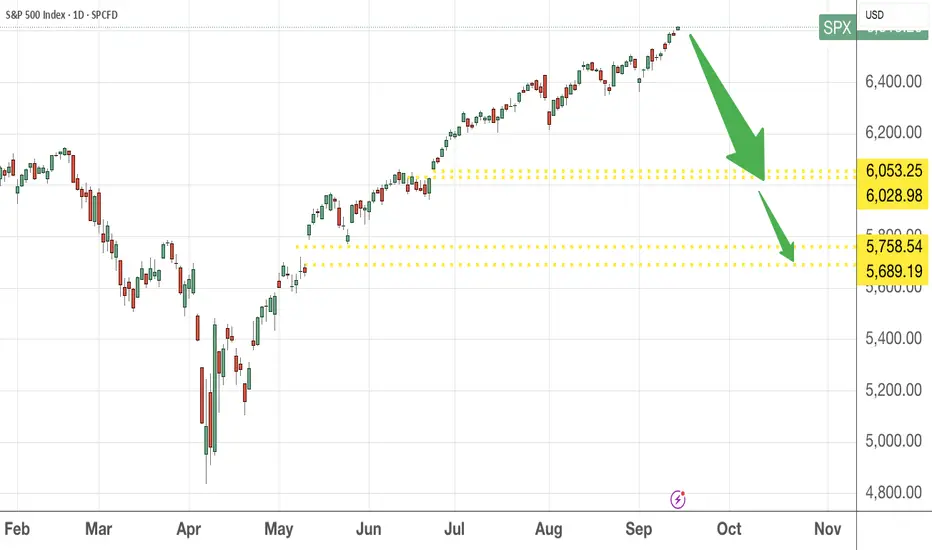
What to do now that FEDs going to lower interest rates ?This is for traders who enjoys taking advantage of short term market movements. For investors who are holding on to great companies, just sit tight.
The first support level is the gap at 6023 price level. The 2nd level at 5689 is less likely but not impossible.
This fall will be good as US markets are over valued for a while and any falls will be a good accumulation point. Also, the month of September is also seasonally a down month so no hurry to get in. So do be patient and please DYODD.
YOU MAY LIVE TO SEE MANMADE HORRORS BEYOND YOUR COMPREHENSION :)"Beyond Technical Analysis" aka "Wave Analysis > Shingo Waves"
Some very notable calls in recent years:
SPREADEX:NIKKEI and TVC:DJI both to 40k (over 1y in advance)
CRYPTOCAP:BTC pico bottom at 15k and recent local top at 70k
FX:EURUSD pico bottom & TVC:DXY pico top at 115
TVC:USOIL pico bottom at 68
NASDAQ:SMCI mega breakout at 100
NASDAQ:NVDA mega support at 120
NASDAQ:TSLA pico bottom at 105
NASDAQ:NFLX pico bottom at 165
I've also absolutely NAILED _both_ OANDA:XAUUSD and OANDA:XAGUSD breakouts in their entirety (@ see history)
SPX: rate cut fuels market rallyThe Fed finally made a long awaited move and cut interest rates by 25 basis points, for the first time during this year. Additional cuts are possible during the Q4, however, they will depend on the economic data, not on expectations from markets. Fed Chair Powell stressed that risks are now switched to the jobs market from the inflation, which moved relatively stable during the past period, although still modestly above the Fed's target of 2%.
The US equity markets continue to react positively to new macro developments, with S&P500 reaching another new all time highest level as of the end of the week at 6.665. The market also continues to move within a highly overbought range. Some analysts are beginning to stress that current S&P 500 levels are trading at 22 times forward earnings, noting that a period of consolidation would be a healthy period.
The rise in the S&P500 was helped by a sharp jump in Intel shares, which surged nearly 23% following Nvidia’s $5 billion investment and their plan to collaborate on AI-chips. Other top contributors included Nvidia, which recovered earlier losses despite concerns over Chinese tech regulations. Meanwhile, some S&P 500 stocks lagged: Darden Restaurants fell after disappointing earnings, and CrowdStrike saw gains after broker upgrades.

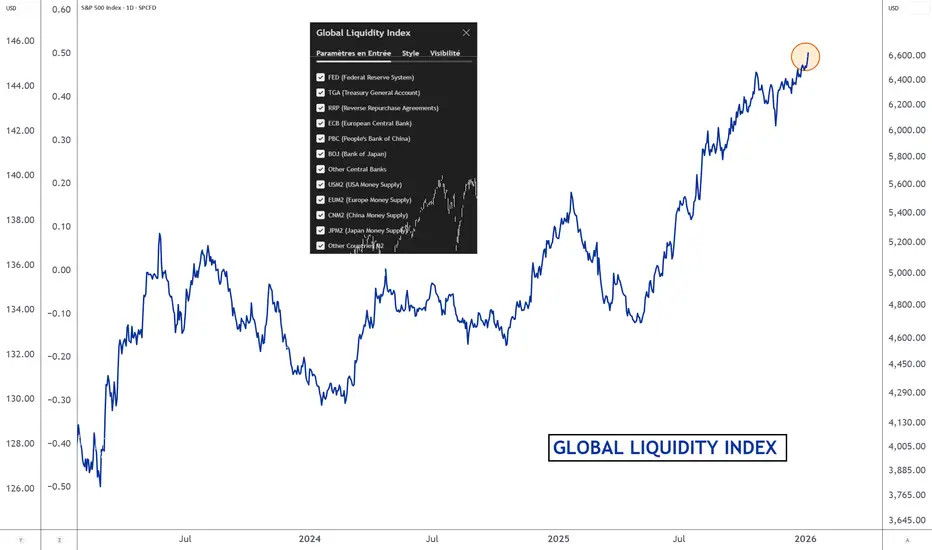
New all-time high in global financial liquidity1) The Fed has unveiled its new monetary policy trajectory, here are the key takeaways:
- Federal funds rate cycle through the end of 2025: there should be a total of 3 rate cuts by year-end.
- Update of macroeconomic projections: The Fed acknowledges the slowdown in the labor market and still expects inflation to normalize during 2026, allowing time to absorb the impact of tariffs.
- Balance of power among the 12 voting FOMC members: 11 out of 12 voted for a 0.25% rate cut, with only Stephen Miran voting for a jumbo Fed cut.
In the end, Jerome Powell’s Fed has thus enacted a genuine monetary pivot to account for the labor market slowdown, while remaining cautious about the upcoming normalization of inflation. The more accommodative monetary trajectory announced should provide support for risk assets in the stock market, but upcoming U.S. employment and inflation updates will still have a strong impact.
2) Global liquidity hits a new all-time high, a supportive factor for risk assets
Correlation studies show that risk assets in the stock market are highly correlated with the trend in global liquidity, i.e., the sum of the money supplies of the world’s major economies. Simply put, when the underlying trend of global liquidity is bullish, the S&P 500 and bitcoin prices also follow a bullish trend, and vice versa.
There are several ways to represent a country’s money supply, and the M2 monetary aggregate is recognized as the best measure of available liquidity within a state. Global M2 liquidity is calculated by aggregating the money supplies of major economies, notably the United States and China, converted into U.S. dollars (USD). The dollar’s evolution directly influences this measure: a strong dollar reduces global M2 in USD terms, while a weak dollar increases it, affecting capital flows and global financial conditions.
While global M2 liquidity is decisive, the net credit capacity within the financial system also plays a major role. When this is added to global M2, you get global liquidity — and this has just reached a new all-time high, as shown in the chart attached to this article.
This should therefore be a supportive factor for the stock market through year-end.
DISCLAIMER:
This content is intended for individuals who are familiar with financial markets and instruments and is for information purposes only. The presented idea (including market commentary, market data and observations) is not a work product of any research department of Swissquote or its affiliates. This material is intended to highlight market action and does not constitute investment, legal or tax advice. If you are a retail investor or lack experience in trading complex financial products, it is advisable to seek professional advice from licensed advisor before making any financial decisions.
This content is not intended to manipulate the market or encourage any specific financial behavior.
Swissquote makes no representation or warranty as to the quality, completeness, accuracy, comprehensiveness or non-infringement of such content. The views expressed are those of the consultant and are provided for educational purposes only. Any information provided relating to a product or market should not be construed as recommending an investment strategy or transaction. Past performance is not a guarantee of future results.
Swissquote and its employees and representatives shall in no event be held liable for any damages or losses arising directly or indirectly from decisions made on the basis of this content.
The use of any third-party brands or trademarks is for information only and does not imply endorsement by Swissquote, or that the trademark owner has authorised Swissquote to promote its products or services.
Swissquote is the marketing brand for the activities of Swissquote Bank Ltd (Switzerland) regulated by FINMA, Swissquote Capital Markets Limited regulated by CySEC (Cyprus), Swissquote Bank Europe SA (Luxembourg) regulated by the CSSF, Swissquote Ltd (UK) regulated by the FCA, Swissquote Financial Services (Malta) Ltd regulated by the Malta Financial Services Authority, Swissquote MEA Ltd. (UAE) regulated by the Dubai Financial Services Authority, Swissquote Pte Ltd (Singapore) regulated by the Monetary Authority of Singapore, Swissquote Asia Limited (Hong Kong) licensed by the Hong Kong Securities and Futures Commission (SFC) and Swissquote South Africa (Pty) Ltd supervised by the FSCA.
Products and services of Swissquote are only intended for those permitted to receive them under local law.
All investments carry a degree of risk. The risk of loss in trading or holding financial instruments can be substantial. The value of financial instruments, including but not limited to stocks, bonds, cryptocurrencies, and other assets, can fluctuate both upwards and downwards. There is a significant risk of financial loss when buying, selling, holding, staking, or investing in these instruments. SQBE makes no recommendations regarding any specific investment, transaction, or the use of any particular investment strategy.
CFDs are complex instruments and come with a high risk of losing money rapidly due to leverage. The vast majority of retail client accounts suffer capital losses when trading in CFDs. You should consider whether you understand how CFDs work and whether you can afford to take the high risk of losing your money.
Digital Assets are unregulated in most countries and consumer protection rules may not apply. As highly volatile speculative investments, Digital Assets are not suitable for investors without a high-risk tolerance. Make sure you understand each Digital Asset before you trade.
Cryptocurrencies are not considered legal tender in some jurisdictions and are subject to regulatory uncertainties.
The use of Internet-based systems can involve high risks, including, but not limited to, fraud, cyber-attacks, network and communication failures, as well as identity theft and phishing attacks related to crypto-assets.
Negative divergence + vwap resistance4h negative divergence + vwap resistance. It's a bull trap, it will go down again (into the bear trap perhaps). 6550 is the minimum target.

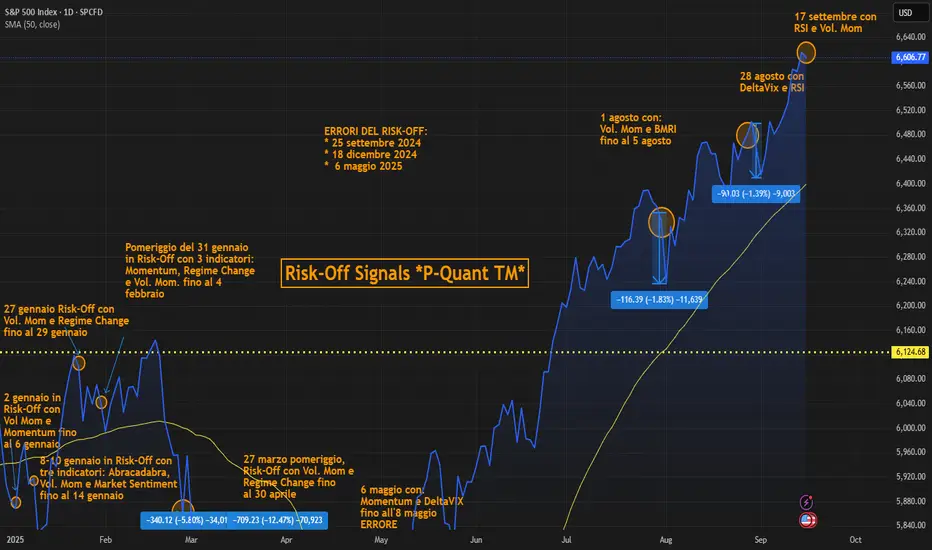
Risk-Off SignalsWith 2 indicators: Vol. Momentum and RSI. On 17 September the P-Quant EWS TM signal is in Risk-Off.
Let'see next movements.
S&P500 Key Trading levels Optimism on US-China relations drove markets higher after Trump’s positive Madrid meeting comments and Treasury Sec. Bessent’s note on a TikTok deal framework.
The NASDAQ Golden Dragon China index (+0.87%) outperformed as US-listed Chinese firms rallied.
This lifted global equities: S&P 500 +0.47% (new ATH), Stoxx 600 +0.42%, both near record highs.
Tech led gains: NASDAQ +0.94%, Magnificent 7 +1.95%. Alphabet hit $3trn valuation, Tesla +3.56% on Musk’s share purchase. Nvidia slipped (-0.04%) on China antitrust news.
Despite broad weakness under the surface, the S&P 500 is now +12.47% YTD and has risen in 6 of the past 7 weeks—its strongest stretch in 2025.
Conclusion for S&P 500 today:
With sentiment anchored by trade optimism and tech leadership, momentum remains upward, but concentration in a few mega-cap names alongside weaker breadth suggests potential for near-term consolidation even as the broader index holds bullish bias.
Key Support and Resistance Levels
Resistance Level 1: 6640
Resistance Level 2: 6660
Resistance Level 3: 6680
Support Level 1: 6575
Support Level 2: 6550
Support Level 3: 6530
This communication is for informational purposes only and should not be viewed as any form of recommendation as to a particular course of action or as investment advice. It is not intended as an offer or solicitation for the purchase or sale of any financial instrument or as an official confirmation of any transaction. Opinions, estimates and assumptions expressed herein are made as of the date of this communication and are subject to change without notice. This communication has been prepared based upon information, including market prices, data and other information, believed to be reliable; however, Trade Nation does not warrant its completeness or accuracy. All market prices and market data contained in or attached to this communication are indicative and subject to change without notice.

Still going up for SPX500USDHi traders,
I show you week after week what price will do. If you follow my outlooks, you've made a lot of profit.
For example SPX500USD played out exactly as predicted in my previous outlook. After a sharp correction it continued the upmove and made a new ATH.
Now next week we could see a little more upside and a bigger correction down for (orange) wave 4.
Let's see what the market does and react.
Trade idea: Wait for a small pullback and a change in orderflow to bullish on a lower timeframe to trade longs.
If you want to learn more about trading FVG's & liquidity sweeps with Elliott wavecount and patterns, then please make sure to follow me.
This shared post is only my point of view on what could be the next move in this pair based on my technical analysis.
Don't be emotional, just trade your plan!
Eduwave

US500Success in forex and stocks comes from a combination of knowledge, discipline, and patience. Understanding market trends, economic factors, and company
fundamentals is crucial, but equally important is controlling emotions and sticking to a well-planned strategy. Continuous learning, adapting to changing conditions, and managing risk wisely can turn opportunities into consistent growth over time.
Consistency, not luck, separates successful traders from the rest.

Update Before the Big Rate Decision: Expected to Lower RatesUpdate Before the Big Rate Decision: Expected to Lower Rates

Hellena | SPX500 (4H): LONG to resistance area of 6600.Colleagues, the main idea is still the upward movement in the impulse of the middle wave “5”.
Wave “4” is likely to take place, because the bulls need to gain strength to update the local maximum of 6512.
The most important thing here is that the target of 6600 is a round number, which is quite attractive for buyers and limit sellers.
Manage your capital correctly and competently! Only enter trades based on reliable patterns!

S&P500 Key support at 6600FOMC Takeaways
Fed cut rates 25bps to 4.00–4.25%, as expected.
Powell framed it as a “risk-management cut”, tempering hopes for an aggressive easing cycle.
Dot plot now signals 75bps total cuts in 2025 (vs. 50bps before), with softer growth/labour tone.
Markets saw a whipsaw: initial rally → Treasury selloff → equities flat by close.
Market Moves
Equities: S&P 500 closed -0.10%, after falling as much as -0.84% intraday.
Sector split: IT lagged (-0.70%), but financials (+0.96%) and consumer staples (+0.90%) outperformed.
Futures (Asia session): S&P +0.49%, Nasdaq +0.73% → rebound tone.
Rates: Yields higher post-FOMC (10yr +6bps to 4.09%) but down 2–2.5bps this morning.
FX: Dollar Index +0.18% overnight, extending gains despite initial dip.
Trading Implications
Market focus: Is the economy strong enough to sustain gains with only a gradual Fed cutting path?
Bull case: Rate-sensitive domestic sectors (financials, staples, housing-related) showing resilience; futures pointing higher.
Bear case: Transports lag industrials (Dow at records, transports weaker) – a potential warning sign for breadth of the rally.
Catalyst today: FedEx earnings – a key test for global trade/transport demand and market breadth confirmation.
Key Support and Resistance Levels
Resistance Level 1: 6660
Resistance Level 2: 668
Resistance Level 3: 6700
Support Level 1: 6600
Support Level 2: 6570
Support Level 3: 6550
This communication is for informational purposes only and should not be viewed as any form of recommendation as to a particular course of action or as investment advice. It is not intended as an offer or solicitation for the purchase or sale of any financial instrument or as an official confirmation of any transaction. Opinions, estimates and assumptions expressed herein are made as of the date of this communication and are subject to change without notice. This communication has been prepared based upon information, including market prices, data and other information, believed to be reliable; however, Trade Nation does not warrant its completeness or accuracy. All market prices and market data contained in or attached to this communication are indicative and subject to change without notice.

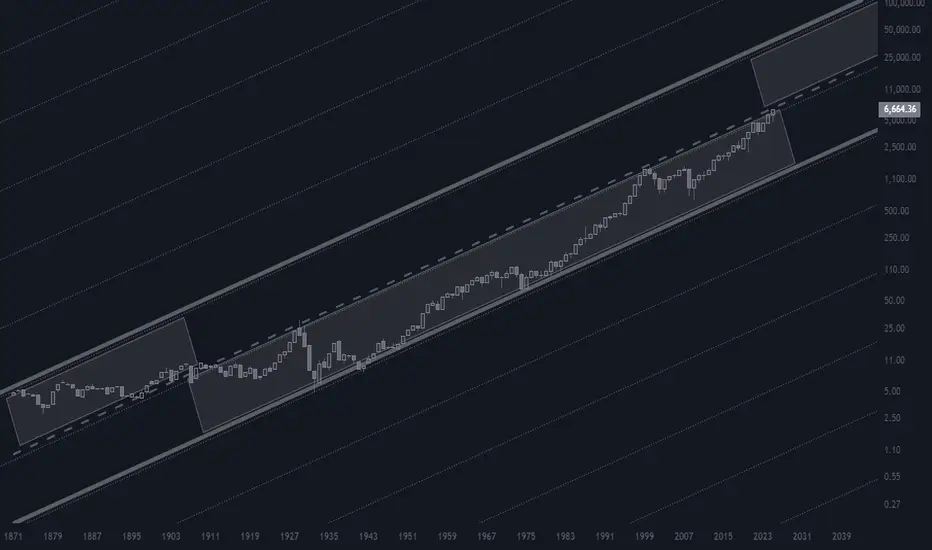
S&P500 | 100 year bullish channel | GTradingMethodHello Traders - Happy Monday!
I thought this was a very interesting perspective on S&P500.
What they don’t want you to see... 👀
The S&P has been moving inside a bullish channel for nearly 100 years (since 1925).
Right now, price is breaking out of that channel but is it fakeout?
If it’s a fakeout, the implications are huge: we could be looking at a 70% drop back to the bottom of the channel.
⚠️ Chart is on the monthly timeframe with a logarithmic scale.
What do you think — breakout or fakeout? Very keen to hear all your thoughts
#TradingLife

US500 (S&P500) Projection📊 US500 (S&P500) Forecast | Intraday & Swing Outlook 🚀📉
Asset Class: US500 CFD (SPX, SPY, S&P500)
Current Closing Price: 6,661.8 (20th Sept 2025, 12:50 AM UTC+4)
🔎 Market Overview
The S&P500 remains highly volatile as it consolidates near all-time highs. Both bullish continuation and reversal traps are emerging.
We integrate Elliott Wave 🌊, Ichimoku ☁️, Gann 🔺, and VWAP 📏 tools to frame trade setups.
⚡ Intraday Technical Levels
Immediate Support: 6,635 – 6,610 🟢
Key Resistance: 6,690 – 6,725 🔴
VWAP Zones: Anchored support at 6,628 📏
RSI: Neutral (52) → room to swing both sides 📈📉
🎯 Intraday Trade Ideas
Buy (Scalp): 6,620 – 6,635 🛒
Target: 6,670 → 6,690 🚀
Stop Loss: Below 6,600 ❌
Sell (Scalp): 6,690 – 6,710 🛑
Target: 6,645 → 6,625 📉
Stop Loss: Above 6,730 ❌
⏳ Swing Trading Outlook
Swing Support: 6,580 – 6,520 📉
Major Resistance: 6,750 – 6,820 🚀
Ichimoku Cloud: Bullish bias (daily/weekly) ☁️
Wave Count: Elliott suggests Wave 4 consolidation before Wave 5 breakout 🌊
🎯 Swing Trade Ideas
Buy (Swing): 6,580 – 6,600 🛒
Target: 6,720 → 6,800 🚀
Stop Loss: 6,520 ❌
Sell (Swing): 6,750 – 6,820 🛑
Target: 6,640 → 6,600 📉
Stop Loss: 6,860 ❌
📐 Pattern Watchlist
⚠️ Potential Bull Trap: Above 6,725 – rejection zone
⚠️ Head & Shoulders risk: Breakdown below 6,580
📏 Gann Levels: Time cycle indicates critical reversal window next week
☁️ Ichimoku Twist: Signals momentum shift by month-end
📌 Strategy Recap
🎯 Intraday Bias: Range trade → watch VWAP flips 📊
📈 Swing Bias: Bullish above 6,600, bearish below 6,580 🔑
⏳ Patience Key: Avoid chasing breakouts without volume confirmation 📉📊
🧭 Conclusion
The US500 (S&P500) is at a make-or-break zone.
✅ Buy dips near 6,600
❌ Sell rallies into 6,750 – 6,820
🔮 Expect volatility as macro events drive direction
📊 Stay disciplined, trade the levels, and adapt quickly 🚀📉
For individuals seeking to enhance their trading abilities based on the analyses provided, I recommend exploring the mentoring program offered by Shunya Trade. (Website: shunya dot trade)
I would appreciate your feedback on this analysis, as it will serve as a valuable resource for future endeavors.
Sincerely,
Shunya.Trade
Website: shunya dot trade
📝 TRADING CHECKLIST
Before entering any position:
- ✅ Confirm volume supports move
- ✅ Check RSI for divergences
- ✅ Verify multiple timeframe alignment
- ✅ Set stop loss before entry
- ✅ Calculate position size
- ✅ Review correlation with DXY/SPX/US30
- ✅ Check economic calendar
- ✅ Assess market sentiment
⚠️Disclaimer: This post is intended solely for educational purposes and does not constitute investment advice, financial advice, or trading recommendations. The views expressed herein are derived from technical analysis and are shared for informational purposes only. The stock market inherently carries risks, including the potential for capital loss. Therefore, readers are strongly advised to exercise prudent judgment before making any investment decisions. We assume no liability for any actions taken based on this content. For personalized guidance, it is recommended to consult a certified financial advisor.
