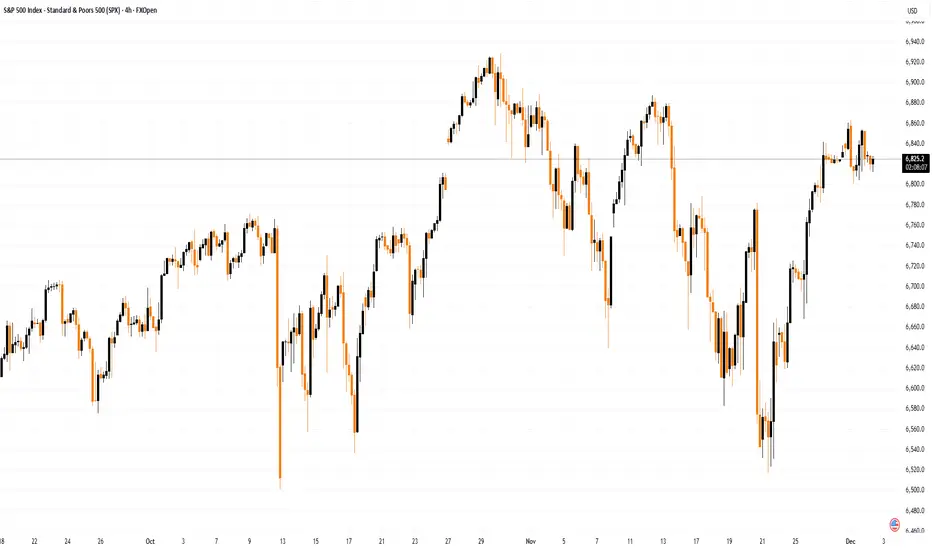
SPX: Investors bet on December's cutDuring Thanksgiving week, markets were in a positive, holiday mood, bringing US equities to higher grounds. The S&P 500 had a five-day positive streak, moving from 6.530 up to 6.850 points on Friday. The mood among investors has shifted again back toward a more risk-on stance, as the market is now about 80% confident that the Fed will cut interest rates at December FOMC meeting. Many stocks included in the index are now trading at new all time highest levels, some of which are General Motors, Hilton Worldwide, Walmart stores.
Tech companies also gained during the previous week, as confidence in AI was restored supported by some promising macro developments. Meta was one of the biggest winners, surging around 9% for the week. Microsoft was traded higher by more than 4%, however, Nvidia continues to lag in gains. Company shares continued to decline, losing around 2% on a weekly basis and highlighting uneven sentiment among the tech sector.
The week ahead brings PCE data for September. This indicator is the Fed's favourite inflation gauge, in which sense, Friday might bring some higher volatility. Nervousness will be increased, considering that these data will be taken into account by FOMC members when voting for a rate cut. On the opposite side, starting with the week ahead, we are entering into the last trading month of the year, when investors are seeking positive sentiment to book yearly profits.
S&P 500 Index
No trades
Trade ideas

S&P500 breakout retest? S&P 500 Trading Summary
Markets started December on weak footing, with risk assets and bonds under pressure. A global rates selloff, triggered by hawkish comments from BoJ Governor Ueda that pushed 10yr JGB yields to post-GFC highs, spilled into the US and Europe. Treasury yields jumped sharply, with the 10yr +7.2bps, its biggest rise in nearly a month.
At the same time, US data disappointed: the ISM manufacturing print took on a stagflationary tone, and higher oil prices amplified inflation concerns. This combination of higher yields + weaker data weighed on equities, leaving the S&P 500 down –0.53%.
Crypto-related volatility added to the risk-off sentiment, with Bitcoin down over 5% and major crypto-linked ETFs suffering steep year-to-date losses, though investor demand for such products remains surprisingly resilient.
On the consumer side, Cyber Monday spending grew more slowly in the US compared to Europe, partly reflecting tariff-driven pressures on US shoppers. While global online spending rose about 5%, the US lagged at 2.6%.
Overall: The session reflected renewed rate fears, stagflation worries, and softening US consumer data, all contributing to a softer tone for the S&P 500.
This communication is for informational purposes only and should not be viewed as any form of recommendation as to a particular course of action or as investment advice. It is not intended as an offer or solicitation for the purchase or sale of any financial instrument or as an official confirmation of any transaction. Opinions, estimates and assumptions expressed herein are made as of the date of this communication and are subject to change without notice. This communication has been prepared based upon information, including market prices, data and other information, believed to be reliable; however, Trade Nation does not warrant its completeness or accuracy. All market prices and market data contained in or attached to this communication are indicative and subject to change without notice.

S&P 500 Index: Early December Chart AnalysisS&P 500 Index: Early December Chart Analysis
December is traditionally a favourable month for the S&P 500 :
→ Since the 1950s, December has ended higher in over 70% of years.
→ Average monthly gain is around +1.0%.
Will the index rise in 2025? Much depends on the Federal Reserve meeting on 10 December, as well as other factors, including geopolitical developments. Interest is also piqued by an upcoming statement from Trump at the White House (today, 22:00 GMT+3), though the topic remains undisclosed.
Technical Analysis of the S&P 500 Chart
Demand-side perspective:
→ The rebound from November’s low was aggressive, rising roughly +5% in 10 days.
→ Price climbed above the blue trendline that has acted as support since summer.
→ The recent dip (marked by the red trajectory) could be a temporary correction, forming a Bull Flag pattern.
Supply-side perspective:
→ The red trajectory has not yet been breached.
→ Recent price movements show a strong bearish Head and Shoulders pattern, along with signs of a Quasimodo formation, emerging around the attempt to break the upper boundary.
In the short term, the former resistance at 6785 may now act as support. Overall, the S&P 500 is likely to adopt a wait-and-see stance, adjusting as economic news, delayed by the government shutdown, is released.
This article represents the opinion of the Companies operating under the FXOpen brand only. It is not to be construed as an offer, solicitation, or recommendation with respect to products and services provided by the Companies operating under the FXOpen brand, nor is it to be considered financial advice.
$SPX — WEEK 49 TREND REPORTSPX — WEEK 49 TREND REPORT
Ticker: SP:SPX — 12/01/2025 @ 6812.63
Timeframe: WEEKLY
This is a reactive structural classification of SPX based on the weekly chart as of this timestamp. Price conditions are evaluated as they stand — nothing here is predictive or forward-assumptive.
⸻
1) Current Trend Condition
• Trend Duration: +2 weeks (bullish)
• Trend Reversal Level ( Origin ): 6,721
• Trend Reversal Level ( Confirmation ): 6,432
⸻
2) Structure Health
Retracement Phase:
• Uptrend (operating above 78.6%)
Position Status:
• Healthy (price above both structural layers)
⸻
3) Temperature: Warming Phase
⸻
4) Momentum: Bullish
⸻
5) Market Sentiment: Bullish
⸻
Author’s Note
This analysis is fully reactive, not predictive. Market conditions, trend structure, and behavior are classified as they appear in real time. The objective is to identify where directional shifts first occurred, where structural integrity remains intact, and where it would begin to weaken if key levels were breached.
Predictive analysis projects outcomes that do not exist yet. Without price confirmation, prediction is built on baseless assumptions. This framework avoids that entirely by responding only to verified structural changes and live conditions.
The levels shown simply identify where the current trend structure first shifted and where it would begin to lose integrity if breached. Recognizing these boundaries allows for clearer interpretation of market behavior without relying on forward guarantees, speculative projections, or unsupported assumptions.
⸻
Methodology Overview
This classification framework evaluates directional conditions using internal trend-interpretation logic that references price behavior relative to its structural layers. These relationships are used to identify when price movement aligns with the framework’s criteria for directional phases, transition points, or regime shifts. Visual elements or structural labels reflect these internal interpretations, rather than explicit trading signals or preset indicator crossovers. This framework is observational only and does not imply future outcomes.

$SPX Break Above Trendline, ATH ComingSPX came down earlier this Asian session, hit my algo bias zone low at 6794 and is now back to trendline resistance. Breaking above and holding above the trendline will bring us to new ATH and 6980.


S&P 500 Technical & Fundamental Outlook — Week of De 1–5 2025Technical Analysis Summary – SPX Compression Structure
SPX is currently trading inside a contracting price formation, defined by a descending resistance trendline from recent highs and a rising support trendline from the early Q4 low. This structure represents a period of market indecision and volatility compression, where buyers and sellers are positioning before a larger directional move.
Key Observations
The upper trendline marks repeated rejection points — this is a clear overhead supply zone.
The lower trendline shows higher lows forming — underlying demand is still present.
Price is compressing toward an apex, and historically, these structures lead to strong expansion once resolved.
Because of this setup, entries inside the wedge are high-risk and low-reward, as price tends to chop and trap both sides until a breakout or breakdown is confirmed.
Bullish Scenario
A bullish continuation requires:
A clean breakout above the descending trendline
A successful pullback that holds as support (higher low)
Continuation momentum
This would indicate that buyers have absorbed supply and are in control. Upside levels then open toward the previous reaction highs, and momentum buyers may accelerate the move.
Bearish Scenario
A bearish continuation is confirmed by:
A breakdown below the rising trendline
A failed retest of that area from below (lower high)
Increase in downside momentum or volume
This would signal that buyers have lost control of the trend, and trapped long positions above could fuel a deeper correction toward prior support levels.
Conclusion
The SPX is coiling inside a clear compression pattern.
The proper approach is to wait for the market to choose direction, then position after confirmation, not before.
This is a breakout-or-breakdown environment — not a place to trade the middle.The Market Is Rallying — BUT The AI Trade Is Fragile
Stocks rebounded hard this past week after the biggest pullback since April, mainly because:
Markets believe the Fed will cut in December (rate-cut odds jumped to 80%+).
BUT:
Mega-cap AI names remain volatile.
AI profitability narrative is being challenged.
This is the key line in the sand for SPX right now:
AI spending is massive, but profits are not yet confirmed.
That’s the reason NVDA + GOOGL are whipping around so violently.
⚠️ 2. The Narrative Shift You Must Watch
The market is shifting from "AI growth" → "AI returns".
Matthew Maley (Miller Tabak):
“The narrative surrounding the profitability of AI is coming under question.”
Translation for traders:
No longer enough to say “AI spending”.
Now the market wants proof of revenue + margins.
If that narrative worsens → SPX pressure.
This week was a warning shot:
Alphabet mooning on Gemini 3 news → “AI winner” narrative
Meta possibly buying Google chips → hurts NVDA
Semis shook → volatility in the core leadership names
If NVDA becomes an AI CAPEX victim instead of the bottleneck supplier → the entire AI bull leg changes.
📉 3. Bitcoin’s Slide = Waning Risk Appetite
Bitcoin fell from $125k → under $90k.
King Lip (BakerAvenue):
“Bitcoin serves as a risk proxy for equities.”
This matters because:
SPX often peaks when BTC momentum dies.
Risk is shifting from growth/AI → defensives/small caps.
Crypto weakness = risk appetite fading.
📈 4. SPX Context — This Is NOT a Crash, It’s a “Narrative Test”
SPX is +16% YTD heading into a historically strong window.
December is the 3rd-best month since 1950 (avg +1.43%)
Market is still at the ceiling:
SPX is only ~1% below its October ATH
Nasdaq is ~3% off its high
This is not bearish selling.
This is positioning + narrative testing.
🧠 5. What Is Hurting Tech Right Now
Two forces:
A. Timing of monetization
Companies spent hundreds of billions on training + infra.
But when do earnings arrive?
Nobody knows.
Paul Nolte:
“Investors are rethinking how quickly this will hit bottom lines.”
This is the heart of the SPX risk.
B. Tech Debt Issuances
Big AI names issued heavy debt to fund expansion.
This scares valuation models.
When the “future promises” trade meets balance sheet reality → rotations begin.
💵 6. Fed Cuts: The Bullish Counterweight
Traders now price:
80%+ odds of a December rate cut
This is huge because:
Cuts expand breadth in the SPX
Small caps, cyclicals, value names get oxygen
This is the exact reason SMID outperformed this week.
Anthony Saglimbene:
“What I’m watching is if rate cuts bring momentum outside of tech.”
This is literally the rotation we’ve been waiting for.
🏭 7. Macro Ahead — SPX Sensitivity
Next week will hit:
Manufacturing ISM
Services ISM
Consumer sentiment
CRM, DLTR, KR earnings (consumer health)
Holiday retail performance (Black Friday / Cyber Monday)
👉 But note: many core economic releases were delayed or cancelled due to the 43-day government shutdown.
Saglimbene:
“Investors will have to deal with the fog.”
This creates high headline volatility on SPX going into January.
🔑 8. THE REAL TAKEAWAY FOR SPX & NDX TRADERS
This is no longer a hype-cycle AI rally.
You must trade:
Earnings
Margin guidance
Capex-to-revenue timing
🎯 AI → cost center (now)
🎯 AI → profit engine (unknown)
As long as that uncertainty persists,
➡️ volatility in NVDA, AAPL, GOOG, MSFT, META remains
➡️ SPX stays sensitive at the highs
🧨 Trader-Level Summary (no commentator BS)
Bullish forces
Fed rate cut probability exploding higher
Seasonality (December = historically strong)
Market breadth improving beyond megacaps
Bearish forces
Bitcoin risk proxy collapsing
AI spending profitability questioned
Mega-cap tech debt issuance
“Infra first, profits later” fear
🔥 HOW TO TRADE THIS (S&P Focused)
Watch these 3 things every day:
1️⃣ NVDA price action
If NVDA cracks ↓ → SPX loses leadership.
2️⃣ Alphabet’s Gemini 3 momentum
If Gemini models take market share:
→ NVDA supply chain narrative fractures
→ Rotation to CPUs/TPUs → hurting semis
3️⃣ Bitcoin risk proxy
BTC < $90k = risk appetite unwinding
🏁 ONE SENTENCE THAT MATTERS
SPX is still bullish, but leadership is no longer unquestioned — AI profitability and risk appetite are now the drivers, not AI hype.

S&P500 Index Goes "Hanging Man" Due To Mixed Monthly ReturnsHanging man pattern is a single-candle bearish reversal signal that appears after an uptrend and warns that selling pressure is starting to emerge, even if the candle closes bullish.
For the S&P 500 November 2025 monthly candle, current data show a shallow pullback within an ongoing uptrend rather than a textbook hanging man, so any bearish implication is weak and unconfirmed.
What a hanging man is
A hanging man is a one-candle pattern that appears after a price advance and has a small real body near the top of the range, a long lower shadow (typically at least twice the body), and little or no upper shadow. It signals that sellers were strong intramonth (long lower wick) but buyers managed to push price back up by the close, creating a warning of potential trend exhaustion that must be confirmed by a subsequent bearish candle or downside break.
Key points for a valid hanging man on a higher timeframe such as a monthly chart are:
Clear prior uptrend into the candle.
Small body near the high, long lower shadow, minimal upper shadow.
Bearish confirmation the next bar (lower close or break of the low).
S&P 500 November 2025 monthly candle
Available November 2025 data show that the S&P 500 spent most of the month near recent highs after breaking above the 6,800 area, with the broader structure still strongly bullish into year-end 2025. While there was some downside volatility, the monthly action is better characterized as a modest pullback or consolidation after a strong advance than a classic hanging man with a pronounced long lower shadow and tiny body at the top of the range.
Several technical commentaries into late November and early December focus on resistance, overbought readings, and risk of correction, but they do not highlight a confirmed monthly hanging man or other completed exhaustion signal for 2025. One analysis even notes that a specific type of monthly exhaustion pattern is not yet in place for 2025, implying that the major trend remains intact despite short‑term risks.
Bearish technical perspectives from here
Even without a textbook monthly hanging man, there are credible bearish technical scenarios because the index is extended and pressing important resistance zones, meaning a confluence of resistance near high Fibonacci retracement levels, overbought momentum (elevated RSI), and key moving average and trendline tests as areas where a failure could trigger a correction.
Market breadth remains weak
In a short, in the year 2025 there're still no any new 52-week highs for major indices that count number of stocks above 200-Day average, like INDEX:MMTH , INDEX:NCTH , INDEX:R1TH , INDEX:S5TH and so on.
Potential bearish follow‑through in coming months generally centers on:
A failure to sustain above current resistance bands, leading to a pullback toward roughly the 5400 – 5000 region that aligns with prior supports and Fibonacci levels.
Rising volatility around macro catalysts such as inflation data and Federal Reserve policy decisions, which could accelerate downside if the index breaks below short‑term support and recent uptrend lines.
Overall, the S&P 500 remains in a longer‑term uptrend into late 2025, and any hanging‑man‑like monthly candle would be treated as an early warning, not a standalone sell signal; bears still need confirmation via a decisive break of support and a sequence of lower highs and lower lows on weekly and daily charts.

More upside for SPX500USDHi traders,
Last week SPX500USD went up again just as I've said in my previous outlook.
Next week we could see a correction down and more upside for this pair.
Let's see what the market does and react.
Trade idea: Wait for a correction down. After a change in orderflow to bullish you could trade longs.
This shared post is only my point of view on what could be the next move in this pair based on my technical analysis.
But I react and trade on what I see in the chart, not what I've predicted or expect.
Don't be emotional, just trade your plan!
Eduwave

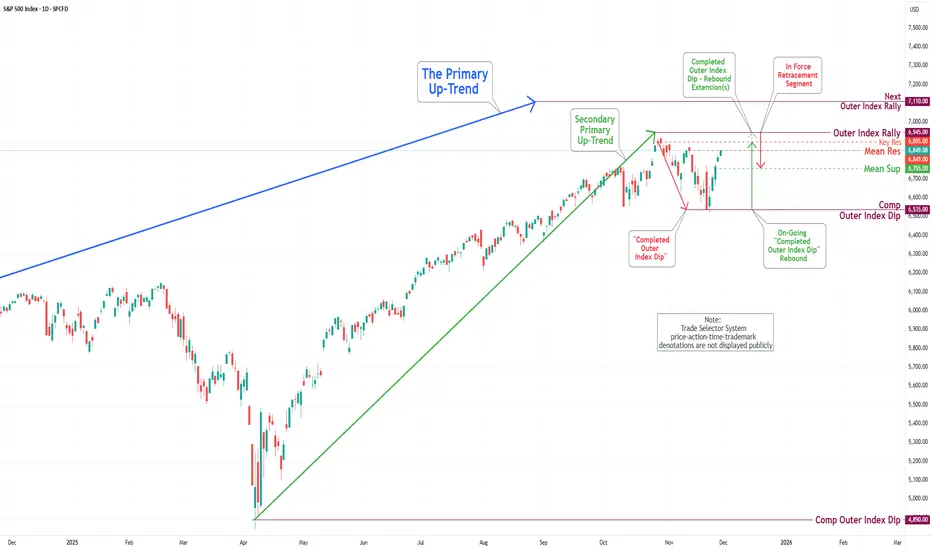
S&P 500 Daily Chart Analysis For Week of Nov 28, 2025Technical Analysis and Outlook:
In this abbreviated weekly trading session, influenced by a significant U.S. holiday and a cooling issue at the CyrusOne data centers at CME, the S&P 500 Index posted notable gains, reaching our primary target, the Mean Resistance at 6,849.
At present, this position suggests the potential for further upward movement, with primary targets established for a continuation of the robust trend toward Key Resistance at 6,895, followed by an extended target identified as the Outer Index Rally at 6,945.
Nevertheless, it is crucial to recognize that, given the prevailing market dynamics, there exists a considerable likelihood of an In-Force pullback from the aforementioned price targets.
SP500 Bullish Divergence Detected (SPY)Bullish divergence of the SP500 and NYSE Advance Decline Line (ADL) is one of the most powerful and reliable "leading" indicators available. Here we see the ADL make a new high (a higher high) while the SP500 does not make a new high. This divergence indicates that market breadth is markly improving, which will ultimately drive the SP500 up to new all time highs in the coming weeks or months.
I am well aware of discussions about bubble fears and valuation concerns. It's important to note that the market can continue to increase for some time even with these concerns, so it would be a mistake to get out of or short the market at this time. Also, the technicals are pointing higher, not lower.
As long as this train keeps chugging, we should stay on this ride! Go long on SPY, VOO, QQQ!!!

S&P500 idea of how the market might move the coming months.After creating a double top, I expected a head & shoulder pattern to form but we got a double top instead and due to macro situations and debt problems world wide after pumping so hard I expect huge corrections in the markets.
Most likely a everything bubble that will burst due to high leverage trades over many years.
We will also see a huge bank crisis start when all this unfolds.
Better buckle up!

SPX to 6861 watch for vwap rejection and a liquidity grabPretty clear your going to form your bull flag in this inverse or break down into a lower one vwap is a good pivot and wathcing point

ABC or C?We reached the 18ma. I'm not sure if we just corrected the large upmove or if we will continue to drop. It looks a lot like a smaller ABC as of now. The 18ma and horizontal line at 6780 area are both strong support. The VIX is at resistance here, but a break above 18 and especially 20 would be significant. I talk about a few trades as well.

Trading Seasonality: When the Calendar Matters More Than NewsTrading Seasonality: When the Calendar Matters More Than News
Markets move not just on news and macroeconomics. There are patterns that repeat year after year at the same time. Traders call this seasonality, and ignoring it is like trading blindfolded.
Seasonality works across all markets. Stocks, commodities, currencies, and even cryptocurrencies. The reasons vary: tax cycles, weather conditions, financial reporting, mass psychology. But the result is the same — predictable price movements in specific months.
January Effect: New Year, New Money
January often brings growth to stock markets. Especially for small-cap stocks.
The mechanics are simple. In December, investors lock in losses for tax optimization. They sell losing positions to write off losses. Selling pressure pushes prices down. In January, these same stocks get bought back. Money returns to the market, prices rise.
Statistics confirm the pattern. Since the 1950s, January shows positive returns more often than other months. The Russell 2000 index outperforms the S&P 500 by an average of 0.8% in January. Not a huge difference, but consistent.
There's a catch. The January effect is weakening. Too many people know about it. The market prices in the pattern early, spreading the movement across December and January. But it doesn't disappear completely.
Sell in May and Go Away
An old market saying. Sell in May, come back in September. Or October, depending on the version.
Summer months are traditionally weaker for stocks. From May to October, the average return of the US market is around 2%. From November to April — over 7%. Nearly four times higher.
There are several reasons. Trading volumes drop in summer. Traders take vacations, institutional investors reduce activity. Low liquidity amplifies volatility. The market gets nervous.
Plus psychology. Summer brings a relaxed mood. Less attention to portfolios, fewer purchases. Autumn brings business activity. Companies publish reports, investors return, money flows back.
The pattern doesn't work every year. There are exceptions. But over the past 70 years, the statistics are stubborn — winter months are more profitable than summer.
Santa Claus Rally
The last week of December often pleases the bulls. Prices rise without obvious reasons.
The effect is called the Santa Claus Rally. The US market shows growth during these days in 79% of cases since 1950. The average gain is small, about 1.3%, but stable.
There are many explanations. Pre-holiday optimism, low trading volumes, purchases from year-end bonuses. Institutional investors go on vacation, retail traders take the initiative. The mood is festive, no one wants to sell.
There's interesting statistics. If there's no Santa Claus rally, the next year often starts poorly. Traders perceive the absence of growth as a warning signal.
Commodities and Weather
Here seasonality works harder. Nature dictates the rules.
Grain crops depend on planting and harvest. Corn prices usually rise in spring, before planting. Uncertainty is high — what will the weather be like, how much will be planted. In summer, volatility peaks, any drought or flood moves prices. In autumn, after harvest, supply increases, prices fall.
Natural gas follows the temperature cycle. In winter, heating demand drives prices up. In summer, demand falls, gas storage fills, prices decline. August-September often give a local minimum. October-November — growth before the heating season.
Oil is more complex. But patterns exist here too. In summer, gasoline demand rises during vacation season and road trips. Oil prices usually strengthen in the second quarter. In autumn, after the summer peak, correction often follows.
Currency Market and Quarter-End
Forex is less seasonal than commodities or stocks. But patterns exist.
Quarter-end brings volatility. Companies repatriate profits, hedge funds close positions for reporting. Currency conversion volumes surge. The dollar often strengthens in the last days of March, June, September, and December.
January is interesting for the yen. Japanese companies start their new fiscal year, repatriate profits. Demand for yen grows, USD/JPY often declines.
Australian and New Zealand dollars are tied to commodities. Their seasonality mirrors commodity market patterns.
Cryptocurrencies: New Market, Old Patterns
The crypto market is young, but seasonality is already emerging.
November and December are often bullish for Bitcoin. Since 2013, these months show growth in 73% of cases. Average return is about 40% over two months.
September is traditionally weak. Over the past 10 years, Bitcoin fell in September 8 times. Average loss is about 6%.
Explanations vary. Tax cycles, quarterly closings of institutional funds, psychological anchors. The market is young, patterns may change. But statistics work for now.
Why Seasonality Works
Three main reasons.
First — institutional cycles. Reporting, taxes, bonuses, portfolio rebalancing. Everything is tied to the calendar. When billions move on schedule, prices follow the money.
Second — psychology. People think in cycles. New year, new goals. Summer, time to rest. Winter, time to take stock. These patterns influence trading decisions.
Third — self-fulfilling prophecy. When enough traders believe in seasonality, it starts working on its own. Everyone buys in December expecting a rally — the rally happens.
How to Use Seasonality
Seasonality is not a strategy, it's a filter.
You don't need to buy stocks just because January arrives. But if you have a long position, seasonal tailwind adds confidence. If you plan to open a short in December, seasonal statistics are against you — worth waiting or looking for another idea.
Seasonality works better on broad indices. ETFs on the S&P 500 or Russell 2000 follow patterns more reliably than individual stocks. A single company can shoot up or crash in any month. An index is more predictable.
Combine with technical analysis. If January is historically bullish but the chart shows a breakdown — trust the chart. Seasonality gives probability, not guarantee.
Account for changes. Patterns weaken when everyone knows about them. The January effect today isn't as bright as 30 years ago. Markets adapt, arbitrage narrows.
Seasonality Traps
The main mistake is relying only on the calendar.
2020 broke all seasonal patterns. The pandemic turned markets upside down, past statistics didn't work. Extreme events are stronger than seasonality.
Don't average. "On average, January grows by 2%" sounds good. But if 6 out of 10 years saw 8% growth and 4 years saw 10% decline, the average is useless. Look at median and frequency, not just average.
Commissions eat up the advantage. If a seasonal effect gives 1-2% profit and you pay 0.5% for entry and exit, little remains. Seasonal strategies work better for long-term investors.
Tools for Work
Historical data is the foundation. Without it, seasonality is just rumors.
Backtests show whether a pattern worked in the past. But past doesn't guarantee future. Markets change, structure changes.
Economic event calendars help understand the causes of seasonality. When quarterly reports are published, when dividends are paid, when tax periods close.
Many traders use indicators to track seasonal patterns or simply find it convenient to have historical data visualization right on the chart.


How To Decide Short Trade In US500 IndexThis video explains how we decide a short trade in the US500 index by observing price behavior and market structure. The analysis focuses on how the US500 reacted from a defined supply zone, how momentum shifted, and what signals indicated a potential downside move. The goal of this breakdown is to show the process of identifying structure, reaction points, and momentum changes using pure price action.
This content highlights how supply zones, rejection behavior, and momentum alignment can help understand possible short-side opportunities—purely from an educational and analytical perspective, without offering any trading advice.

The Bull Is At The Gate, Already!I see lots of liquidity swept last month.
Then, November finishes with this bullish pin-bar.
The momentum remains with bulls.
Fundamentals & divergences in the rhetoric:
Labour market FED says is the weak point in the US economy,
Inflation projected to be tamed even by Tariffs,
* Jobs are created on a strong Stock market, in a lowering interest rate environment.
FED 10th Nov. says January cut unlikely.
But to improve jobs growth & affordability of household expenses for the unemployed / low income people, January cut rhetoric divergence, IE. more chance of occurring supporting stocks.
But and hold investors may be seeing a bottom finally.
Finally, USD is winding back on a bearish MTOP on daily chart which I earlier in the week said could easily retrace at a burst to parity & park at its 200 MA. Causing inflows of safe haven buying.
It didn’t happen with the DXY & is sucked lower opening the gates for GBPUSD, EURUSD & AUSUSD , EURUSD is the bull & let’s see if I’m right and the 1.1920 breakout zone is triggered.
Disclaimer : I’m currently long in EURUSD
and AUDUSD and the S&P, Google & Walmart.
The above is only my interpretation & mistakes can be made. So it’s not investment advice.
Researched & written exclusively by MusicalNight (Chris)

Fed cuts rates. Where do we go next?Rate cut of 25bps as expected but where do we go from here?
The S&P is attempting to break out into new all time highs but as we’ve seen recently, there doesn’t seem to be enough buy side liquidity or buyer conviction to push the market into a new leg up. Until we see a catalyst to take it higher I would expect more chop.

US500: The J-WOW-POWOW — Anatomy of an FOMC ShakeoutThe Market's Breath
The air is thick with anticipation. We stand 90 minutes away from the FOMC decision. The consensus? Rate cuts. The retail sentiment? Euphoria. But the Limitless Trader knows that when the crowd looks up, the smart money is often preparing to pull the rug.
This is what I call the J-WOW-POWOW. A double-edged sword of volatility designed to transfer wealth from the impatient to the strategic.
The Philosophy: Buy the Rumor, Sell the News
Why would the market dump on good news? Because, quite simply, it is already priced in. The charts have been whispering this bullish thesis for weeks. Now that the confirmation is here, it is time for profit-taking.
Let the institutions speak as to where the price will go eventually.
The Setup: The Shakeout & The Reload
We are looking at a classic "Flush and Rush" scenario.
The Short (The Flush): As the news hits, we expect an initial liquidity grab. We are eyeing a rejection around the 6850 region. This is where the bag holders are created—buying the breakout that isn't real.
The Target: We anticipate a swift move down to test the 6670 zone. This is the "shakeout"—clearing the board of weak hands.
The Long (The Reload): Once the dust settles and the tourists have left the casino, we look for the real move. Support at 6670 offers a pristine entry to ride the trend back up toward 6930.
Technical Parameters (Approximations):
Short Play:
Entry: ~6850
Stop Loss: 6930
Take Profit: 6670
Long Play:
Entry: ~6670
Stop Loss: 6585
Take Profit: 6930
I am not your mother or your father. Sit on the sidelines and watch the show, or engage the market with discipline. The choice, and responsibility, is as always, yours.
LET ME EMPHASIZE AGAIN! THIS IS FOR YOU TO EDUCATE YOURSELF. I NEVER COPY TRADE. WHEN YOU COPY TRADE, YOU LACK THE CONVICTION, THE EXPERIENCE, AND THE KNOW-HOW ON MANAGING AN ACTIVE TRADE. NO ONE WILL BE HOLDING YOUR HAND WHILE YOU TRADE.
Disclaimer: This is not financial advice. It is for educational and informational purposes only. Please conduct your own research and manage your risk accordingly.

US500 Awaits Fed Decision Near Record HighThe US500 (S&P 500) hovers just below its record high as market participants anticipate the upcoming monetary policy decision from the Fed. The index's flattening price action reflects a cautious but broadly bullish sentiment.
The US500 last closed near 6,840, losing about 0.1% on the day. This slight movement keeps the index less than 1% below its recent peak near 6,895. Over the 12-month period, the index shows a robust trend, advancing about 13 -14%.
Sentiment remains largely positive, though investors adopt a 'wait-and-see' approach ahead of the imminent Fed meeting. Markets are currently pricing in a high probability of another rate cut. Investor optimism for US equities is at its highest in about 1-year, fuelled by expectations of easier policy and liquidity. However, caution persists due to high valuations and concentration in large cap stocks.
Technically, the US500 remains in an uptrend, trading well above key moving averages. The short-term rally is losing momentum as the price tests the resistance at 6,895. The nearest support is the 6,800-6,815 range.
Consolidating above the 6,800-6,815 support may prompt the US500 to retest the next target at 6,895. Conversely, a break below the 6,800-6,815 range could lead the US500 to test the subsequent support at 6,750.
Analysis by Terence Hove, Senior Financial Markets Strategist at Exness.

S&P500 pullback as inflation risks remain tilted to the upsideThe S&P 500 fell 0.35%, snapping a four-day winning streak, as hawkish ECB commentary from Isabel Schnabel pushed global yields higher and weighed on risk appetite. Schnabel signalled comfort with expectations for another rate hike, warned that inflation risks remain tilted to the upside, and suggested the neutral rate may be rising due to AI and public investment. In response, euro overnight index swaps for Dec-2026 rose 8bps, contributing to the broader risk-off tone.
Equity losses in the US were broad-based, with 10 of 11 sectors lower, led by communication services (-1.77%) and materials (-1.66%). The Magnificent 7 fell 0.91% for its worst session in over two weeks, although semiconductors outperformed, helped by Nvidia (+1.72%). Despite the decline, the index remains less than 1% below its late-October record high, but momentum clearly cooled as yields climbed.
In after-hours trade, Nvidia gained a further ~2% after Donald Trump approved sales of its H200 AI chip to China, subject to a 25% government surcharge and sales only to “approved customers”—a potentially significant earnings tailwind if Chinese buyers are ultimately permitted to proceed.
This communication is for informational purposes only and should not be viewed as any form of recommendation as to a particular course of action or as investment advice. It is not intended as an offer or solicitation for the purchase or sale of any financial instrument or as an official confirmation of any transaction. Opinions, estimates and assumptions expressed herein are made as of the date of this communication and are subject to change without notice. This communication has been prepared based upon information, including market prices, data and other information, believed to be reliable; however, Trade Nation does not warrant its completeness or accuracy. All market prices and market data contained in or attached to this communication are indicative and subject to change without notice.

