S&P 500 (SPX) Technical Outlook Moving Forward Overview
The S&P 500 remains in a clear upward trajectory despite last Friday’s sharp selloff. The drop was largely imminent after a historic rally from the April tariff lows, with the index marking consecutive all-time highs before facing resistance at the upper boundary of the long-term ascending channel that has guided price action since 2021. While the broader trend remains intact, the recent rejection signals a potential shift in market dynamics, suggesting that momentum may be cooling. Moving forward, the environment appears more balanced between opportunity and risk, as active traders we should approach it with flexibility and an open mindset.
Key Scenarios
1. Scenario 1 – 15% Correction (Bearish Pullback)
• Target: 5673 - 2024 ATH
• This scenario represents a deeper, healthy correction following the parabolic move from 2023 to 2025.
• It aligns with the lower boundary of the long-term trend channel and prior support zones.
• A move of this scale would likely be triggered by macro tightening, earnings contraction, or a geopolitical shock.
2. Scenario 2 – 10% Correction (Healthy Pullback)
• Target: 6,147 - 2025 ATH
• A milder correction that would bring SPX back toward the February 2025 ATH region.
• This would reset market sentiment from current greed levels without breaking the broader bullish structure.
• It’s the most probable near-term scenario if momentum stalls below the 7,000 mark.
3. Scenario 3 – Euphoria and Extreme Greed (Bullish Extension)
• Target: 7,000+ (psychological level)
• If risk appetite remains strong and macro data stays resilient, the SPX could extend higher into an overbought “euphoria phase.”
• This would likely form a short-term blow-off top before a correction later in 2026.
Conclusion
The S&P 500 remains structurally bullish, but risk-reward is increasingly skewed to the downside in the short term.
• Key resistance: 7,000 psychological level
• Key supports: 6,150 (10% correction) and 5,670 (15% correction)
Remain cautious of potential exhaustion above current highs however long-term investors and trend followers can remain constructive as long as the price respects the ascending channel.
Good luck !
Ghost
Trade ideas

SPX 500 extends recovery as traders watch US-China situationAfter breaking above 6677 yesterday, the S&P 500 created a higher high on the intraday charts, and so today's gains were a continuation of that move. But the index has now arrived into the next potential resistance area between 6720-6740, which was a key short-term support zone before the breakdown we saw on Friday. Could we see some volatility around this zone now?
Risk appetite returned overnight, with US index futures climbing to new weekly highs, even though European markets showed a more mixed performance. In currencies, the US dollar index retreated against most major peers, surrendering part of its recent gains. Market sentiment this week reflects a cautious blend of optimism and restraint. Expectations for Federal Reserve rate cuts remain the key driver, underpinning risk appetite even as gold extends its record-breaking rally beyond $4,200.
Investors appear largely unfazed by renewed US–China trade tensions, brushing off President Trump’s latest warning on cooking oil imports. Meanwhile, solid US bank earnings have bolstered confidence in corporate resilience, keeping equities supported despite the ongoing US government shutdown. Adding to the upbeat tone this morning, French political tensions eased after Prime Minister Sébastien Lecornu announced a delay to his contentious pension reform plan.
But with the US-China tensions back at the forefront, could investors start taking profits on their long equity trades to cause a bit of selling pressure now?
by Fawad Razaqzada, market analyst with FOREX.com

Bulls fight back but bearish signals lingerRecent mixed price and momentum signals on the S&P 500 suggest traders should keep an open mind on whether to play the index from the long or short side in the near term.
For the bulls, the strong bounce from a zone comprising the 50-day moving average and May 23 uptrend over the past two sessions suggests the buy-the-dip trade remains alive despite Friday’s sharp pullback, pointing to the potential for an eventual retest of the record high at 6766.
However, bearish divergence with RSI (14) raises questions about the sustainability of the move, especially with MACD having already crossed the signal line from above before proceeding to trend lower. Bullish momentum is weakening, not building, likely keeping bears interested for the moment.
For those looking to play the index from the long side, there are few setups worth considering. If we were to see a break above 6700 resistance, longs could be established above the level with a stop below, targeting the record high of 6766 initially. Alternatively, another pullback and bounce from the 50DMA/May uptrend support zone would provide a decent entry level, allowing for longs to be set with a stop below for risk management purposes. Potential targets include Tuesday’s high, 6700 or 6766.
For the bears, a failure to clear 6700 resistance would create a short setup, allowing for trades to be established beneath the level with a stop above for protection. The 50DMA/May uptrend support zone screens as a logical initial target, with 6500 and 6360 other options after that.
Good luck!
DS

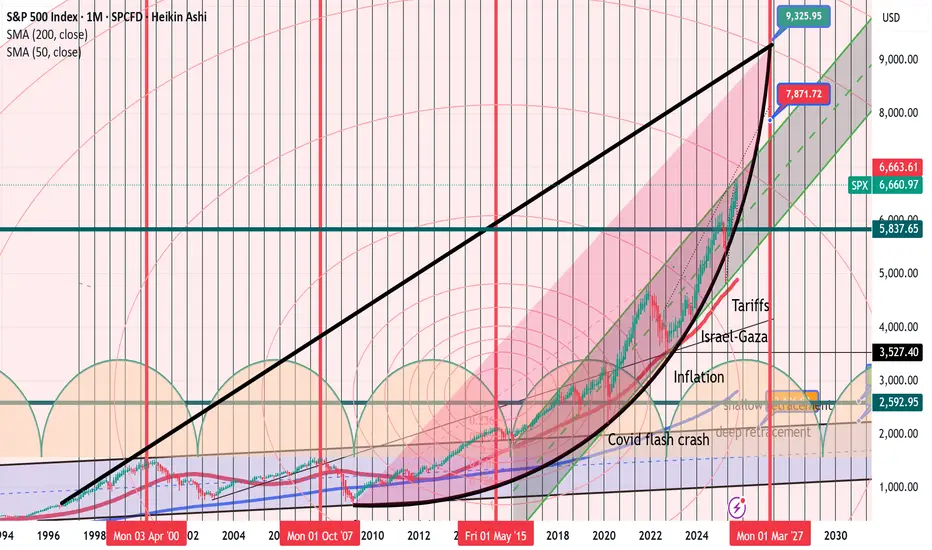
Small fish follow the streamUpdate: My best case scenario. 9000 points in a massive bull run that started in 2009. Hyperbolic move since then.
Top in March 2027
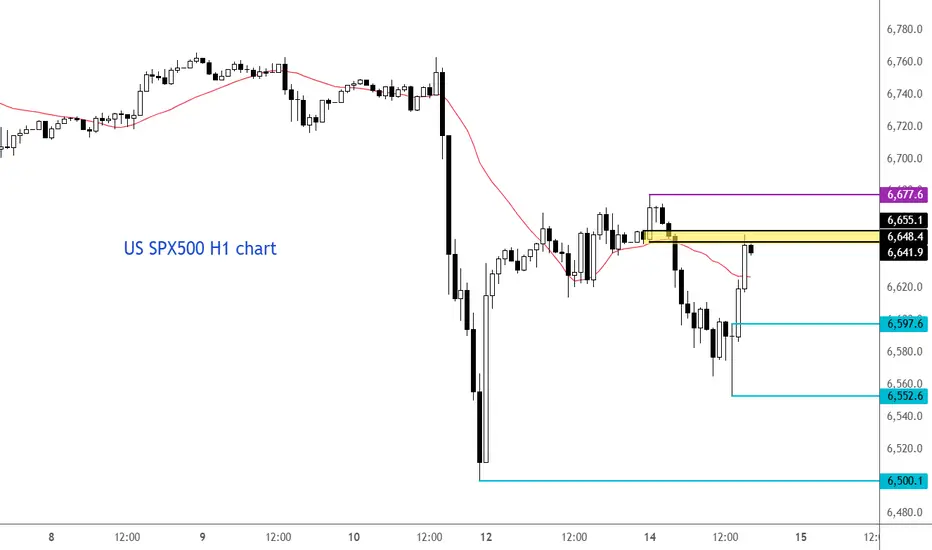
S&P 500 testing resistance after bouncing off lowsMarkets recovered sharply from their earlier lows on the back of comments from US Trade Representative Jamieson Greer, who told CNBC that Donald Trump was still set to meet Chinese premier Xi Jinping. But it remains to be seen whether the US and China will come to some sort of an agreement, perhaps an extension of the tariff truce. That scenario looks more likely than a complete breakdown into a full-blown trade war. However, the risks are undeniably rising.
Anyway, the SPX500 is now testing key resistance here between 6648 to 6655, marked in yellow on the chart. Unless it goes on to make a higher high above 6677 on this hourly chart, and hold above it, there is still the risk we could see another dip as we head deeper in the US session.
By Fawad Razaqzada, market analyst with FOREX.com
S&P 500 The Bull Run Is Over. Watch the Yellow Level.The S&P 500 rally looks exhausted.
Over the past week, momentum has clearly faded, lower highs, weaker daily closes, and stronger selling pressure on each bounce.
Technically, the market shows early signs of a shift from bullish to corrective or bearish.
The Yellow Level acts as a divider between a mildly bullish market and the start of a medium-term bearish phase.
Above the Yellow Level: price may hold short-term strength or consolidation.
Below the Yellow Level: structure breaks down and downside potential expands.
A daily close below the Yellow Level would confirm the beginning of a broader bearish move.
In my view i suggest all the Trader/Investor which they are reading this to stay AT LEAST 80/90% IN CASH. something is about to happen... stay safe!

S&P500 - best three-day gain since MayThe S&P 500 heads into today’s session on firm footing after posting its best three-day gain since May (+2.62%), buoyed by optimism around a potential Trump–Xi trade breakthrough and upbeat momentum across tech and semiconductor stocks.
Investor focus is turning to a pivotal week packed with catalysts: four major central bank meetings, a wave of big-tech earnings (starting tomorrow with Microsoft, Meta, and Alphabet), and the anticipated Trump–Xi meeting on Thursday. Market sentiment was bolstered by Trump’s comments suggesting progress toward a deal and even a possible resolution on TikTok, reviving hopes of easing US–China tensions.
The S&P 500 (+1.23%) and Nasdaq Composite (+1.86%) both hit new highs yesterday, driven by strong performance in trade-sensitive and AI-linked names. The Philadelphia Semiconductor Index (+2.74%) led gains, helped by Qualcomm’s +11% surge on new chip news and reports of a $1bn AI partnership between the US Department of Energy and AMD. Nvidia and other mega-cap tech stocks also rallied, pushing the Mag-7 index up +2.6%, its best single-day gain in five months.
On the rates side, the front end of the Treasury curve sold off (2yr +1.0bps) amid risk-on sentiment, while longer maturities rallied (10yr -2.2bps, 30yr -4.1bps), suggesting markets still expect monetary easing ahead. US equity futures are flat this morning, indicating a pause as traders await consumer confidence data and more corporate earnings before the next leg higher.
Bottom line:
Momentum in the S&P 500 remains positive, supported by AI and trade optimism, but with major catalysts still ahead this week, near-term direction will likely hinge on upcoming tech earnings and central bank guidance.
Key Support and Resistance Levels
Resistance Level 1: 6904
Resistance Level 2: 6924
Resistance Level 3: 6950
Support Level 1: 6832
Support Level 2: 6806
Support Level 3: 6784
This communication is for informational purposes only and should not be viewed as any form of recommendation as to a particular course of action or as investment advice. It is not intended as an offer or solicitation for the purchase or sale of any financial instrument or as an official confirmation of any transaction. Opinions, estimates and assumptions expressed herein are made as of the date of this communication and are subject to change without notice. This communication has been prepared based upon information, including market prices, data and other information, believed to be reliable; however, Trade Nation does not warrant its completeness or accuracy. All market prices and market data contained in or attached to this communication are indicative and subject to change without notice.

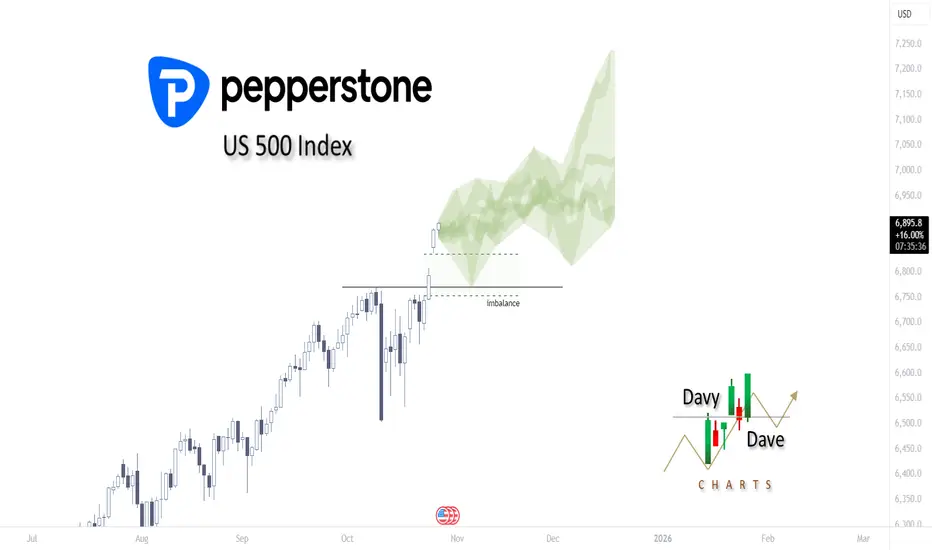
What does history say about the rest of this year?Taking a look at the US 500 Index and plotting the Late October to mid-December highs and lows on post-election year performances, the next two months are looking very bullish. PEPPERSTONE:US500 AMEX:SPY SP:SPX AMEX:VOO
SPX500 H4 | Potential Bearish ReversalS&P500 is reacting off the sell entry at 6,888.42, which aligns with the 100% Fibonacci projection and could reverse from this level to the take profit.
Stop loss is at 6,950, whic is a swing high resistance level.
Take profit is at 6,761.08, which is a pullback support that aligns with the 38.2% Fibonacci retracement.
Stratos Markets Limited (tradu.com ):
CFDs are complex instruments and come with a high risk of losing money rapidly due to leverage. 68% of retail investor accounts lose money when trading CFDs with this provider. You should consider whether you understand how CFDs work and whether you can afford to take the high risk of losing your money.
Stratos Europe Ltd (tradu.com ):
CFDs are complex instruments and come with a high risk of losing money rapidly due to leverage. 70% of retail investor accounts lose money when trading CFDs with this provider. You should consider whether you understand how CFDs work and whether you can afford to take the high risk of losing your money.

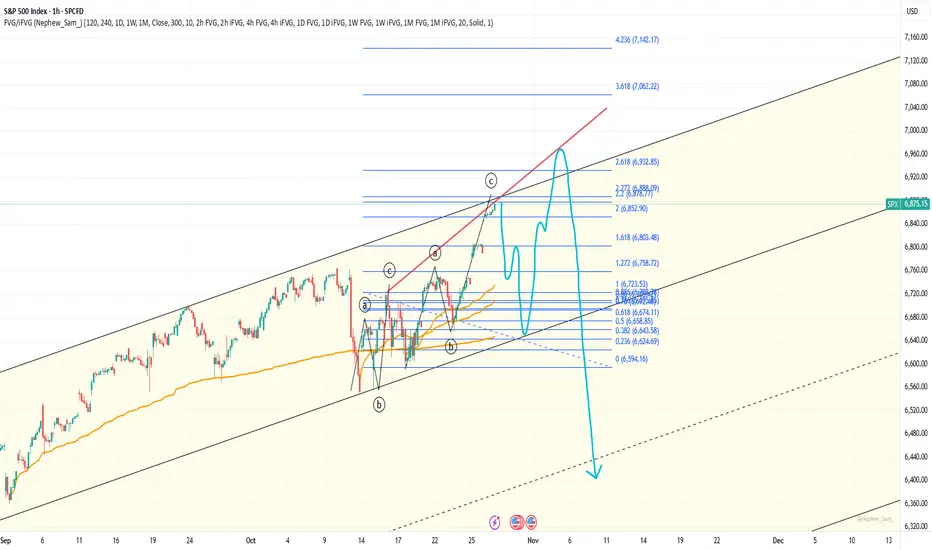
Ending expanding diagonal scenarioJust a possible scenario. If I'm right, wave 3 ends here, and wave 4 correction should start very soon.
IMF’s Crucial Role in the Global EconomyIntroduction
The International Monetary Fund (IMF) stands as one of the most influential international financial institutions in the world. Established in 1944, it has played a pivotal role in maintaining global monetary stability, providing financial assistance to countries in distress, and shaping the world’s economic policies. Over the decades, the IMF has evolved from a post-war reconstruction tool into a global financial watchdog that guides nations through crises, fosters economic cooperation, and promotes sustainable development. Its crucial role is rooted in the principles of global economic interdependence, stability, and inclusive growth.
Historical Background and Foundation
The IMF was conceived during the Bretton Woods Conference in July 1944, held in New Hampshire, USA. This conference was attended by representatives of 44 nations who sought to rebuild the international economic order after the devastation of World War II. The primary architects, John Maynard Keynes from Britain and Harry Dexter White from the United States, envisioned a system that would ensure exchange rate stability and prevent the kind of competitive devaluations and trade barriers that contributed to the Great Depression.
The IMF officially came into existence on December 27, 1945, with 29 member countries signing its Articles of Agreement. Its initial mission was to oversee the fixed exchange rate system and provide short-term balance of payments assistance. Over time, as the world economy evolved—especially after the collapse of the Bretton Woods system in 1971—the IMF adapted its functions to address new global challenges.
Objectives of the IMF
The IMF’s mandate, as outlined in its Articles of Agreement, revolves around several key objectives:
Promoting International Monetary Cooperation – The IMF provides a forum for consultation and collaboration on international monetary issues among its 190+ member countries.
Ensuring Exchange Rate Stability – It aims to maintain stable exchange rates and prevent competitive devaluations that can destabilize trade and investment flows.
Facilitating Balanced Growth of Trade – The IMF works to promote the expansion of international trade, which contributes to economic growth and employment.
Providing Financial Assistance – It extends financial resources to member countries facing balance of payments problems, enabling them to stabilize their economies.
Reducing Global Poverty – Through concessional lending and structural reform programs, the IMF seeks to alleviate poverty, especially in developing nations.
These objectives make the IMF not just a lender of last resort but a central institution for economic governance, coordination, and stability.
Structure and Governance
The IMF’s structure reflects its global membership and collaborative nature. Its main organs include:
The Board of Governors – Composed of one governor from each member country, usually the finance minister or central bank governor. It meets annually to make key policy decisions.
The Executive Board – Consists of 24 Executive Directors representing member countries or groups of countries. It handles the day-to-day operations and decisions.
The Managing Director – The head of the IMF, appointed by the Executive Board, oversees the institution’s operations. Traditionally, the Managing Director is European, while the President of the World Bank is American—a reflection of post-war political arrangements.
Quota System – Each member’s financial contribution (quota) determines its voting power and access to IMF resources. The quota reflects the country’s relative size in the global economy.
While this structure is designed to balance representation, there have been debates about reforming the quota system to give emerging economies like China, India, and Brazil greater influence.
Functions of the IMF
The IMF’s role extends across several crucial domains:
1. Surveillance
IMF surveillance involves the monitoring of global, regional, and national economies to identify potential risks and recommend corrective measures. Through the Article IV Consultations, the IMF reviews each member country’s economic policies and provides policy advice. These reviews promote transparency, fiscal discipline, and effective governance.
The IMF also publishes the World Economic Outlook (WEO) and the Global Financial Stability Report (GFSR), which are highly respected analyses of global economic trends and risks.
2. Financial Assistance
When countries face severe economic crises, such as currency collapses or balance of payments deficits, the IMF provides financial support. This assistance is typically conditional on the implementation of policy reforms—known as IMF programs or conditionalities.
Some of the key lending instruments include:
Stand-By Arrangements (SBA): For short-term balance of payments problems.
Extended Fund Facility (EFF): For longer-term structural issues.
Poverty Reduction and Growth Trust (PRGT): For low-income countries at concessional rates.
Rapid Financing Instrument (RFI): For emergency assistance, such as during the COVID-19 pandemic.
These programs are designed to stabilize economies, restore investor confidence, and lay the groundwork for recovery.
3. Technical Assistance and Capacity Development
The IMF helps countries strengthen their institutions and human capital through training and technical assistance. This covers areas like fiscal policy, central banking, statistics, and legal frameworks. Such capacity-building programs are crucial for developing nations seeking to modernize their economies and manage resources effectively.
IMF’s Role in Global Financial Crises
The IMF has been central in managing several major financial crises throughout history. Its interventions have often defined the path of global recovery.
1. The Latin American Debt Crisis (1980s)
During the 1980s, many Latin American countries defaulted on their debts due to rising interest rates and falling commodity prices. The IMF stepped in with stabilization programs aimed at restructuring debt and curbing inflation. Although these programs helped restore macroeconomic stability, they were also criticized for imposing austerity measures that deepened poverty.
2. The Asian Financial Crisis (1997–1998)
The crisis that began in Thailand spread rapidly across East Asia, leading to currency collapses and severe recessions. The IMF provided substantial financial packages to countries like Indonesia, South Korea, and Thailand. However, its insistence on fiscal austerity and structural reforms was controversial, with some critics arguing that these policies worsened the downturn. Nonetheless, the IMF later adapted its approach, incorporating lessons from this crisis.
3. The Global Financial Crisis (2008–2009)
The 2008 crisis marked a turning point for the IMF. For the first time in decades, advanced economies sought IMF advice and support. The institution played a key role in coordinating global stimulus measures, advising on monetary easing, and supporting emerging economies with emergency funds. The IMF also increased its lending capacity and introduced flexible credit lines to respond more effectively to future shocks.
4. The COVID-19 Pandemic (2020–2022)
The pandemic triggered an unprecedented global economic shutdown. The IMF acted swiftly, approving over $250 billion in financial support to more than 90 countries. It created emergency lending mechanisms and temporarily suspended debt payments for low-income countries. The IMF also emphasized inclusive recovery, digital transformation, and climate resilience as new priorities.
IMF’s Role in Developing Economies
Beyond crisis management, the IMF plays a vital role in supporting developing and low-income nations. Through its Poverty Reduction and Growth Trust (PRGT) and Extended Credit Facility (ECF), the IMF offers low-interest or interest-free loans to promote sustainable growth.
The IMF’s support extends to:
Encouraging fiscal responsibility and public financial management.
Advising on tax reforms to improve revenue collection.
Supporting exchange rate stability and foreign reserve management.
Promoting structural reforms that attract investment and create jobs.
However, the IMF’s involvement in developing countries is often debated. Critics argue that its policy prescriptions sometimes prioritize financial stability over social welfare. In response, the IMF has increasingly integrated social spending protections and climate policies into its programs.
Criticisms and Controversies
Despite its critical role, the IMF has faced substantial criticism over the years:
Austerity Measures:
IMF programs often require governments to cut public spending and increase taxes, leading to social unrest and inequality.
Sovereignty Concerns:
Countries receiving IMF loans must often implement policy reforms dictated by the Fund, which some view as external interference.
Western Dominance:
The United States and European countries hold disproportionate voting power, raising questions about fairness and representation.
One-Size-Fits-All Policies:
Critics argue that the IMF’s macroeconomic models do not always account for the unique conditions of individual economies.
Slow Adaptation to Climate and Inequality Issues:
Although the IMF has recently embraced climate finance and inclusive growth, its traditional focus on fiscal stability sometimes limits flexibility.
Despite these criticisms, the IMF has made significant efforts to reform its approach—introducing debt sustainability analyses, gender equality frameworks, and climate resilience funding.
IMF’s Modern Role: A Shift Toward Sustainability
In recent years, the IMF’s priorities have broadened beyond financial stability to encompass inclusive and sustainable development. Key initiatives include:
Climate Change:
The IMF now assesses climate risks in its surveillance and offers support for green transitions through its Resilience and Sustainability Trust (RST).
Digital Finance:
It monitors the rise of central bank digital currencies (CBDCs) and crypto-assets, ensuring global financial stability in the digital era.
Gender Equality and Social Inclusion:
Recognizing that inequality can undermine growth, the IMF integrates social spending and gender equality goals into its programs.
Debt Transparency:
It promotes clear reporting of public debt to avoid hidden liabilities that could trigger future crises.
These reforms signify the IMF’s evolution into a comprehensive guardian of global stability, addressing not only monetary issues but also social and environmental challenges.
Conclusion
The International Monetary Fund remains a cornerstone of the global financial system. From its origins in the post-war era to its modern-day role in managing crises, supporting development, and promoting sustainability, the IMF has continuously adapted to a changing world.
Its crucial role lies in balancing economic stability with social progress, bridging the gap between nations, and offering a safety net in times of uncertainty. Despite its flaws and criticisms, the IMF’s presence ensures that no nation stands alone in the face of economic turbulence. As globalization deepens and new challenges—like digital disruption and climate change—emerge, the IMF’s role will become even more essential in shaping a resilient, inclusive, and sustainable world economy.
SPX500 (Sp500) SPX500: Bulls Maintain Strong Control
The SPX500 is currently trading around 6875, with bullish momentum firmly intact. Market sentiment remains optimistic as buyers continue to dominate price action, supported by strong breadth and resilience across key sectors.
As long as the index sustains above recent support zones, the near-term outlook favors further upside. Potential upside targets can be observed around 7007, 7209, and 7512 in the sessions ahead.
While short-term consolidations are possible, the broader trend structure continues to point toward strength and continuation of the prevailing uptrend.
This analysis is intended for educational purposes and reflects a professional market outlook, not financial advice.

6969An important note to my previous idea. We have a slightly different picture on SPX. Since SPX didn't go below 6550 it needs to reach 6969 level in order for the Fib target levels to match the same levels as on US500. Is this someone's joke? ...
Anyway the price is at the channel resistance on both charts, so I expect a strong pullback to start soon.

Weekly Outlook: XAUUSD, #SP500, #BRENT for 27-31 October 2025XAUUSD: BUY 4075.00, SL 4025.00, TP 4225.00
Gold starts the week near record territory, with spot prices fluctuating around $4,080 per ounce. Support comes from expectations of a Federal Reserve rate cut at the October 28–29 meeting and the recent pullback in U.S. Treasury yields ahead of the decision. Headlines about a potential temporary government funding pause in the U.S. and delayed data releases enhance gold’s role as a defensive asset, while September inflation came in slightly below expectations, reinforcing the case for policy easing. In addition, fund inflows into gold have stayed strong after October’s price spike.
The fundamental backdrop remains constructive: World Gold Council data point to renewed net purchases by central banks late in the summer, and October saw more active investment flows into “paper” gold as market volatility rose and real yields eased. Risks to this view include a more cautious Fed tone and a brief dollar rebound after the decision, but these are offset by steady institutional demand and ongoing geopolitical uncertainty.
Trade idea: BUY 4075.00, SL 4025.00, TP 4225.00
#SP500: BUY 6785, SL 6705, TP 7025
U.S. equities enter the week on strong footing: the S&P 500 holds near 6,790 after softer September inflation data and lower government bond yields. Markets are focused on the Fed’s October 28–29 decision; the prevailing view anticipates another rate cut, which would reduce borrowing costs and support the valuation of future earnings. The reporting season is in full swing, with expectations for double-digit earnings growth for 2025 and a busy week of results from index constituents.
Fundamentally, the index benefits from a combination of easing rate pressure, resilient profit expectations in sectors tied to digital infrastructure and AI-related investment, and a broadly steady consumer backdrop. Key risks include any prolonged disruption to federal services that could distort the macro data flow, and the chance of tighter corporate guidance given currency strength and fluctuations in global electronics demand.
Trade idea: BUY 6785, SL 6705, TP 7025
#BRENT: SELL 66.30, SL 68.00, TP 61.20
Brent trades around $66 per barrel. The weekly news flow is mixed: on one hand, infrastructure risks linger in the Black and Baltic Sea regions; on the other, international agencies flag accelerating supply growth alongside moderate demand. The earlier OPEC+ decision to allow a marginal output increase and revised surplus projections effectively cap prices despite sporadic supply disruptions and sanctions-related headlines.
By late October, industry assessments imply a gradual rebuild in inventories and a softer price path into Q4, albeit with elevated headline-driven volatility. Additional pressure comes from a cooler global backdrop and rising non-OPEC+ production, while any Fed rate cut would only partly lift the commodity complex. Short-position risks include an escalation of geopolitical tensions that threatens exports and an unexpectedly sharp draw in weekly U.S. stock data.
Trade idea: SELL 66.30, SL 68.00, TP 61.20

US500Trading forex based on strong fundamentals is beneficial because it allows investors to make informed decisions grounded in real economic data rather than speculation. By analyzing key indicators like interest rates, inflation, GDP growth, employment, and geopolitical stability, a trader can anticipate currency movements driven by macroeconomic forces. This approach helps identify long-term trends and reduces emotional or impulsive trading, offering more consistent and sustainable profits. In essence, good fundamentals turn forex trading from a gamble into a strategic investment rooted in economic reality.

S&P 500 ready for correction?Hi Guys,
The sharp selloff on the US indices recently was a sign of further selling to come on the US Indices. As with just about all corrections there is the selling pressure in the form of an engulfing candle or breach of support etc, that indicates that the correction is imminent.
There is strong confluence to support a case for a nice pullback.
Firstly index is approaching 7000. Psychological number and if one takes a look at every time 1000 points has been reached the SP 500 has had a pullback.
Secondly the 1.618 fib retracement of the most recent correction is almost exactly at the 7000 mark.
Last of all , trendline resistance from recent price action and also from last few years lies in same area.
Sell trades using lower time frames, with price action candlestick chart patterns could result in some nice risk to reward trades.
Safe Trading all

US stocks hit record highs on better-than-expected CPI
The Sep US CPI indicated that tariff-driven inflation has not materialized, reinforcing the Fed’s dovish policy stance and driving US equities to new record highs. The prevailing view in the market remains with “Don’t fight the Fed.” The stock market’s impressive resilience, defying the typical seasonal weakness through Oct, reflects a dovish Fed stance amid the absence of recession signals.
The S&P; 500 remained within the ascending channel, reaching a new high at 6,800. Diverging bullish EMAs suggest that the bullish structure may extend further. If the index closes above 6,800, it could advance toward 6,900. Conversely, a drop below 6,800 may lead the price to retreat toward 6,700, which coincides with EMA21.
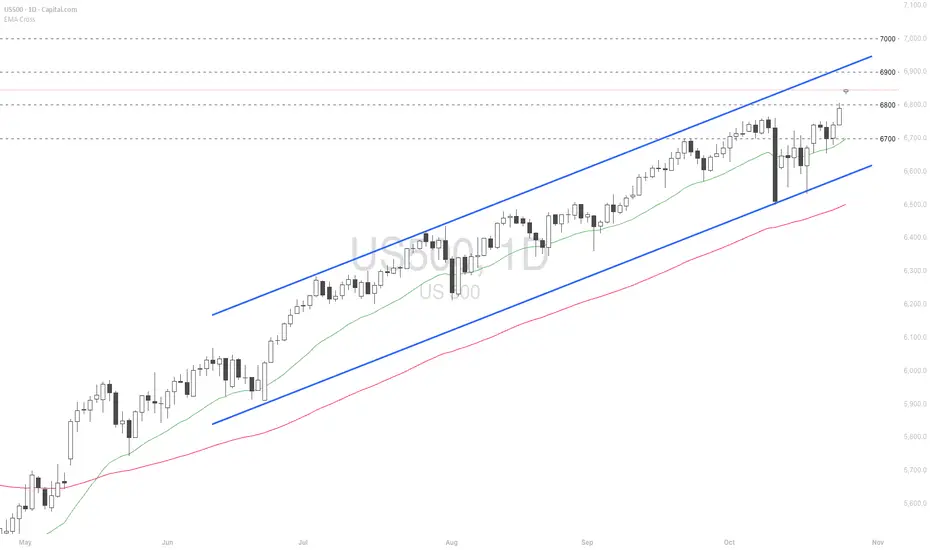
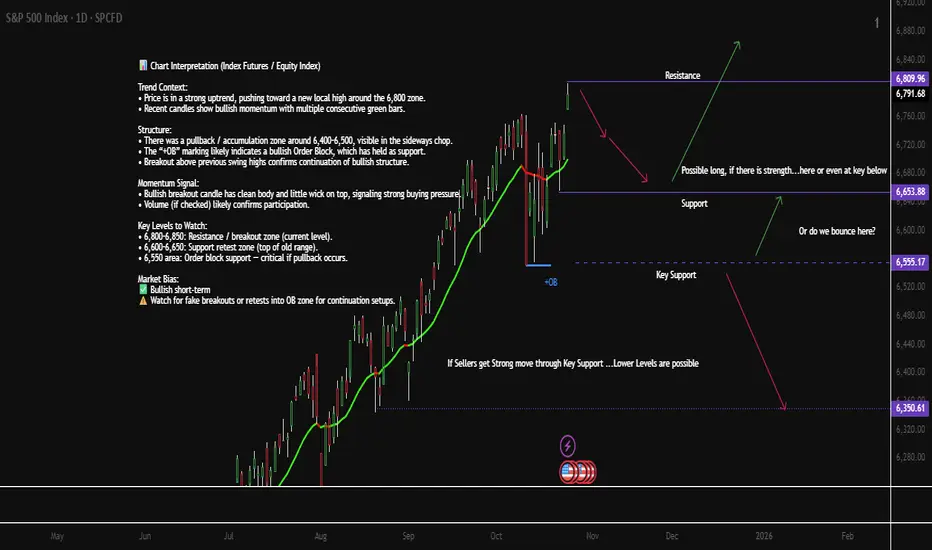
Chart Interpretation (Index Futures / Equity Index) SPX / S&PChart Interpretation (Index Futures / Equity Index)
TECHNICAL ANALYSIS
Trend Context:
• Price is in a strong uptrend, pushing toward a new local high around the 6,800 zone.
• Recent candles show bullish momentum with multiple consecutive green bars.
Structure:
• There was a pullback / accumulation zone around 6,400–6,500, visible in the sideways chop.
• The “+OB” marking likely indicates a bullish Order Block, which has held as support.
• Breakout above previous swing highs confirms continuation of bullish structure.
Momentum Signal:
• Bullish breakout candle has clean body and little wick on top, signaling strong buying pressure.
• Volume (if checked) likely confirms participation.
Key Levels to Watch:
• 6,800–6,850: Resistance / breakout zone (current level).
• 6,600–6,650: Support retest zone (top of old range).
• 6,450 area: Order block support — critical if pullback occurs.
Market Bias: Bullish short-term
Watch for fake breakouts or retests into OB zone for continuation setups.
FUNDEMENTAL ANALYSIS
U.S. Market Key Events — Week of Oct 27–31
Mon Oct 27
• 4:00 AM — 🇪🇺 German IFO Business Climate (watch EUR tone early session)
Tue Oct 28
• 9:00 AM — 🇺🇸 Richmond Manufacturing Index
• Tentative — 🇺🇸 CB Consumer Confidence
Wed Oct 29
• 9:00 AM — 🇺🇸 Pending Home Sales m/m
• 1:00 PM — 🇺🇸 Federal Funds Rate Decision (FOMC)
• 1:30 PM — 🇺🇸 FOMC Press Conference (high impact)
Thu Oct 30
• Tentative — 🇺🇸 Advance GDP q/q
• Tentative — 🇺🇸 Advance GDP Price Index
U.S.–China Trade Talks (market sensitivity risk)
Fri Oct 31
• Tentative — 🇺🇸 Core PCE Price Index m/m
• Tentative — 🇺🇸 Employment Cost Index q/q
📝 Focus on FOMC (Wed), GDP & Trade Talks (Thu), Core PCE (Fri) — high impact sessions for S&P / Dow / USD.
SPX into the new weekWe either pop 6800 on good news or retrace to test support.That looks to be the pattern we are trading uneless it breaks

US500 Surges On Softer US CPI DataFundamental & Sentiment Analysis
The US500 surged this week after the release of cooler than expected US CPI data. This bolstered expectations for further rate cuts by the Fed at its 28–29 Oct meeting. Investor sentiment turned sharply bullish, pushing the index to new record highs near 6,792 on Friday.
The inflation report for September 2025 surprised markets to the downside: headline US CPI rose 0.3% (3.0% YoY) and core CPI rose 0.2% (3.0% YoY), both below forecasts.
This moderation fueled optimism that inflation is cooling sustainably, raising the odds of a 25 basis point rate cut at the upcoming FOMC meeting. Following the CPI release, the US500 rose to 6,762 intraday, just shy of its all-time high.
Technical Outlook
The outlook for the coming week is moderately bullish, with potential consolidation at record highs. Momentum remains supported by softer inflation, dovish Fed expectations, and continued strong corporate earnings.
However, technical analysts warn of short-term pullbacks as the index tests critical resistance levels. A correction toward 6,720 would be healthy before a move higher toward 7,000.
The US stock market is positioned for further gains into year-end if inflation stays contained and the Fed confirms a sustained policy easing trajectory.
Analysis is by Terence Hove, Senior Financial Markets Strategist at Exness

REVEALED: What REAL Trading isWhat is Financial Trading in a nutshell?
For the last 20 years I’ve summed up trading as just ONE BIG AUCTION.
It sounds like a fast-paced, high-risk, Wall Street movie scene with shouting brokers and skyrocketing graphs.
But, here’s the truth:
Trading is the most relaxing thing – when done right!
It’s a lifestyle, a process, and a mindset.
It’s one thing where YOU can take your finances on an exciting adventure — if you do it right.
Whether you’re a complete newbie or a seasoned trader, here is a refresher to dive into what trading really is.
Trading Is More Than Just an Auction of buying or selling…
Let’s clear up one thing first.
For the last 20 years I’ve summed up trading as just ONE BIG AUCTION.
And yes it is one big market of buying and selling – but that’s only part of it.
TRADING is all about solving a puzzle of analyzing probabilities, managing risks, and navigating uncertainty.
Every time you enter a trade (buy or sell), you’re making an educated guess on where the market is LIKELY to go next.
And you’re placing a bet on human behavior — how millions of people around the world (with their emotions, news reactions, and strategies) will affect the price of an asset.
That’s the technical side of trading. Here’s where I want you to integrate trading into your life…
Trading Is A Lifestyle
It’s not just about making money — it’s about integrating trading into your lifestyle.
You need to find the right markets, time, time frame, styles, strategy and approach.
Trading is like hitting the gym; it requires discipline, consistency, and a whole lot of sweat equity.
And just like you don’t get a six-pack or lose weight after ONE workout.
You shouldn’t expect to master trading overnight.
It’s a routine you build day by day.
A typical trading day might include:
Pre-market analysis (Weekly bias):
You need to check what’s happening in the world with other markets with both Asian, American, European and even London session.
You also need to look at the US Economic Calendar to see what news is arising for the week.
Analyse and Execute trades:
Once done the pre analysis, you need to do the actual analysis. See what trades are lining up according to your proven strategy. And if anything looks good to go EXECUTE.
Review and track your trades:
This is where you will reflect on what went right and what went wrong. This is where you’ll track and review your trades that lined up to add to your journal.
The key takeaway: Trading isn’t just what you do; it’s who you become.
Trading Is a Forever Game
When it comes to trading, think long-term.
Like, REALLY long-term. Because trading is a forever game.
Unlike sports with seasons or video games with levels, trading doesn’t end.
The markets will be there tomorrow, next week, and 100 years from now.
And as a trader, your mission is to stay in the game for the long haul.
That means managing your risk, protecting your capital, and always looking to improve your skills.
Trading Is A Business Where YOU Are The Boss
The beauty of trading?
You’re in control.
Trading is a business, and you are the CEO.
You call the shots, decide when to enter and exit trades, and ultimately, you take control of your financial destiny.
Like any business, trading requires:
Planning and strategy:
Risk and reward management:
Tracking performance and improving:
And, just like in any business, you’ll make mistakes.
But those mistakes are not failures; they’re lessons.
You learn from them, adapt, and get better. That’s what makes trading such an empowering journey.
Final Words:
Financial trading is more than a job, a hobby, or a side hustle.
It’s a process-driven approach to decision-making, a lifestyle to live, a forever game to play, and a business where you’re in charge.
If done right, trading can be one of the most rewarding pursuits you’ll ever undertake.
Key Takeaways
Trading is a process: Follow a set strategy, criteria, and rules for success.
Trading is a lifestyle: Incorporate trading into your daily routine and stick with it consistently.
Trading is a forever game: It’s not a one-time event; it’s a lifelong pursuit.
Trading is a business: You’re the CEO — plan your moves, manage your risk, and take charge of your financial destiny.

The Real 3 Thrills of Trading: (Hint: It’s Not When You Think)Trading.
It’s a game.
A challenge.
A journey.
It’s a lifestyle.
And yes having a passion to trade is half the battle won.
But it’s not just about winning.
If you feel thrill when you win a trade. Then you’re enjoying the wrong parts of successful trading.
If you’re in a winning streak and feel thrill – Same story.
Because you know the losses are inevitable.
And you know the drawdown is coming too.
So that’s why you need to enjoy the FULL journey…
And here’s where you should feel the THRILL for trading.
THRILL #1: When you survive the drawdown
Like I said earlier, your next drawdown is coming.
Your BIGGEST drawdown is coming.
So you need to embrace and prepare for these times.
I have gone through more drawdowns than you can imagine.
And yet my portfolio keeps heading to all time highs.
HOW?
Well you need to endure the drawdown.
You need to keep following your rules and strategy.
And when the market environment is more favourable, your portfolio will turn from down to up.
And it will continue to go up until you not only recover – but your portfolio breaks to all time highs.
And when you survive the drawdown – FEEL THRILL!
THRILL #2: Knowing your strategy works (through the good and bad)
The markets are like an ocean.
Waves come and go, the tide shifts, and sometimes there’s a storm.
If you go look at the US Economic Calendar you’ll know the market is about to swivel in ways you can’t even imagine!
The thrill doesn’t come from riding one good wave (winner).
It should come from taking every trade that lines up perfectly with the strategy.
If you followed your rule and criteria to a T – Feel THRILL that you are on the right path to success.
Regardless of whether the trade is a winner or a loser.
See the bigger picture and what it can do for you!
THRILL #3: The Love for the Game and the benefits of trading
Remember I said trading is more than just money.
Trading helps with everything in your life!
It teaches you to be a risk manager.
It teaches you how to toughen your mind.
It teaches you how to be disciplined, consistent.
And it teaches you how you can CREATE your own wealth without depending on a BOSS.
The Challenge, the Mental Toughness, and the Growth
And the thrill?
FINAL WORDS – Celebrate the Right Thrills
The thrill of trading isn’t about the quick wins, the big gains, or riding the market waves.
It’s about resilience. Mastery. Passion. Patience. And growth.
Well fall in love with what trading has offered and taught you, other than the money aspect.
It’s not just about making money; it’s about becoming better. Sharper. Wiser.
Every trade you take is a lesson.
Every loss is a learning opportunity.
And every time you wake up excited to face the market, that’s the thrill of passion.
Because trading isn’t just a job.
It’s a craft.
A skill.
A calling.
If you find yourself waking up early, excited to start your day, knowing full well there’s a challenge waiting for you—you’ve found the thrill.
If you find weekends are not ending early enough because you want to trade – that’s a thrill!
Let’s sum up some reasons to feel THRILL when trading.
THRILL #1: When you survive the drawdown
THRILL #2: Knowing your strategy works (through the good and bad)
THRILL #3: The Love for the Game and the benefits of trading
Do you agree and how has trading changed your life?
WHY Financial Markets Will Always ChangeChange is the only constant in the financial markets.
And that’s why it’s important to stay humble and grounded because everyday is a UNIQUE day to the markets and the pre market movers.
No matter how much experience you have, you can’t get too comfortable with the way things are.
Because we know they won’t stay that way for long.
The markets are like a living, breathing entity—constantly shifting, evolving, and transforming.
And now I want to explain why I believe the markets are ALWAYS changing.
REASON #1: The Fresh Faces of Trading
Continuous flow of new and old traders.
Every day, new traders enter the game while seasoned veterans continue to play.
This constant influx of fresh perspectives creates a dynamic market environment.
New traders bring innovative strategies, emotions, and decision-making processes into the market, while the veterans tweak their systems to keep up with ever-evolving trends.
And so the demand and supply is constantly shifting in new ways – which changes the markets style, moves and algorithms.
End of the day, the market is one big AUCTION as I have told my members for the last 15 years.
They’re influenced by the people who trade in them.
REASON #2: The Never-Ending Stream of New Information
New information – shining on the market
Here’s the thing: the financial markets thrive on information.
New data points, news reports, earnings releases, and economic indicators flow in non-stop, impacting prices and trends at every turn.
Sometimes there is good days with amazing news coming out.
Other days there is catastrophic news.
And then you get the mundane boring days with no reaction.
If a central bank announces an unexpected interest rate cut, or if a company releases disappointing earnings, the market is going to react swiftly.
Even geopolitical events and natural disasters play their part in shaping the direction of markets.
So no matter how much analysis you’ve done, be prepared for the fact that new info can change the game in an instant.
REASON #3: Micro, Macro, and Inner Fundamentals
New micro, macro and inner fundamentals
The fundamentals that underpin market movements are far from static.
On the micro level, individual companies are constantly evolving.
New product launches
Mergers and acquisitions
News and earning reports
Prospects
Leadership changes can all affect a stock’s price.
Zoom out a little, and you’ve got macro fundamentals.
These show the big-picture factors like:
Interest rates
inflation, and
unemployment rates,
All of which influence the broader economy.
REASON #4: Global Economies and World Events
World info from the economies
The financial markets are more interconnected than ever.
What happens in one part of the world now ripples through the rest of the global economy in minutes, not weeks.
A change in China’s trade policy can directly impact European markets.
An unexpected election result in America could influence the South African or UK equities.
REASON #5: The Endless Actions of Traders
Constant actions of traders around the world
Then, of course, we have the daily actions of traders around the world.
Every time a buy or sell order is placed, the market shifts.
I like to think of it as the Stock Market’s Butterfly-Effect.
These actions are a direct result of human behavior—our emotions, analysis, strategies, and even fear and greed.
When traders believe in a trend, they pile on, creating momentum.
But when panic strikes, markets can spiral down in a blink of an eye.
Since traders are constantly reacting to new information, the market flows like an ever-shifting river.
Conclusion
The financial markets are in a constant state of flux.
They will forever change and we need to learn how to evolve, adapt or die trying.
But there is one thing that is inevitable.
The markets will KEEP moving and trending. And for that, we will always be profiting in the medium to long term.
Let’s sum up why the markets will always change…
REASON #1: The Fresh Faces of Trading
Continuous flow of new and old traders.
REASON #2: The Never-Ending Stream of New Information
New information – shining on the market
REASON #3: Micro, Macro, and Inner Fundamentals
New micro, macro and inner fundamentals
REASON #4: Global Economies and World Events
World info from the economies
REASON #5: The Endless Actions of Traders
Constant actions of traders around the world
