US500 Short term cautionOutlook
While short term caution is warranted due to the recent decline and elevated volatility, the US500 remains in a long term uptrend supported by strong annual gains. Expectations of continued resilience from large cap stocks maintain a positive outlook going into year end. However, models suggest a cautious path for the near future, anticipating the index to correct, indicating potential headwinds. The critical support zone remains near 6,400.
Fundamental Analysis
US500 demonstrates robust long term health, up over 11% compared to one year ago. This performance is fundamentally driven by resilient large cap earnings and underlying strength in technology and consumer sectors. Major financial institutions, including JP Morgan, Goldman Sachs, and Citigroup, have recently raised their year end targets into the 6,000 – 6,900 range, citing expectations of continued strong earnings and potential tailwinds from monetary policy shifts and interest rate cuts. However, current sentiment has introduced short term caution due to recent macroeconomic developments and elevated volatility.
Technical Analysis
The index is currently trading around a key support of 6,600 points, reflecting a short term decline from the previous session. The short term trend is showing signs of a possible bearish correction or pullback, despite longer timeframes maintaining underlying bullish momentum. Volatility is notably elevated, with the VIX above 25.00, suggesting increased market uncertainty and potential for sharp swings. Immediate resistance is clearly defined near the recent high of 6,725. Immediate support is seen around 6,600 points. Short term bearishness is primarily attributed to technical factors like profit taking.
Analysis by Terence Hove, Senior Financial Markets Strategist at Exness
Trade ideas

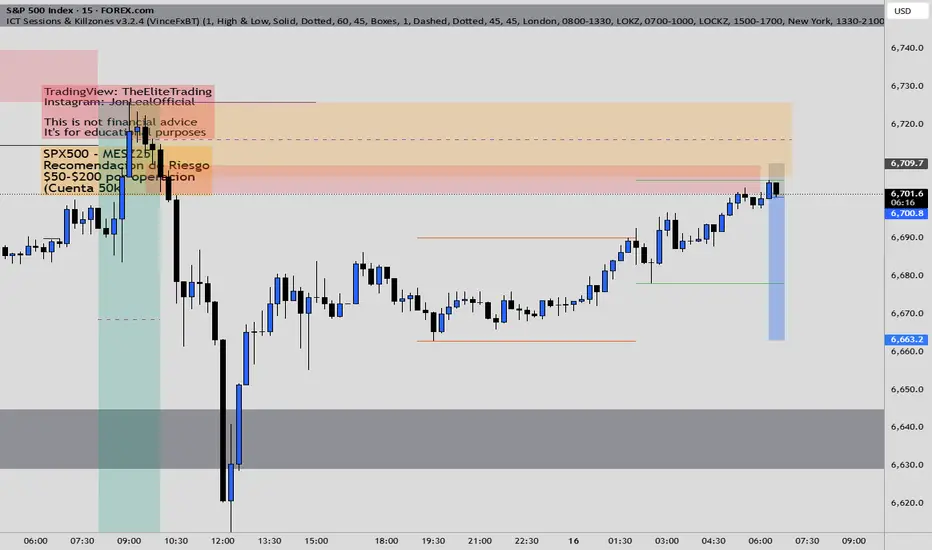
SPX500 Drops as Regional Banking Worries Shake Wall StreetSPX500 – Overview | Bearish Pressure Below 6,578
U.S. stock futures fell nearly 2% as regional banking concerns resurfaced following disappointing earnings and early signs of credit stress across smaller U.S. lenders.
The selloff reignited fears about credit quality and dragged global markets lower, while traders now shift focus to upcoming earnings from regional banks and American Express for further clues on financial stability.
🕯 Technical Outlook
SPX500 maintains bearish momentum while trading below 6,578, targeting 6,550 → 6,527 → 6,506.
A 1H close above 6,578 would shift sentiment bullish, opening the path toward 6,609 → 6,635 → 6,670.
Pivot: 6,578
Support: 6,550 – 6,527 – 6,506
Resistance: 6,609 – 6,635 – 6,670

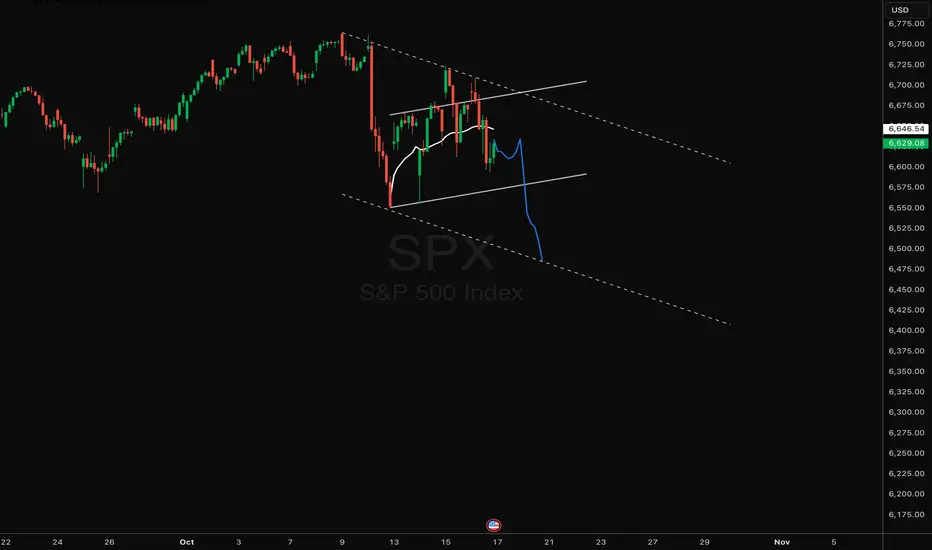
SPX — Still Below Anchored VWAP, Eyes on Lower Channel BoundSPX remains capped below the anchored VWAP — sellers still dictating flow. If price can’t reclaim above, a move toward the lower bound of this descending channel remains in play. Watching for a reaction near channel support.
Macro Backdrop:
Sticky yields: 10Y holding near cycle highs keeps pressure on equity multiples.
Fed tone: “Higher for longer” stance limits risk appetite and valuation expansion.
Slowing growth: Softening ISM and consumer data hint at cooling demand.
Earnings compression: Margin pressures building as labor and input costs stay elevated.
Geopolitical overhangs: Middle East tensions and trade friction adding to risk-off tone.
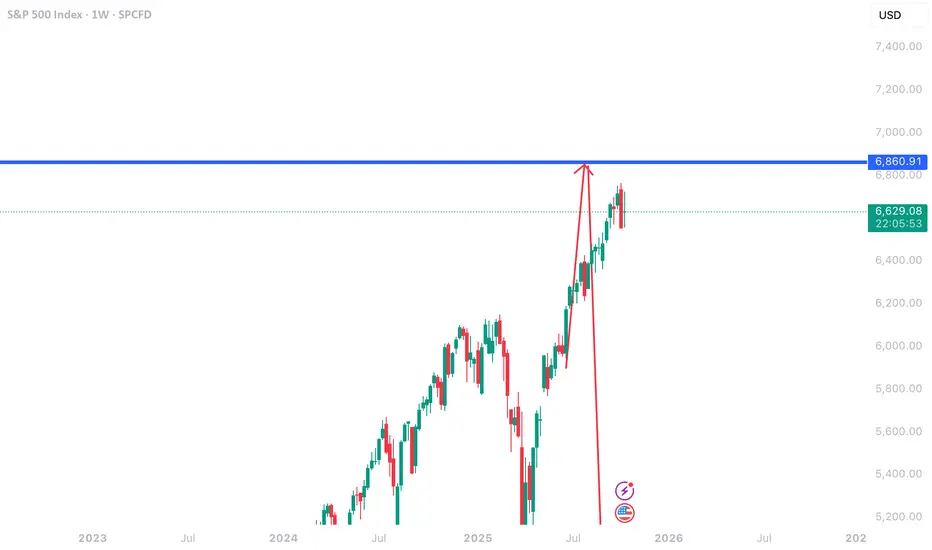
Longer term S&P500 potential Slightly longer term look at the S&P 500 if we see a further decline in price. This is a weekly chart and would need to see price decline by some 15% from the current level. Theres a few current catalysts that could contribute to such a move:
- US government shutdown comes to an end. The shutdown itself maybe wouldn't have the biggest market reaction but at the moment markets are trading in the dark with the absence of major US macro data so the eventual release of this data will cause some very big volatility, just a matter of seeing in which direction.
- We've seen some positivity in the geopolitical space and market were continuing to rally although it seems it's either priced in now or has been shrugged off, well see how goes through the remainder of trumps peace deal.
- We're also coming into Q3 earning and some of the big names have been massively helping to drive indexes higher. Any big misses or beats on earnings could also provide some big volatility, lots of stocks are propped up with high expectations so downside could be big on misses.
- Finally, market is still uneasy since that last tariff threat to China , confirmation on the end of this would also spread some good positivity in the equity space.
Any of these current drivers could have the potential to see price towards the weekly trendline or to breakout through ATH's again.
Depending on if you're taking a leveraged shorter term trade or an unleveraged ETF investment would determine how/when you enter on such a pullback.

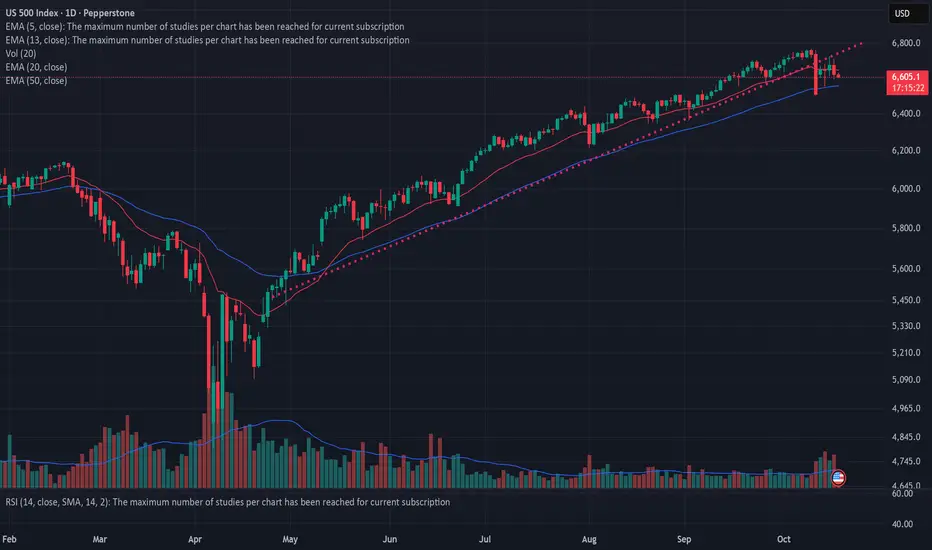
Is SPX selling for a sell off Observation on SPX
1) Since 25TH April the SPX was bouncing on its 20 Ema . In fact if you bought every time SPX touched the 20 EMA you would have made money .
2) The 20 Ema acted as a support 6 times .
3) But notice the last three bounces were weaker and weaker .
4) 7TH time the 20 Ema broke with increasing volume .
Conclusion the probability of a break down is very high almost 75%

16 OCT 2025: H1 - SMT DIVERGENCE VISUALIZEDNARRATIVE:
US100 made a HH purging the PDH and delivering into the H4 -OB
US30 made a LH and did not purge the PDH
US500 made a LH and did not purge the PDH
SMT is drawn from the High of the PD to the High of the current day - note that on the LTFs like the M15, if you look closely this is the PD NY High to the current day NY high. The M15 provides the landscape for you to execute in real-time and observe the SMT whilst it occurs.
Hope you enjoyed today's lesson :)
DISCLAIMER:
The owner of this page is an authorised Representative under supervision of TD MARKETS (PTY) LTD, an authorised Financial Services Provider (FSP No. 49128) licensed by the Financial Sector Conduct Authority (FSCA) under the Financial Advisory and Intermediary Services Act (FAIS).
The FSP is licensed to provide advice and intermediary services in respect of Category I financial products, including but not limited to derivative instruments, long-term deposits, and short-term deposits.
All investment ideas are provided in accordance with the scope of the FSP's license and applicable regulatory requirements. Derivative instruments is a leveraged products that carry high risks and could result in losing all of your capital, and past performance is not indicative of future results.
This idea and any attachments are informational/education and does not constitute a recommendation to buy/sell.
No guarantee is made regarding the accuracy or outcome of this trade idea.
If you choose to accept this idea, please do so at your own risk.

Breakdown in SPX is a possibility Observation on SPX
1) Since 25TH April the SPX was bouncing on its 20 Ema . In fact if you bought every time SPX touched the 20 EMA you would have made money .
2) The 20 Ema acted as a support 6 times .
3) But notice the last three bounces were weaker and weaker .
4) 7 time the 20 Ema broke with increasing volume .
Conclusion the probability of a break down is very high almost 75%
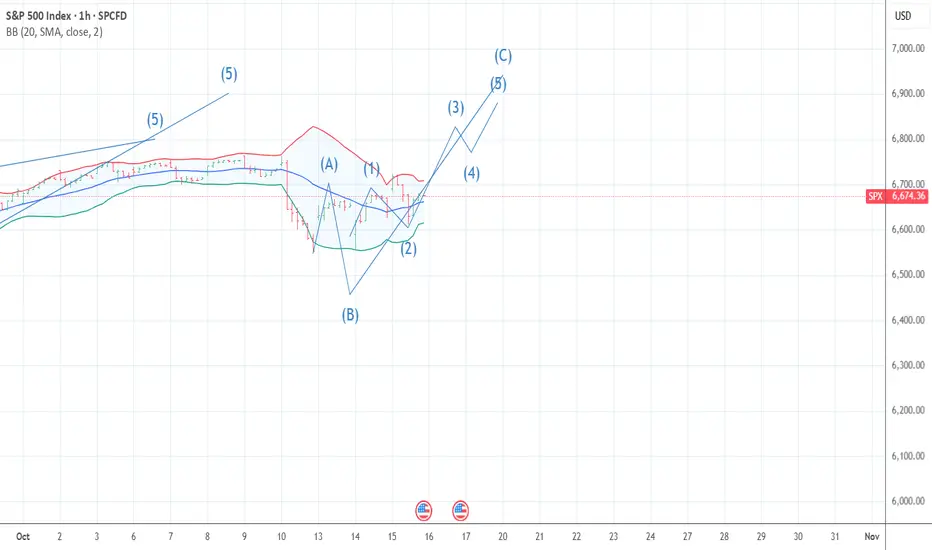
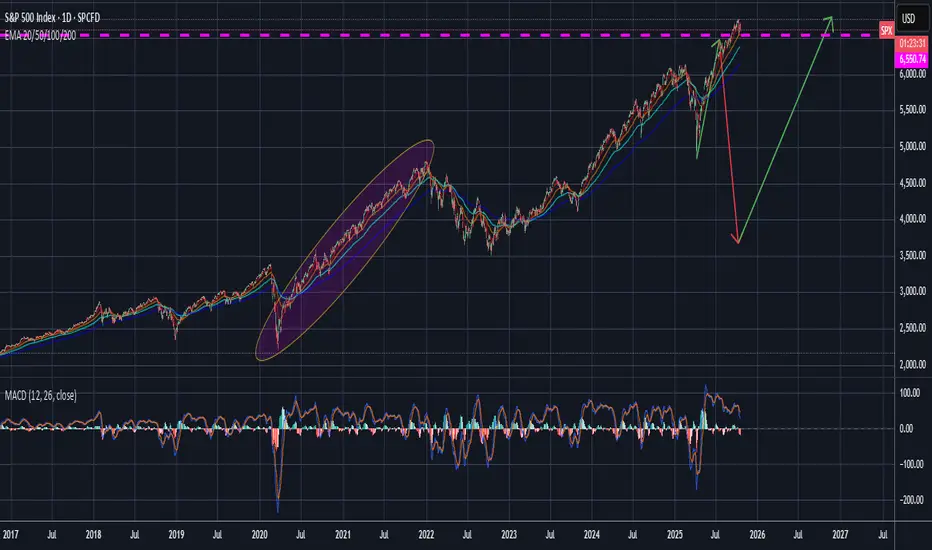
S&P500 | Mild CrashRisk assets looking to sell off as the stock market tops out around $6,800.
Current price action is only pulling back to test sellers again and we should see a continuation in selling until mid November and hopefully to see a Christmas rally to end the year off.
Since price action awfully looks similar to '24 - '25 Fractal we could say the SPX will look to top next year February/March also considering we're on correction 4 in the Elliott Wave Theory.
Would like to see the S&P bottom out around April - July months of next year at $5,600 if we can continue the bullish parallel trend.

Is SPX indicating a breakdown The SPX is trading below its trendline on the daily chart , with increasing volume .
All signs of a breakdown.

SPX ceiling has set in, we expect no further bull activity!This will happen, what will cause it, I don't know.........
NO MORE BULL ACTIVITY FOR SPX, ITS ONLY DOWN FROM HERE - Goldstandard212
Friday will be bloody for SPX. We've been calling the bull move since 5,900$ and before I opened this account, even lower (the bottom).
Please see linked ideas to see how we've called every move for SPX, THIS IS FAR TOO EASY WHEN YOU ARE IN THE KNOW.
from your favourite insider info guy......
SPXShift prediction to the right a bit. I think almost everyone in these markets are waiting to sell.... I'm thinking if SPX closes below $6650 today, that will give the signal the wolves are looking for.
Still anticipating brief freefall on crypto ~1 week and brief correction on stocks ~1 month.
Short timeframe, but huge drop. Good luck.
H&S + RSI Divergence = Pain aheadSPX has a confluence of Head and shoulders and RSI divergence - This might be painful. Taking major profits here

SELL S&P 500from the price action point of view the S&P 500 is looking bearish. having been that the chart has formed a complete rising wedge. it liking to test and intra supoort level on 30H. of 6600.
#bearish #S&P500 #Fundamentalanalysis #technicalanalysis

SPX500 NEW HIGHSThis picture includes the 50 day moving average. In addition to Static Sq9 support at 6602, keep an eye on the 50dma at 6549. A close below the 50dma will get the attention of a lot of traders. Once the SPX closes below the 50dma, look for a waterfall decline as traders and investors start to panic.

SPX500 NEW HIGHSAccording to Gann: The high came at 6766--a cardinal level. Thereafter, SPX sold off and found support at 6602--another cardinal level. This shows you that the SPX is vibrating to the Static Sq9--very nice! That is what we need here. It means that once we start the correction all the levels you see listed here will become important. It doesn't mean that every level will offer support, but it does mean you need to pay close attention to each one as we go down. You can trade off them. Oddly enough, markets often become easier to trade the more volatility you have.

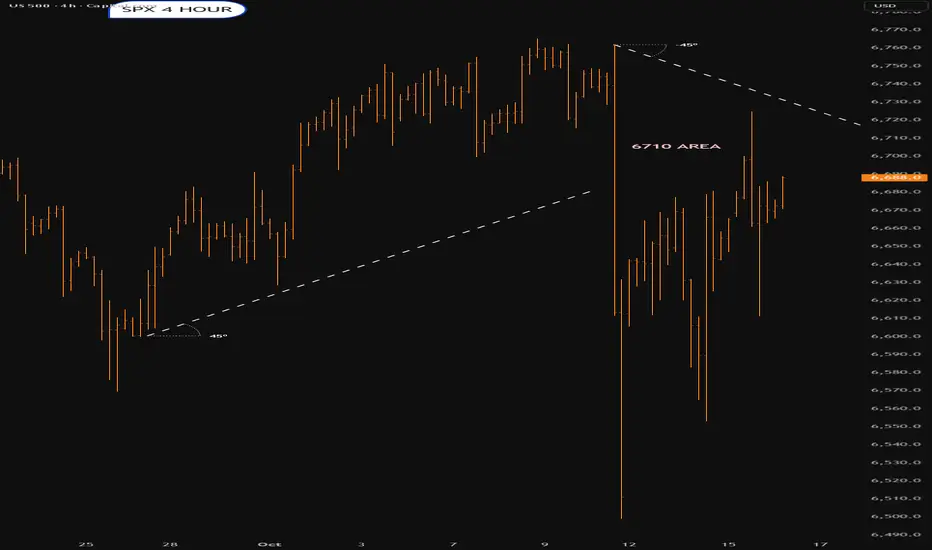
SPX | Daily Analysis #4 Hello and welcome back to DP,
**Review and News**
Yesterday, the index experienced a $150 intraday fluctuation and closed in the green. As mentioned in a previous post, we noted that "if the price breaks the 6682 zone, the index could extend towards the 6720 area." As illustrated in the chart, the market responded to this price range and dropped towards the 6620 zone. However, in a significant move, buyers outperformed sellers, pushing the price back to the 6681 zone. This move is noteworthy as it indicates that the market shows more potential for upward movement rather than a downward move. It’s also important to note that, in the final moments before market closure, President Trump tweeted: "The USA is officially in a trade war with China."
**1-Hour and 4-Hour Time Frame Price Action**
As depicted in the chart, the formation of higher highs (HH) and higher lows (HL) suggests that the market is struggling to regain gains and recover from its previous record highs. The significant candlestick shows that buyers have a strong presence and are willing to push the price higher. However, if the price dips below this candlestick, the index could move lower, potentially benefiting short sellers. That being said, I don’t believe this will happen. In my opinion, many retail traders are hoping for a larger price drop, but based on market behavior, this could be a trap for sellers. Therefore, I anticipate a potential upward move and a recovery of last Friday’s losses within this week.
**Trend Analysis**
While I’m unable to display my trend analysis chart here, as mentioned previously, the price tested the 4-hour trend line (with the first trend line originating from February 25, 2025, and the second starting from August 12, 2025). The price then made a significant move, breaking through the upper trend line.
**Trade Ideas**
1. If the price falls through the 6681 zone and confirms the break, consider entering a buy position at the last high.
2. If the price declines with high volume (possibly triggered by news) through the 6617 area and breaks this zone strongly, a cautious sell position can be considered, with two take-profit levels on the way down.
3. Based on the 4-hour trend line, a buy position could be considered if the price falls and approaches the trend line again (around the 6630 area).
**Disclaimer**
These notes and trade ideas are for informational purposes only and do not constitute financial advice.
*Issued by: A. Diba Kohn*

SPX into Thursday 16th OctoberMarket has flipped from bullish to bearish,It is trying to unwind that downtrend.Will it succeed.?
Traders, Investors, and PolicymakersTheir Role in Global Trading.
Introduction
Global trading forms the backbone of the world economy. It connects nations through the exchange of goods, services, capital, and ideas, driving economic growth and innovation. Behind the seamless flow of trade, three critical groups shape its structure and direction — traders, investors, and policymakers. Each group plays a distinct but interconnected role in ensuring that global markets function efficiently, fairly, and sustainably.
Traders facilitate transactions and price discovery; investors allocate capital and influence long-term market trends; policymakers design the legal and institutional framework that governs trade and investment. Together, they create a dynamic balance between market forces and regulations, driving global economic progress.
1. The Role of Traders in Global Trading
1.1 Market Intermediaries and Price Discovery
Traders are the front-line participants in global markets. Their primary function is to buy and sell goods, commodities, currencies, and financial instruments across borders. Through their actions, traders facilitate price discovery — the process by which the value of an asset is determined based on supply and demand.
In global markets, traders operate in multiple forms:
Commodity traders, dealing in oil, metals, agricultural products, etc.
Currency traders (forex traders), influencing exchange rates and liquidity.
Equity and derivatives traders, focusing on stocks, bonds, and financial contracts.
By responding quickly to changing market conditions — such as geopolitical tensions, inflation data, or production shifts — traders ensure that prices reflect real-time global realities. This continuous activity keeps markets liquid and efficient.
1.2 Risk Management and Hedging
Global trade is inherently risky. Prices of commodities and currencies fluctuate constantly due to factors like weather, politics, and global demand. Traders play a critical role in risk management by using derivatives instruments such as futures, options, and swaps.
For example:
An oil producer may hedge future prices by selling crude oil futures contracts.
An importer may buy currency futures to protect against exchange rate volatility.
Such hedging activities stabilize revenues and costs, making international trade more predictable. Traders thus act not merely as profit seekers but also as risk absorbers, helping firms and economies manage uncertainty.
1.3 Liquidity Creation and Market Efficiency
One of the most important functions traders perform is liquidity creation. By continuously buying and selling, they ensure that there is always a counterparty for market participants wanting to enter or exit a trade. Liquidity enhances market efficiency, reducing transaction costs and narrowing bid-ask spreads.
In global markets, high-frequency trading firms, market makers, and institutional traders provide the bulk of this liquidity. Their algorithms process information in microseconds, reacting to changes across global exchanges — from New York to London to Tokyo — creating an interconnected trading ecosystem.
1.4 Speculation and Price Stabilization
While speculation is often criticized, it plays a vital role in price stability. Speculators take positions based on their forecasts of market movements, which often correct price distortions caused by temporary imbalances in supply and demand.
For instance, if a drought threatens wheat production, speculators may buy wheat futures, pushing prices up early. This incentivizes farmers to produce more and consumers to conserve, helping balance the market over time. Thus, traders indirectly contribute to long-term equilibrium through their speculative actions.
2. The Role of Investors in Global Trading
2.1 Capital Allocation and Global Growth
Investors — including individuals, institutions, and sovereign wealth funds — play a foundational role by providing the capital that fuels global trade and development. Their investment decisions determine which countries, industries, and companies receive funding to expand production, improve infrastructure, and innovate.
Foreign Direct Investment (FDI), portfolio investment, and venture capital flows are all forms of global investment that bridge financial gaps between nations. For developing economies, such inflows bring not just capital but also technology, expertise, and access to international markets.
For example, investors in emerging markets like India or Vietnam help create factories, logistics hubs, and export-oriented industries that become integral parts of the global supply chain.
2.2 Long-Term Stability and Confidence
While traders focus on short-term movements, investors typically adopt a long-term outlook. Their steady commitment provides stability and confidence to global markets. Institutional investors like pension funds, mutual funds, and insurance companies deploy capital over years or decades, allowing businesses to plan for sustainable growth.
Moreover, investors’ willingness to hold assets across economic cycles smooths out market volatility and helps economies recover from downturns. For instance, during global recessions, sovereign and institutional investors often continue to fund key projects, preventing total collapse in economic activity.
2.3 Portfolio Diversification and Global Integration
Global investors diversify across countries and asset classes to spread risk and enhance returns. This diversification links markets together — a movement in one region can now affect investment sentiment worldwide.
For example:
A slowdown in China can influence global commodity prices and stock markets.
A rise in U.S. interest rates can trigger capital outflows from emerging markets.
Thus, global investors not only connect financial systems but also transmit economic signals, influencing policymaking and business strategies worldwide.
2.4 Corporate Governance and Ethical Standards
Investors today increasingly focus on Environmental, Social, and Governance (ESG) principles. By choosing where to allocate capital, they exert influence over corporate behavior, encouraging transparency, sustainability, and ethical conduct.
Large institutional investors such as BlackRock or Norway’s sovereign wealth fund use their ownership stakes to push companies toward sustainable practices. In this way, investors act as guardians of global corporate responsibility, ensuring that profits are balanced with long-term social and environmental well-being.
3. The Role of Policymakers in Global Trading
3.1 Creating a Legal and Regulatory Framework
Policymakers — including governments, central banks, and international organizations — set the rules of the global trading system. Their policies determine tariffs, taxes, capital controls, interest rates, and trade agreements.
Without effective policymaking, global markets could descend into chaos. Laws governing intellectual property, labor rights, dispute resolution, and customs procedures ensure fairness and predictability. Institutions such as the World Trade Organization (WTO), International Monetary Fund (IMF), and World Bank coordinate policies among nations to maintain a level playing field.
3.2 Trade Agreements and Economic Diplomacy
One of the key policymaking roles is negotiating trade agreements that define how countries exchange goods and services. Bilateral and multilateral pacts such as the European Union (EU), North American Free Trade Agreement (NAFTA), or Regional Comprehensive Economic Partnership (RCEP) facilitate cross-border commerce.
Through diplomacy, policymakers open new markets, remove barriers, and harmonize standards. These agreements also provide dispute-resolution mechanisms that reduce uncertainty for traders and investors, making global trade smoother and more predictable.
3.3 Monetary and Fiscal Policies
Global trading is deeply influenced by monetary and fiscal policies. Central banks manage interest rates, currency supply, and inflation — all of which affect exchange rates and investment flows. For example:
When the U.S. Federal Reserve raises interest rates, the U.S. dollar strengthens, making imports cheaper and exports less competitive.
Fiscal policies like tax incentives or export subsidies can promote certain industries, shaping trade patterns.
Policymakers must balance domestic goals (such as employment and inflation control) with global competitiveness, ensuring their economies remain resilient in a fluctuating global environment.
3.4 Crisis Management and Market Stabilization
During periods of global crisis — such as financial collapses, pandemics, or wars — policymakers play a stabilizing role. They coordinate interventions like stimulus packages, bailouts, and monetary easing to restore confidence and liquidity in markets.
For instance, during the 2008 global financial crisis, coordinated actions by central banks and governments prevented a deeper economic collapse. Similarly, during the COVID-19 pandemic, massive fiscal and monetary responses helped maintain global trade flows and investment levels despite severe disruptions.
4. Interconnection Between Traders, Investors, and Policymakers
4.1 A Symbiotic Relationship
While their roles differ, traders, investors, and policymakers form a mutually dependent ecosystem.
Traders provide liquidity and efficiency that attract investors.
Investors supply the capital that drives global growth and trade volume.
Policymakers set the structure within which both can operate securely.
For example, a trader may profit from short-term movements created by new policy announcements, while investors adjust long-term strategies based on those same signals. Policymakers, in turn, analyze market reactions to gauge the effectiveness of their decisions.
4.2 Feedback Loops and Global Impact
The actions of one group often influence the others in a feedback loop:
If policymakers tighten monetary policy, investors may withdraw funds, leading traders to adjust their positions.
If traders detect currency instability, policymakers may intervene to stabilize exchange rates.
Investor confidence, reflected in capital inflows or outflows, often guides future policy decisions.
This constant interplay ensures that global trade remains dynamic and adaptive, capable of responding to new challenges and opportunities.
5. Challenges and Future Outlook
5.1 Technological Disruption
The rise of AI-driven trading, blockchain, and digital currencies is reshaping the roles of traders and investors. Algorithms now execute billions of trades daily, while decentralized finance (DeFi) is bypassing traditional intermediaries. Policymakers are challenged to keep pace with this rapid innovation while ensuring transparency and stability.
5.2 Geopolitical Tensions and Protectionism
Trade wars, sanctions, and regional conflicts can disrupt global supply chains. Policymakers must balance national interests with global cooperation. Traders and investors, in turn, must adapt to shifting regulations, tariffs, and political risks — making flexibility and diversification more critical than ever.
5.3 Sustainable and Inclusive Growth
The global trading system is under pressure to become more sustainable and inclusive. Investors are pushing for green finance; policymakers are designing carbon-neutral trade policies; and traders are exploring ethical sourcing. The collaboration between these three groups will determine whether global trade can evolve into a system that benefits both people and the planet.
Conclusion
The story of global trading is not just about goods, currencies, or capital — it’s about the interaction of human decisions across borders and markets. Traders bring liquidity and efficiency; investors provide capital and confidence; and policymakers ensure order and fairness.
Together, they form the three pillars of the global economic structure. Their coordinated actions determine how wealth is created, distributed, and sustained across nations. In an era of technological transformation and geopolitical complexity, their collaboration will be essential for building a resilient, equitable, and sustainable global trading system.
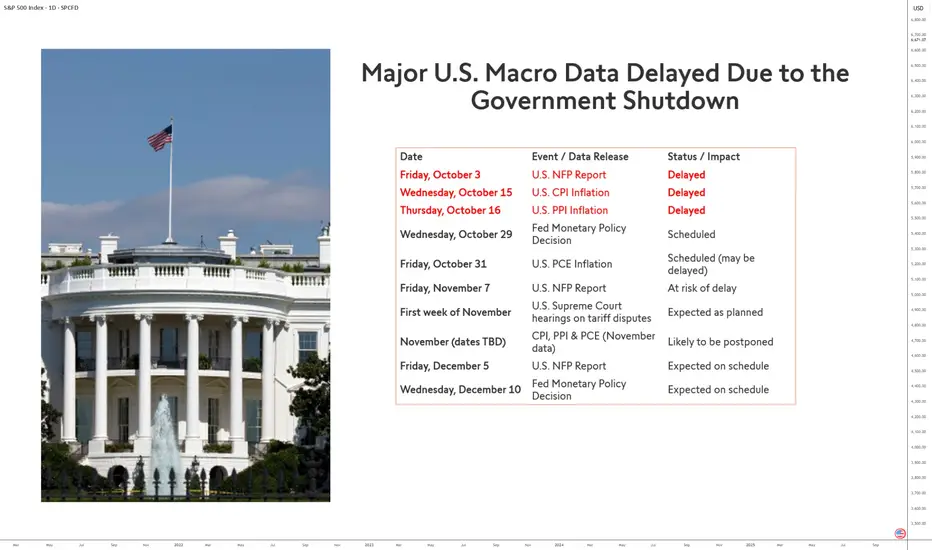
Major Macroeconomic Data Delayed Due to the US govt ShutdownThe recent shutdown of the U.S. government has triggered a domino effect on the release of key macroeconomic indicators. Due to the temporary closure of several federal agencies — notably the Bureau of Labor Statistics (BLS) and the Bureau of Economic Analysis (BEA) — a series of crucial statistics have been delayed, making it more difficult to assess the real-time economic situation of the United States.
A Severely Disrupted Economic Calendar
From early October, several major releases were postponed. The Non-Farm Payrolls (NFP) report scheduled for October 3 was the first casualty and the CPI and PPI inflation indicators on October 15 and 16.
These consecutive delays have disoriented financial markets, depriving them of the statistical benchmarks essential to anticipate the Federal Reserve’s decisions. As a result, visibility on inflation, employment, and consumption trends has been significantly reduced, fueling volatility in U.S. equity markets.
The Fed in the Dark
This disrupted schedule complicates the Fed’s task ahead of its October 29 monetary policy decision, followed by the PCE inflation release on October 31.
Without fresh data, FOMC members will have to rely on partial or outdated information to decide on the path of interest rates. This lack of reliable data could lead the institution to adopt a more cautious stance, postponing any major adjustment to its monetary policy.
Cascading Effects in the Coming Months — Unless the Shutdown Ends in October
The November 7 NFP report and Supreme Court hearings on tariff policies, scheduled for the same week, may also be affected if the shutdown continues. Similarly, November inflation data (CPI, PPI, and PCE) could face further delays, undermining the accuracy of economic forecasts for year-end.
Finally, the December releases — notably the December 5 NFP report and the December 10 Fed meeting — could mark a return to calendar normality, provided the affected agencies manage to catch up on lost time.
In short, the sooner this shutdown episode ends, the faster the overall publication of macroeconomic figures will return to normal.
DISCLAIMER:
This content is intended for individuals who are familiar with financial markets and instruments and is for information purposes only. The presented idea (including market commentary, market data and observations) is not a work product of any research department of Swissquote or its affiliates. This material is intended to highlight market action and does not constitute investment, legal or tax advice. If you are a retail investor or lack experience in trading complex financial products, it is advisable to seek professional advice from licensed advisor before making any financial decisions.
This content is not intended to manipulate the market or encourage any specific financial behavior.
Swissquote makes no representation or warranty as to the quality, completeness, accuracy, comprehensiveness or non-infringement of such content. The views expressed are those of the consultant and are provided for educational purposes only. Any information provided relating to a product or market should not be construed as recommending an investment strategy or transaction. Past performance is not a guarantee of future results.
Swissquote and its employees and representatives shall in no event be held liable for any damages or losses arising directly or indirectly from decisions made on the basis of this content.
The use of any third-party brands or trademarks is for information only and does not imply endorsement by Swissquote, or that the trademark owner has authorised Swissquote to promote its products or services.
Swissquote is the marketing brand for the activities of Swissquote Bank Ltd (Switzerland) regulated by FINMA, Swissquote Capital Markets Limited regulated by CySEC (Cyprus), Swissquote Bank Europe SA (Luxembourg) regulated by the CSSF, Swissquote Ltd (UK) regulated by the FCA, Swissquote Financial Services (Malta) Ltd regulated by the Malta Financial Services Authority, Swissquote MEA Ltd. (UAE) regulated by the Dubai Financial Services Authority, Swissquote Pte Ltd (Singapore) regulated by the Monetary Authority of Singapore, Swissquote Asia Limited (Hong Kong) licensed by the Hong Kong Securities and Futures Commission (SFC) and Swissquote South Africa (Pty) Ltd supervised by the FSCA.
Products and services of Swissquote are only intended for those permitted to receive them under local law.
All investments carry a degree of risk. The risk of loss in trading or holding financial instruments can be substantial. The value of financial instruments, including but not limited to stocks, bonds, cryptocurrencies, and other assets, can fluctuate both upwards and downwards. There is a significant risk of financial loss when buying, selling, holding, staking, or investing in these instruments. SQBE makes no recommendations regarding any specific investment, transaction, or the use of any particular investment strategy.
CFDs are complex instruments and come with a high risk of losing money rapidly due to leverage. The vast majority of retail client accounts suffer capital losses when trading in CFDs. You should consider whether you understand how CFDs work and whether you can afford to take the high risk of losing your money.
Digital Assets are unregulated in most countries and consumer protection rules may not apply. As highly volatile speculative investments, Digital Assets are not suitable for investors without a high-risk tolerance. Make sure you understand each Digital Asset before you trade.
Cryptocurrencies are not considered legal tender in some jurisdictions and are subject to regulatory uncertainties.
The use of Internet-based systems can involve high risks, including, but not limited to, fraud, cyber-attacks, network and communication failures, as well as identity theft and phishing attacks related to crypto-assets.
$SPX As the U.S.–China trade war escalates, new investors might inject liquidity into U.S. markets to maintain strong ties with the U.S. economy.
SP:SPX could keep pushing higher not from peace, but from strategic capital alignment.

US500 OutlookFundamental Analysis
The US500 remains firmly supported by robust large-cap earnings and underlying resilience in the technology and consumer sectors. The index's significant one-year gain of 26% reflects strong corporate balance sheets and continued optimism for economic stability. Recent upward momentum is fueled by strong bank earnings and persistent hopes for Federal Reserve rate cuts. However, near-term sentiment is challenged by elevated volatility stemming from renewed US-China trade tensions and the ongoing government shutdown, alongside warnings that the market is "stretched" in valuation.
Technical Analysis
US 500 closed above 6,650, confirming a continued long term bullish momentum. However, short term technical sentiment is mixed as the index struggles to sustain rallies above its EMA21, which is acting as a cap. Immediate resistance is clustered near the recent all-time highs 6,765. Key support is identified at 6,600 down to the critical downside buffer at 6,550. A breach of the 6,550 support level could signal a definitive end to the current uptrend.
Analysis by Terence Hove, Senior Financial Markets Strategist at Exness

forecast for how it should be forming like 12/6 to 2/19 topping My view of how it should form it this wave . The fear index is in a place bottoms form so what I think is about to happen