SPX into Thursday 16th OctoberMarket has flipped from bullish to bearish,It is trying to unwind that downtrend.Will it succeed.?
Trade ideas
Traders, Investors, and PolicymakersTheir Role in Global Trading.
Introduction
Global trading forms the backbone of the world economy. It connects nations through the exchange of goods, services, capital, and ideas, driving economic growth and innovation. Behind the seamless flow of trade, three critical groups shape its structure and direction — traders, investors, and policymakers. Each group plays a distinct but interconnected role in ensuring that global markets function efficiently, fairly, and sustainably.
Traders facilitate transactions and price discovery; investors allocate capital and influence long-term market trends; policymakers design the legal and institutional framework that governs trade and investment. Together, they create a dynamic balance between market forces and regulations, driving global economic progress.
1. The Role of Traders in Global Trading
1.1 Market Intermediaries and Price Discovery
Traders are the front-line participants in global markets. Their primary function is to buy and sell goods, commodities, currencies, and financial instruments across borders. Through their actions, traders facilitate price discovery — the process by which the value of an asset is determined based on supply and demand.
In global markets, traders operate in multiple forms:
Commodity traders, dealing in oil, metals, agricultural products, etc.
Currency traders (forex traders), influencing exchange rates and liquidity.
Equity and derivatives traders, focusing on stocks, bonds, and financial contracts.
By responding quickly to changing market conditions — such as geopolitical tensions, inflation data, or production shifts — traders ensure that prices reflect real-time global realities. This continuous activity keeps markets liquid and efficient.
1.2 Risk Management and Hedging
Global trade is inherently risky. Prices of commodities and currencies fluctuate constantly due to factors like weather, politics, and global demand. Traders play a critical role in risk management by using derivatives instruments such as futures, options, and swaps.
For example:
An oil producer may hedge future prices by selling crude oil futures contracts.
An importer may buy currency futures to protect against exchange rate volatility.
Such hedging activities stabilize revenues and costs, making international trade more predictable. Traders thus act not merely as profit seekers but also as risk absorbers, helping firms and economies manage uncertainty.
1.3 Liquidity Creation and Market Efficiency
One of the most important functions traders perform is liquidity creation. By continuously buying and selling, they ensure that there is always a counterparty for market participants wanting to enter or exit a trade. Liquidity enhances market efficiency, reducing transaction costs and narrowing bid-ask spreads.
In global markets, high-frequency trading firms, market makers, and institutional traders provide the bulk of this liquidity. Their algorithms process information in microseconds, reacting to changes across global exchanges — from New York to London to Tokyo — creating an interconnected trading ecosystem.
1.4 Speculation and Price Stabilization
While speculation is often criticized, it plays a vital role in price stability. Speculators take positions based on their forecasts of market movements, which often correct price distortions caused by temporary imbalances in supply and demand.
For instance, if a drought threatens wheat production, speculators may buy wheat futures, pushing prices up early. This incentivizes farmers to produce more and consumers to conserve, helping balance the market over time. Thus, traders indirectly contribute to long-term equilibrium through their speculative actions.
2. The Role of Investors in Global Trading
2.1 Capital Allocation and Global Growth
Investors — including individuals, institutions, and sovereign wealth funds — play a foundational role by providing the capital that fuels global trade and development. Their investment decisions determine which countries, industries, and companies receive funding to expand production, improve infrastructure, and innovate.
Foreign Direct Investment (FDI), portfolio investment, and venture capital flows are all forms of global investment that bridge financial gaps between nations. For developing economies, such inflows bring not just capital but also technology, expertise, and access to international markets.
For example, investors in emerging markets like India or Vietnam help create factories, logistics hubs, and export-oriented industries that become integral parts of the global supply chain.
2.2 Long-Term Stability and Confidence
While traders focus on short-term movements, investors typically adopt a long-term outlook. Their steady commitment provides stability and confidence to global markets. Institutional investors like pension funds, mutual funds, and insurance companies deploy capital over years or decades, allowing businesses to plan for sustainable growth.
Moreover, investors’ willingness to hold assets across economic cycles smooths out market volatility and helps economies recover from downturns. For instance, during global recessions, sovereign and institutional investors often continue to fund key projects, preventing total collapse in economic activity.
2.3 Portfolio Diversification and Global Integration
Global investors diversify across countries and asset classes to spread risk and enhance returns. This diversification links markets together — a movement in one region can now affect investment sentiment worldwide.
For example:
A slowdown in China can influence global commodity prices and stock markets.
A rise in U.S. interest rates can trigger capital outflows from emerging markets.
Thus, global investors not only connect financial systems but also transmit economic signals, influencing policymaking and business strategies worldwide.
2.4 Corporate Governance and Ethical Standards
Investors today increasingly focus on Environmental, Social, and Governance (ESG) principles. By choosing where to allocate capital, they exert influence over corporate behavior, encouraging transparency, sustainability, and ethical conduct.
Large institutional investors such as BlackRock or Norway’s sovereign wealth fund use their ownership stakes to push companies toward sustainable practices. In this way, investors act as guardians of global corporate responsibility, ensuring that profits are balanced with long-term social and environmental well-being.
3. The Role of Policymakers in Global Trading
3.1 Creating a Legal and Regulatory Framework
Policymakers — including governments, central banks, and international organizations — set the rules of the global trading system. Their policies determine tariffs, taxes, capital controls, interest rates, and trade agreements.
Without effective policymaking, global markets could descend into chaos. Laws governing intellectual property, labor rights, dispute resolution, and customs procedures ensure fairness and predictability. Institutions such as the World Trade Organization (WTO), International Monetary Fund (IMF), and World Bank coordinate policies among nations to maintain a level playing field.
3.2 Trade Agreements and Economic Diplomacy
One of the key policymaking roles is negotiating trade agreements that define how countries exchange goods and services. Bilateral and multilateral pacts such as the European Union (EU), North American Free Trade Agreement (NAFTA), or Regional Comprehensive Economic Partnership (RCEP) facilitate cross-border commerce.
Through diplomacy, policymakers open new markets, remove barriers, and harmonize standards. These agreements also provide dispute-resolution mechanisms that reduce uncertainty for traders and investors, making global trade smoother and more predictable.
3.3 Monetary and Fiscal Policies
Global trading is deeply influenced by monetary and fiscal policies. Central banks manage interest rates, currency supply, and inflation — all of which affect exchange rates and investment flows. For example:
When the U.S. Federal Reserve raises interest rates, the U.S. dollar strengthens, making imports cheaper and exports less competitive.
Fiscal policies like tax incentives or export subsidies can promote certain industries, shaping trade patterns.
Policymakers must balance domestic goals (such as employment and inflation control) with global competitiveness, ensuring their economies remain resilient in a fluctuating global environment.
3.4 Crisis Management and Market Stabilization
During periods of global crisis — such as financial collapses, pandemics, or wars — policymakers play a stabilizing role. They coordinate interventions like stimulus packages, bailouts, and monetary easing to restore confidence and liquidity in markets.
For instance, during the 2008 global financial crisis, coordinated actions by central banks and governments prevented a deeper economic collapse. Similarly, during the COVID-19 pandemic, massive fiscal and monetary responses helped maintain global trade flows and investment levels despite severe disruptions.
4. Interconnection Between Traders, Investors, and Policymakers
4.1 A Symbiotic Relationship
While their roles differ, traders, investors, and policymakers form a mutually dependent ecosystem.
Traders provide liquidity and efficiency that attract investors.
Investors supply the capital that drives global growth and trade volume.
Policymakers set the structure within which both can operate securely.
For example, a trader may profit from short-term movements created by new policy announcements, while investors adjust long-term strategies based on those same signals. Policymakers, in turn, analyze market reactions to gauge the effectiveness of their decisions.
4.2 Feedback Loops and Global Impact
The actions of one group often influence the others in a feedback loop:
If policymakers tighten monetary policy, investors may withdraw funds, leading traders to adjust their positions.
If traders detect currency instability, policymakers may intervene to stabilize exchange rates.
Investor confidence, reflected in capital inflows or outflows, often guides future policy decisions.
This constant interplay ensures that global trade remains dynamic and adaptive, capable of responding to new challenges and opportunities.
5. Challenges and Future Outlook
5.1 Technological Disruption
The rise of AI-driven trading, blockchain, and digital currencies is reshaping the roles of traders and investors. Algorithms now execute billions of trades daily, while decentralized finance (DeFi) is bypassing traditional intermediaries. Policymakers are challenged to keep pace with this rapid innovation while ensuring transparency and stability.
5.2 Geopolitical Tensions and Protectionism
Trade wars, sanctions, and regional conflicts can disrupt global supply chains. Policymakers must balance national interests with global cooperation. Traders and investors, in turn, must adapt to shifting regulations, tariffs, and political risks — making flexibility and diversification more critical than ever.
5.3 Sustainable and Inclusive Growth
The global trading system is under pressure to become more sustainable and inclusive. Investors are pushing for green finance; policymakers are designing carbon-neutral trade policies; and traders are exploring ethical sourcing. The collaboration between these three groups will determine whether global trade can evolve into a system that benefits both people and the planet.
Conclusion
The story of global trading is not just about goods, currencies, or capital — it’s about the interaction of human decisions across borders and markets. Traders bring liquidity and efficiency; investors provide capital and confidence; and policymakers ensure order and fairness.
Together, they form the three pillars of the global economic structure. Their coordinated actions determine how wealth is created, distributed, and sustained across nations. In an era of technological transformation and geopolitical complexity, their collaboration will be essential for building a resilient, equitable, and sustainable global trading system.
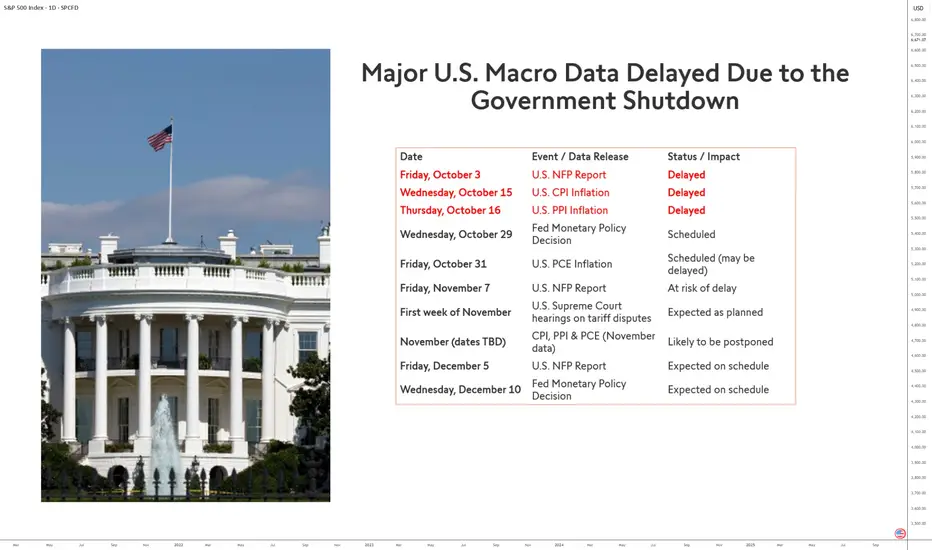
Major Macroeconomic Data Delayed Due to the US govt ShutdownThe recent shutdown of the U.S. government has triggered a domino effect on the release of key macroeconomic indicators. Due to the temporary closure of several federal agencies — notably the Bureau of Labor Statistics (BLS) and the Bureau of Economic Analysis (BEA) — a series of crucial statistics have been delayed, making it more difficult to assess the real-time economic situation of the United States.
A Severely Disrupted Economic Calendar
From early October, several major releases were postponed. The Non-Farm Payrolls (NFP) report scheduled for October 3 was the first casualty and the CPI and PPI inflation indicators on October 15 and 16.
These consecutive delays have disoriented financial markets, depriving them of the statistical benchmarks essential to anticipate the Federal Reserve’s decisions. As a result, visibility on inflation, employment, and consumption trends has been significantly reduced, fueling volatility in U.S. equity markets.
The Fed in the Dark
This disrupted schedule complicates the Fed’s task ahead of its October 29 monetary policy decision, followed by the PCE inflation release on October 31.
Without fresh data, FOMC members will have to rely on partial or outdated information to decide on the path of interest rates. This lack of reliable data could lead the institution to adopt a more cautious stance, postponing any major adjustment to its monetary policy.
Cascading Effects in the Coming Months — Unless the Shutdown Ends in October
The November 7 NFP report and Supreme Court hearings on tariff policies, scheduled for the same week, may also be affected if the shutdown continues. Similarly, November inflation data (CPI, PPI, and PCE) could face further delays, undermining the accuracy of economic forecasts for year-end.
Finally, the December releases — notably the December 5 NFP report and the December 10 Fed meeting — could mark a return to calendar normality, provided the affected agencies manage to catch up on lost time.
In short, the sooner this shutdown episode ends, the faster the overall publication of macroeconomic figures will return to normal.
DISCLAIMER:
This content is intended for individuals who are familiar with financial markets and instruments and is for information purposes only. The presented idea (including market commentary, market data and observations) is not a work product of any research department of Swissquote or its affiliates. This material is intended to highlight market action and does not constitute investment, legal or tax advice. If you are a retail investor or lack experience in trading complex financial products, it is advisable to seek professional advice from licensed advisor before making any financial decisions.
This content is not intended to manipulate the market or encourage any specific financial behavior.
Swissquote makes no representation or warranty as to the quality, completeness, accuracy, comprehensiveness or non-infringement of such content. The views expressed are those of the consultant and are provided for educational purposes only. Any information provided relating to a product or market should not be construed as recommending an investment strategy or transaction. Past performance is not a guarantee of future results.
Swissquote and its employees and representatives shall in no event be held liable for any damages or losses arising directly or indirectly from decisions made on the basis of this content.
The use of any third-party brands or trademarks is for information only and does not imply endorsement by Swissquote, or that the trademark owner has authorised Swissquote to promote its products or services.
Swissquote is the marketing brand for the activities of Swissquote Bank Ltd (Switzerland) regulated by FINMA, Swissquote Capital Markets Limited regulated by CySEC (Cyprus), Swissquote Bank Europe SA (Luxembourg) regulated by the CSSF, Swissquote Ltd (UK) regulated by the FCA, Swissquote Financial Services (Malta) Ltd regulated by the Malta Financial Services Authority, Swissquote MEA Ltd. (UAE) regulated by the Dubai Financial Services Authority, Swissquote Pte Ltd (Singapore) regulated by the Monetary Authority of Singapore, Swissquote Asia Limited (Hong Kong) licensed by the Hong Kong Securities and Futures Commission (SFC) and Swissquote South Africa (Pty) Ltd supervised by the FSCA.
Products and services of Swissquote are only intended for those permitted to receive them under local law.
All investments carry a degree of risk. The risk of loss in trading or holding financial instruments can be substantial. The value of financial instruments, including but not limited to stocks, bonds, cryptocurrencies, and other assets, can fluctuate both upwards and downwards. There is a significant risk of financial loss when buying, selling, holding, staking, or investing in these instruments. SQBE makes no recommendations regarding any specific investment, transaction, or the use of any particular investment strategy.
CFDs are complex instruments and come with a high risk of losing money rapidly due to leverage. The vast majority of retail client accounts suffer capital losses when trading in CFDs. You should consider whether you understand how CFDs work and whether you can afford to take the high risk of losing your money.
Digital Assets are unregulated in most countries and consumer protection rules may not apply. As highly volatile speculative investments, Digital Assets are not suitable for investors without a high-risk tolerance. Make sure you understand each Digital Asset before you trade.
Cryptocurrencies are not considered legal tender in some jurisdictions and are subject to regulatory uncertainties.
The use of Internet-based systems can involve high risks, including, but not limited to, fraud, cyber-attacks, network and communication failures, as well as identity theft and phishing attacks related to crypto-assets.
$SPX As the U.S.–China trade war escalates, new investors might inject liquidity into U.S. markets to maintain strong ties with the U.S. economy.
SP:SPX could keep pushing higher not from peace, but from strategic capital alignment.

US500 OutlookFundamental Analysis
The US500 remains firmly supported by robust large-cap earnings and underlying resilience in the technology and consumer sectors. The index's significant one-year gain of 26% reflects strong corporate balance sheets and continued optimism for economic stability. Recent upward momentum is fueled by strong bank earnings and persistent hopes for Federal Reserve rate cuts. However, near-term sentiment is challenged by elevated volatility stemming from renewed US-China trade tensions and the ongoing government shutdown, alongside warnings that the market is "stretched" in valuation.
Technical Analysis
US 500 closed above 6,650, confirming a continued long term bullish momentum. However, short term technical sentiment is mixed as the index struggles to sustain rallies above its EMA21, which is acting as a cap. Immediate resistance is clustered near the recent all-time highs 6,765. Key support is identified at 6,600 down to the critical downside buffer at 6,550. A breach of the 6,550 support level could signal a definitive end to the current uptrend.
Analysis by Terence Hove, Senior Financial Markets Strategist at Exness

forecast for how it should be forming like 12/6 to 2/19 topping My view of how it should form it this wave . The fear index is in a place bottoms form so what I think is about to happen
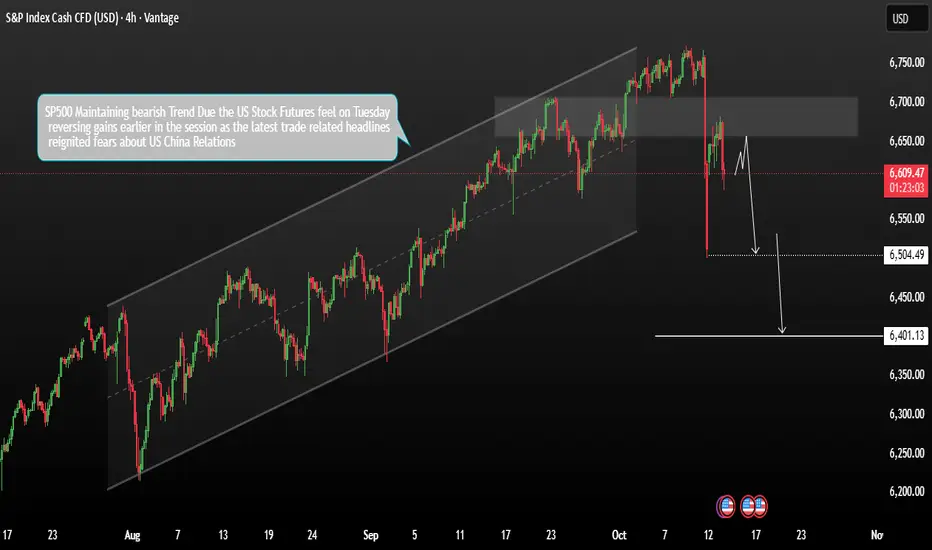
SP500Consoldation Could Next falling patternSP500 Price consolidation a bearish trend due the U.S. stock futures fell on Tuesday, reversing earlier gains as renewed concerns over U.S.–China trade relations weighed on sentiment. The latest trade-related headlines reignited fears of escalating tensions between the two economic powers.
These moves followed a sharp rebound on Wall Street Monday, when President Donald Trump struck a softer tone toward China. That came after last week’s threats of 100% tariffs on Chinese goods, which had erased roughly $2 trillion in market value.
Technical Analysis
The S&P 500 appears to be consolidating after recent volatility Bearish bias emerging following a failed breakout at key resistance the index reversed from the resistance zone, suggesting sellers are regaining control a potential shift to the downside remains in play, with near-term targets at 6,510 and 6,401
You may find more details in the chart.
Trade wisely best of Luck.
Ps; Support with like and comments for better analysis Thanks for Supporting.
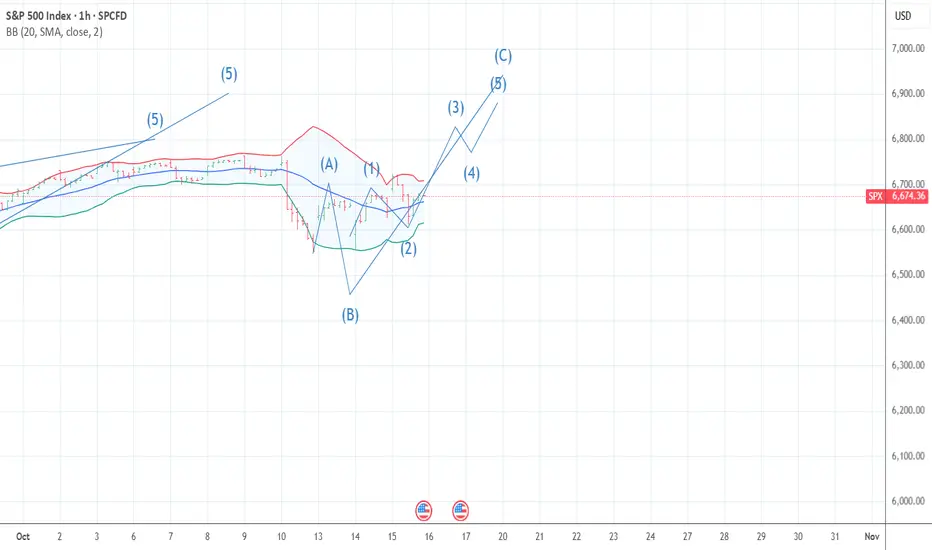
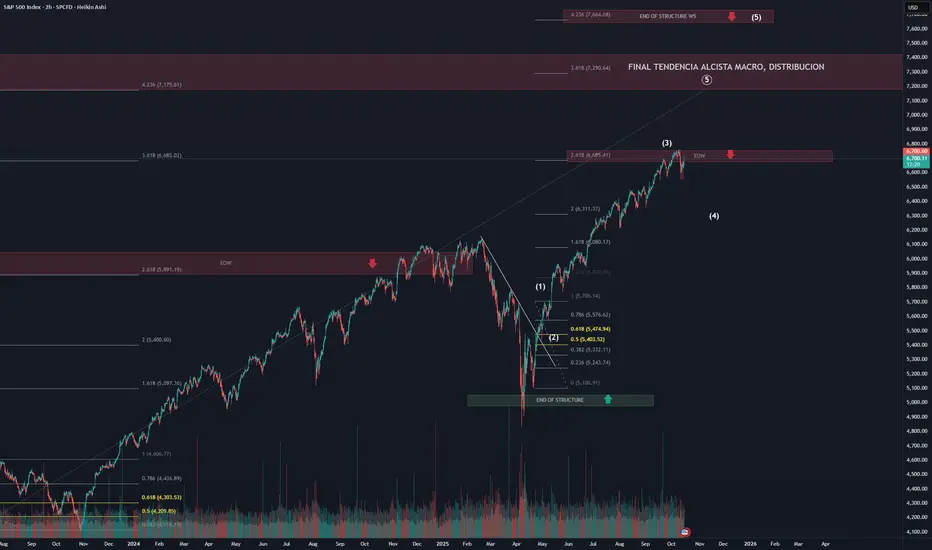
SPX Bullish Trend / Elliot analysisOur analysis of this index suggests that we are currently in the development of a Wave 4 (W4) within the last bullish substructure of the macro fifth wave, where, in the long term, we could potentially see the end of the trend between the 7100 and 7600 levels.
At the moment, the price appears to be moving within the final substructure, which seems about to begin a Wave 4 (W4) correction.
💡 This is just my opinion — always remember to do your own analysis!
SPX 500 extends recovery as traders watch US-China situationAfter breaking above 6677 yesterday, the S&P 500 created a higher high on the intraday charts, and so today's gains were a continuation of that move. But the index has now arrived into the next potential resistance area between 6720-6740, which was a key short-term support zone before the breakdown we saw on Friday. Could we see some volatility around this zone now?
Risk appetite returned overnight, with US index futures climbing to new weekly highs, even though European markets showed a more mixed performance. In currencies, the US dollar index retreated against most major peers, surrendering part of its recent gains. Market sentiment this week reflects a cautious blend of optimism and restraint. Expectations for Federal Reserve rate cuts remain the key driver, underpinning risk appetite even as gold extends its record-breaking rally beyond $4,200.
Investors appear largely unfazed by renewed US–China trade tensions, brushing off President Trump’s latest warning on cooking oil imports. Meanwhile, solid US bank earnings have bolstered confidence in corporate resilience, keeping equities supported despite the ongoing US government shutdown. Adding to the upbeat tone this morning, French political tensions eased after Prime Minister Sébastien Lecornu announced a delay to his contentious pension reform plan.
But with the US-China tensions back at the forefront, could investors start taking profits on their long equity trades to cause a bit of selling pressure now?
by Fawad Razaqzada, market analyst with FOREX.com

SPX500 | HULL MA & Fibo Confluence Setting Up the Move!🎯 SPX500: The "Polite Thief" Strategy - Stealing Profits Like a Gentleman 🎩💰
📊 Market Overview
Asset: SPX500 (S&P 500 Index CFD)
Trade Type: Swing/Day Trade Opportunity
Bias: Bullish 🐂
Strategy Style: Multi-Layer Entry (The "Thief Method")
🔍 Technical Setup
The Plan: We're eyeing a bullish confirmation with a clean retest/pullback at the 38.2% Fibonacci level, aligned beautifully with our HULL Moving Average. This confluence zone is screaming "buy the dip" louder than your portfolio manager at a market crash! 📈
🎯 Entry Strategy Options:
Option 1: The "Polite Thief" Multi-Layer Approach
Instead of going all-in like it's a Vegas buffet, we're using calculated limit orders:
📍 Layer 1: 6620
📍 Layer 2: 6640
📍 Layer 3: 6660
📍 Layer 4: 6680
Feel free to add more layers based on your account size and risk appetite!
Option 2: Market Execution
Jump in at any current price level if the setup confirms during live hours.
🛡️ Risk Management
Stop Loss: 6580
⚠️ Disclaimer: Dear Ladies & Gentlemen (Thief OG's), this is MY stop loss based on MY analysis. You're the captain of your own ship! 🚢 Set your risk parameters according to YOUR comfort level and account size. Risk management is YOUR responsibility.
💎 Profit Target
Target Zone: 6860
This level represents our "Electric Shock Wall" 🔌⚡ - a confluence of:
Strong historical resistance
Overbought territory potential
Bull trap zone (where late entries get caught)
Exit Strategy Note: I'm not your financial advisor! 💼 When you see green, secure those gains at YOUR discretion. The market doesn't care about our targets - take profit when YOU feel comfortable!
🌐 Related Pairs to Watch
Keep your eyes on these correlated instruments:
📈 AMEX:SPY (S&P 500 ETF) - Moves in lockstep with SPX500; watch for volume confirmation
📈 NASDAQ:QQQ (Nasdaq-100 ETF) - Tech-heavy index; bullish momentum here supports SPX strength
📈 AMEX:DIA (Dow Jones ETF) - Broader market sentiment indicator
📈 TVC:VIX (Volatility Index) - Inverse correlation; falling VIX = bullish for equities
💵 TVC:DXY (US Dollar Index) - Typically inverse to equities; weakening dollar supports stocks
Key Correlation: When tech leads (QQQ pumping), SPX usually follows. Watch for VIX to stay subdued below 15 for sustained bullish momentum.
📝 Key Technical Points
✅ 38.2% Fibonacci retracement acting as dynamic support
✅ HULL Moving Average confluence strengthens the setup
✅ Multi-layer entry reduces average cost and timing risk
✅ Clear risk/reward structure with defined zones
✅ Resistance zone identified for disciplined exits
⚡ The "Thief Strategy" Philosophy
We're not robbing the market - we're borrowing profits with permission! 😉 The layered entry approach allows us to build positions like a professional, not gamble like a reckless amateur. Scale in, scale out, and live to trade another day!
✨ If you find value in my analysis, a 👍 and 🚀 boost is much appreciated — it helps me share more setups with the community!
⚠️ Final Disclaimer
IMPORTANT: This "Thief Style" trading strategy is for educational and entertainment purposes only! 🎪 This is NOT financial advice. I'm sharing my personal analysis and trade ideas - what you do with your money is 100% YOUR decision. Trade at your own risk, manage your own capital, and never risk more than you can afford to lose. Past performance doesn't guarantee future results. Always do your own research! 🔍
#SPX500 #SP500 #TradingIdeas #SwingTrading #DayTrading #TechnicalAnalysis #FibonacciRetracement #SupportAndResistance #RiskManagement #TradingStrategy #StockMarket #IndexTrading #ThiefStrategy #LayeredEntry #PriceAction #MarketAnalysis #TradingCommunity #ChartAnalysis

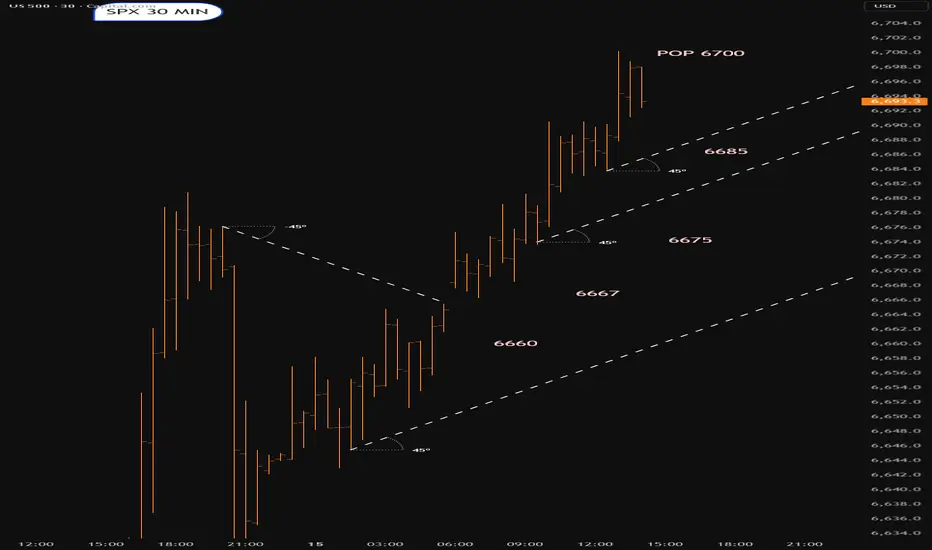
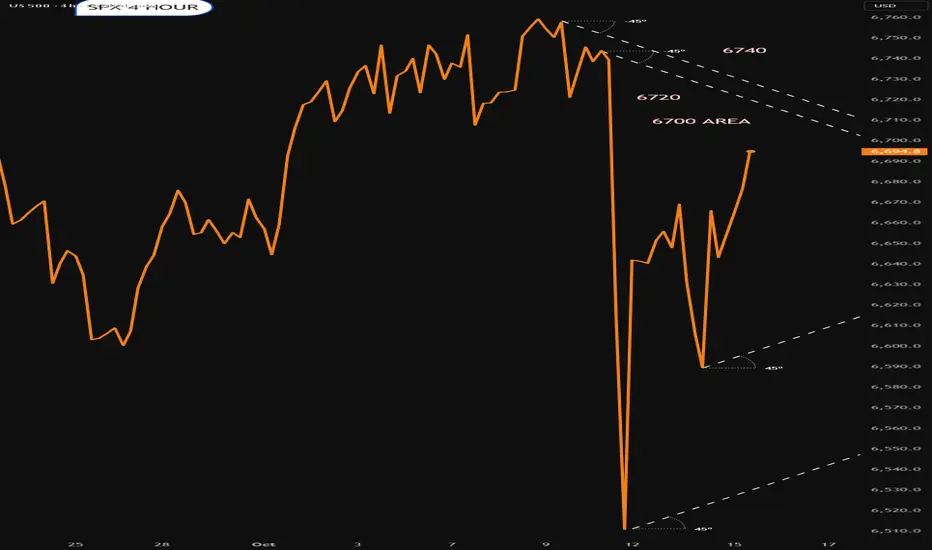
Less bars ...More tequilaGo up a timeframe.Much clearer.I have ignored a spike downwards.6700 to pop.?
S{X looking a tad over stretched/ short termCareful...Looks a tad over stretched.Could still pump though.Lets see what happens

SPX500 Long From Support!
HI,Traders !
#SPX500 made a retest
Of the wide horizontal
Support level of 6581.19
And a local rebound is
Already taking place so
We are bullish baised
And we think that a local
Bullish correction is to
Be expected !
Comment and subscribe to help us grow !


SPX500 Weakens as Markets Focus on Fed Rate-Cut HintsSPX500 – Overview | Bearish Pressure Below 6,699
Markets are focusing back on the Federal Reserve after Chair Jerome Powell hinted at the possibility of further rate cuts, calming investor sentiment despite lingering U.S.–China trade tensions.
For now, optimism around policy easing is offset by uncertainty in risk assets.
🕯 Technical Outlook
The price has reached resistance at 6,699 and is now stabilized below it, suggesting potential for further downside.
As long as price trades below 6,699, momentum remains bearish, targeting 6,670 → 6,634.
A 1H close above 6,700 would shift momentum bullish, opening the path toward 6,754.
Pivot: 6,699
Support: 6,670 – 6,635 – 6,609
Resistance: 6,717 – 6,754 – 6,791

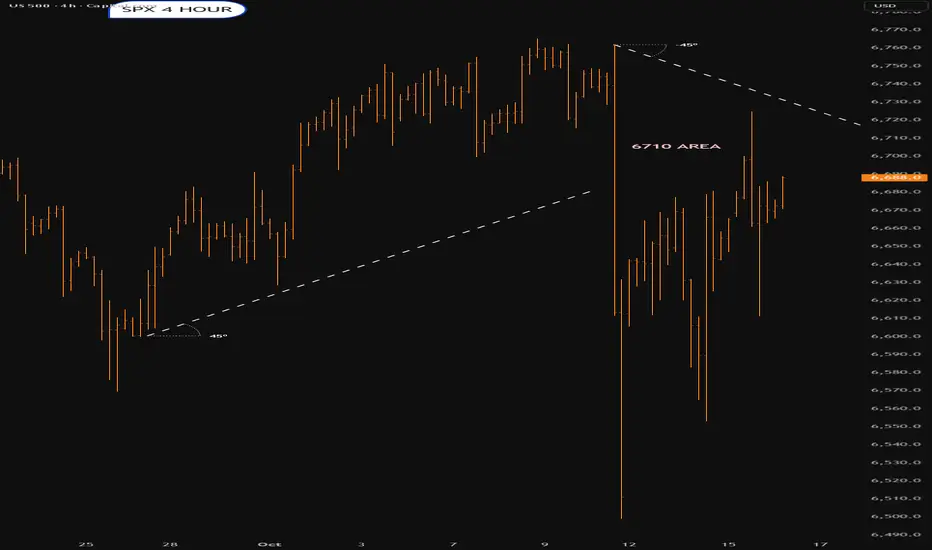
SPX500USD | Daily Analysis #3**Yesterday Review**
As observed, the index reacted to the 6682 zone, and news from China stating, "China will maintain tariffs until the end," fueled the market with sellers, pushing the price to the lower zone at 6584. In the morning of the New York session, it appeared that Trump realized the importance of offering a positive signal or message, or the index would suffer significantly. After a strong battle between buyers and sellers on the 1-hour timeframe, the price began to rise, driven by buying pressure.
During the middle of the New York session, Trump found an opportunity to provide some optimism, announcing a scheduled meeting with Chinese President Xi in South Korea on November 1st to discuss trade matters. (This could be a significant day.) This news contributed to a bounce, pushing the price back up to 6682.
**1-Hour & 4-Hour Timeframes**
On the 1-hour timeframe, two potential patterns are forming. One is a box range between 6682 and 6585, and the other is an upward trend channel. However, neither pattern is fully respected due to limited confirmation.
On the 4-hour timeframe (although I cannot share an image here), if you draw two lines—one starting from February 25, 2025, and the other from August 12, 2025—and extend them to the right, you'll notice a clear respect and relationship between these lines.
**Current Situation**
As of the time I am posting this analysis, the price is currently testing below the trendline, and we are awaiting a reaction. If the index, with or without further news, breaks the 6682 zone or the trendline strongly, we could expect the price to reach the 6672 zone. On the other hand, if the price respects the box or the upward trend channel, the index may find support and rise toward the 6604 area.

How Spot Forex Trading Works1. Understanding the Concept of Spot Forex Trading
Spot Forex trading, also known as spot FX, refers to the direct exchange of one currency for another at the current market rate, known as the spot price. Unlike futures or options contracts, where settlement happens at a later date, a spot transaction is settled “on the spot”, typically within two business days (T+2) for most currency pairs.
The Forex market is the largest and most liquid financial market globally, with a daily trading volume exceeding $7 trillion. It operates 24 hours a day, five days a week, allowing traders from around the world to speculate on currency price movements. Spot Forex trading forms the foundation of global currency trading, providing real-time exchange of currencies between participants such as banks, corporations, investors, and retail traders.
2. The Participants in the Spot Forex Market
The Spot Forex market involves multiple participants who trade for different purposes:
Central Banks – Manage currency reserves, stabilize exchange rates, and implement monetary policies.
Commercial Banks and Financial Institutions – Facilitate interbank trading and currency exchange for clients.
Multinational Corporations – Exchange currencies for international trade and investment purposes.
Hedge Funds and Investment Firms – Engage in speculative trading to profit from currency fluctuations.
Retail Traders – Individuals using online platforms to speculate on short-term price movements.
Each participant contributes to market liquidity, influencing price dynamics based on supply and demand.
3. Currency Pairs and Price Quotation
In the Forex market, currencies are always traded in pairs, such as EUR/USD, GBP/JPY, or USD/INR. The first currency is the base currency, and the second is the quote currency.
The price quote represents how much of the quote currency is required to buy one unit of the base currency. For example, if EUR/USD = 1.0900, it means 1 Euro = 1.09 US Dollars.
Each pair has:
Bid Price – The price at which the market (or broker) is willing to buy the base currency.
Ask Price – The price at which the market (or broker) is willing to sell the base currency.
The difference between these two is called the spread, which represents the broker’s commission or transaction cost.
4. How Spot Forex Transactions Are Executed
Spot Forex trading operates through over-the-counter (OTC) networks rather than centralized exchanges. When a trader places a buy or sell order on a trading platform, the broker executes it through liquidity providers or the interbank market.
For instance, if a trader buys EUR/USD, they are effectively buying Euros while selling US Dollars at the current spot rate. The transaction is typically settled within T+2 days, though in practice, many brokers offer rolling spot contracts, which are automatically extended daily for speculative purposes.
Execution types include:
Market Orders – Executed instantly at the best available price.
Limit Orders – Executed when the market reaches a specified price level.
Stop Orders – Triggered when the price crosses a set threshold to limit losses or capture breakouts.
5. The Role of Leverage in Spot Forex Trading
Leverage is one of the most distinctive features of the Forex market. It allows traders to control large positions with relatively small amounts of capital. For example, a 1:100 leverage ratio means that a trader can control a $100,000 position with only $1,000 of margin.
While leverage amplifies potential profits, it also magnifies losses, making risk management essential. Professional traders typically use moderate leverage and implement stop-loss mechanisms to protect against adverse movements.
Regulators in different regions impose varying limits on leverage — for example, 1:30 in the EU (ESMA regulations) and 1:50 in the US.
6. Determinants of Spot Forex Prices
Spot exchange rates are influenced by numerous macroeconomic, geopolitical, and technical factors:
Interest Rate Differentials: Higher interest rates attract foreign capital, boosting demand for the currency.
Economic Indicators: GDP growth, employment data, inflation, and trade balances affect currency valuation.
Central Bank Policies: Monetary tightening or loosening directly impacts currency strength.
Political Stability: Political risk or uncertainty weakens investor confidence, depreciating the currency.
Market Sentiment and Speculation: Traders’ collective expectations drive short-term fluctuations.
Global Events: Wars, pandemics, and natural disasters can trigger volatility across the Forex market.
In short, Forex prices are a reflection of global economic health and investor confidence.
7. Profit and Loss Calculation in Spot Forex
The profit or loss in a spot Forex trade is determined by the change in exchange rate between the time the position is opened and closed.
For example, if a trader buys EUR/USD at 1.0900 and sells it later at 1.1000, they gain 100 pips (the fourth decimal point represents a pip in most pairs).
Profit calculation formula:
Profit (USD)
=
Pip Movement
×
Lot Size
×
Pip Value
Profit (USD)=Pip Movement×Lot Size×Pip Value
For a standard lot (100,000 units), one pip in EUR/USD equals $10. Thus, a 100-pip move equals $1,000 profit.
Conversely, if the trade moves against the trader, losses occur at the same rate. Hence, understanding position sizing and pip value is crucial for effective risk management.
8. Settlement and Delivery in Spot Forex
While traditional spot Forex transactions involve physical delivery of currencies within two business days, retail traders rarely take delivery. Instead, brokers provide contract-based trading that simulates real exchange but is settled through cash differences in profit or loss.
For institutional participants, however, settlement occurs through systems like CLS (Continuous Linked Settlement), which eliminates settlement risk by synchronizing payments between major financial institutions globally.
Thus, while the spot market technically implies immediate delivery, in practice, most participants engage for speculative or hedging purposes without currency delivery.
9. Risk Management in Spot Forex Trading
Spot Forex trading carries inherent risks due to volatility, leverage, and unpredictable global events. To mitigate these, traders adopt structured risk management strategies:
Stop-Loss and Take-Profit Orders – Automatically close positions at predefined levels to control losses or lock in profits.
Position Sizing – Limiting trade size relative to account equity, often 1–2% per trade.
Diversification – Avoiding concentration in one currency pair or region.
Economic Calendar Monitoring – Tracking major events like central bank meetings and GDP releases to anticipate volatility.
Technical and Fundamental Analysis – Combining chart patterns with macroeconomic insights to make informed decisions.
Effective risk management ensures long-term sustainability and consistent returns in the Forex market.
10. Advantages and Challenges of Spot Forex Trading
Advantages:
High Liquidity: Tight spreads and minimal slippage due to massive global participation.
24/5 Availability: Traders can operate across global time zones without limitation.
Low Entry Barriers: Retail traders can start with small capital using micro or mini accounts.
Leverage Access: Enables higher market exposure with limited funds.
No Centralized Exchange: Global accessibility through OTC trading networks.
Challenges:
High Volatility: Sharp fluctuations can trigger significant losses.
Leverage Risk: Over-leveraging can wipe out accounts quickly.
Information Overload: Constant economic updates require active monitoring.
Broker Reliability: Unregulated brokers pose counterparty risks.
Psychological Pressure: Emotional control is essential for success in a fast-paced market.
Despite these challenges, spot Forex trading remains one of the most popular avenues for both institutional and retail investors due to its liquidity, flexibility, and potential for profit.
Conclusion
Spot Forex trading represents the core of the global currency market, enabling participants to exchange currencies directly at real-time rates. Its structure—comprising major participants, dynamic pricing, leverage, and decentralized execution—creates immense opportunities and risks alike. Understanding how the market functions, the economic forces behind exchange rates, and effective risk management techniques is crucial for success. Whether used for speculation, hedging, or international trade, the Spot Forex market remains a cornerstone of global finance, reflecting the heartbeat of the world’s economic and political landscape.
Bulls fight back but bearish signals lingerRecent mixed price and momentum signals on the S&P 500 suggest traders should keep an open mind on whether to play the index from the long or short side in the near term.
For the bulls, the strong bounce from a zone comprising the 50-day moving average and May 23 uptrend over the past two sessions suggests the buy-the-dip trade remains alive despite Friday’s sharp pullback, pointing to the potential for an eventual retest of the record high at 6766.
However, bearish divergence with RSI (14) raises questions about the sustainability of the move, especially with MACD having already crossed the signal line from above before proceeding to trend lower. Bullish momentum is weakening, not building, likely keeping bears interested for the moment.
For those looking to play the index from the long side, there are few setups worth considering. If we were to see a break above 6700 resistance, longs could be established above the level with a stop below, targeting the record high of 6766 initially. Alternatively, another pullback and bounce from the 50DMA/May uptrend support zone would provide a decent entry level, allowing for longs to be set with a stop below for risk management purposes. Potential targets include Tuesday’s high, 6700 or 6766.
For the bears, a failure to clear 6700 resistance would create a short setup, allowing for trades to be established beneath the level with a stop above for protection. The 50DMA/May uptrend support zone screens as a logical initial target, with 6500 and 6360 other options after that.
Good luck!
DS

S&P 500 (SPX) Technical Outlook Moving Forward Overview
The S&P 500 remains in a clear upward trajectory despite last Friday’s sharp selloff. The drop was largely imminent after a historic rally from the April tariff lows, with the index marking consecutive all-time highs before facing resistance at the upper boundary of the long-term ascending channel that has guided price action since 2021. While the broader trend remains intact, the recent rejection signals a potential shift in market dynamics, suggesting that momentum may be cooling. Moving forward, the environment appears more balanced between opportunity and risk, as active traders we should approach it with flexibility and an open mindset.
Key Scenarios
1. Scenario 1 – 15% Correction (Bearish Pullback)
• Target: 5673 - 2024 ATH
• This scenario represents a deeper, healthy correction following the parabolic move from 2023 to 2025.
• It aligns with the lower boundary of the long-term trend channel and prior support zones.
• A move of this scale would likely be triggered by macro tightening, earnings contraction, or a geopolitical shock.
2. Scenario 2 – 10% Correction (Healthy Pullback)
• Target: 6,147 - 2025 ATH
• A milder correction that would bring SPX back toward the February 2025 ATH region.
• This would reset market sentiment from current greed levels without breaking the broader bullish structure.
• It’s the most probable near-term scenario if momentum stalls below the 7,000 mark.
3. Scenario 3 – Euphoria and Extreme Greed (Bullish Extension)
• Target: 7,000+ (psychological level)
• If risk appetite remains strong and macro data stays resilient, the SPX could extend higher into an overbought “euphoria phase.”
• This would likely form a short-term blow-off top before a correction later in 2026.
Conclusion
The S&P 500 remains structurally bullish, but risk-reward is increasingly skewed to the downside in the short term.
• Key resistance: 7,000 psychological level
• Key supports: 6,150 (10% correction) and 5,670 (15% correction)
Remain cautious of potential exhaustion above current highs however long-term investors and trend followers can remain constructive as long as the price respects the ascending channel.
Good luck !
Ghost

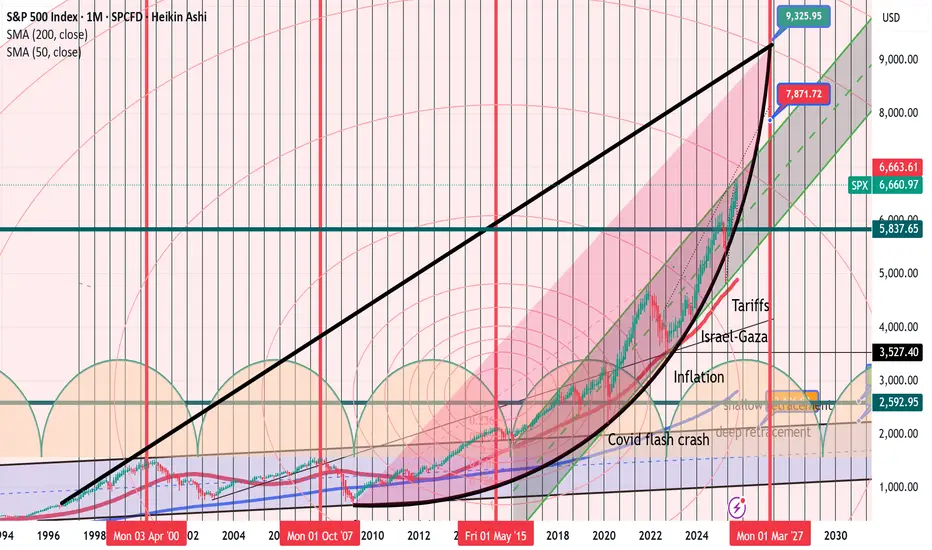
Small fish follow the streamUpdate: My best case scenario. 9000 points in a massive bull run that started in 2009. Hyperbolic move since then.
Top in March 2027
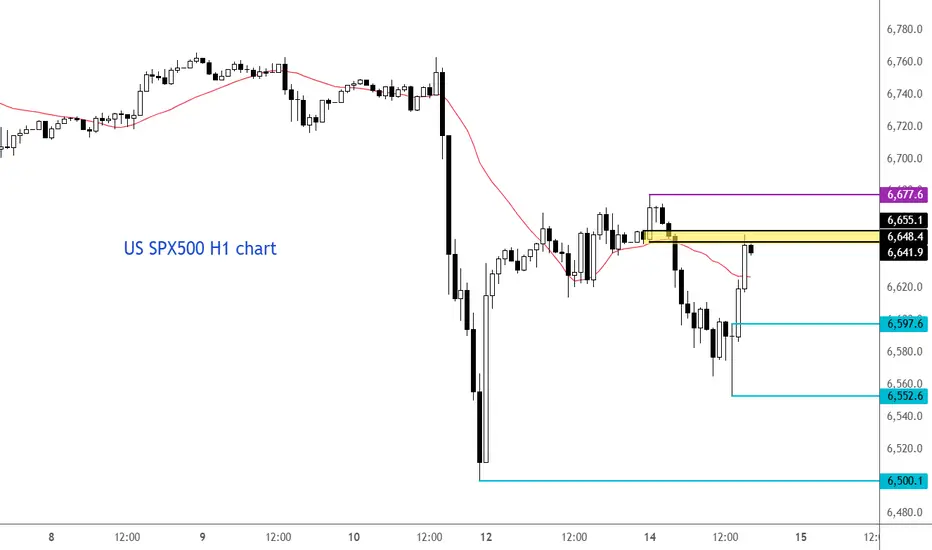
S&P 500 testing resistance after bouncing off lowsMarkets recovered sharply from their earlier lows on the back of comments from US Trade Representative Jamieson Greer, who told CNBC that Donald Trump was still set to meet Chinese premier Xi Jinping. But it remains to be seen whether the US and China will come to some sort of an agreement, perhaps an extension of the tariff truce. That scenario looks more likely than a complete breakdown into a full-blown trade war. However, the risks are undeniably rising.
Anyway, the SPX500 is now testing key resistance here between 6648 to 6655, marked in yellow on the chart. Unless it goes on to make a higher high above 6677 on this hourly chart, and hold above it, there is still the risk we could see another dip as we head deeper in the US session.
By Fawad Razaqzada, market analyst with FOREX.com
S&P 500 The Bull Run Is Over. Watch the Yellow Level.The S&P 500 rally looks exhausted.
Over the past week, momentum has clearly faded, lower highs, weaker daily closes, and stronger selling pressure on each bounce.
Technically, the market shows early signs of a shift from bullish to corrective or bearish.
The Yellow Level acts as a divider between a mildly bullish market and the start of a medium-term bearish phase.
Above the Yellow Level: price may hold short-term strength or consolidation.
Below the Yellow Level: structure breaks down and downside potential expands.
A daily close below the Yellow Level would confirm the beginning of a broader bearish move.
In my view i suggest all the Trader/Investor which they are reading this to stay AT LEAST 80/90% IN CASH. something is about to happen... stay safe!
