How to turn $100 into $1,000,000 through trading?
The answer — You can’t..
Yes, theoretically you can imagine a chain of unbelievable coincidences, aggressive risk-taking, and pure luck. But in reality, that path almost always ends with a blown account long before any meaningful growth happens.
However, most people who enter this field genuinely
S&P 500 Index
No trades
About S&P 500 Index
Standard & Poor’s 500 is an American stock market index consisting of 500 large companies having common stock listed on the NYSE or NASDAQ and their market capitalizations. It captures approximately 80% coverage of available market capitalization. Because it includes both growth stocks and value stocks it is one of the most followed equity indices and is considered to be one of the best representations of the U.S. stock market and a trend indicator for the U.S. economy. S&P introduced its first index in 1923 and its present day form on March 4,1957. It was developed and continues to maintained by S&P Dow Jones Indices, a joint venture majority owned by McGraw Hill Financial.

S&P 500: Late-Cycle Signals Are BuildingThe S&P 500 is still holding near highs, but under the surface, things are starting to weaken. Both the chart and the economy are sending warning signs that are easy to miss if you only look at price.
Weekly Bearish Divergence
On the weekly chart, price made higher highs, but momentum did not .

Hellena | SPX500 (4H): LONG to 7048 area (MAX of wave "1").Colleagues, the price continues to move in an upward five-wave impulse.
At the moment, I am considering a movement in wave “3” of medium order to the area of 7048 (the main thing here is the update of the maximum of wave “1”).
In principle, everything is quite simple in terms of wave construction, a

The Psychology of Holding Winners🧠 The Psychological Paradox of Trading
There is a paradox at the center of trading behavior that almost every trader experiences but very few truly deconstruct.
🟢 When a position is profitable, the urge to close it becomes overwhelming.
🔴 When a position is losing, the urge to “give it more time”

US500: Eyes on 7,050 & 7,100 TargetsUS500: Eyes on 7,050 & 7,100 Targets
US500 is consolidating just beneath a well-defined intraday resistance zone around 6,990–7,000 after a strong impulsive move off the recent swing low.
Price has built a classic flag pattern that often precedes expansion.
A movement above the 6990 area would

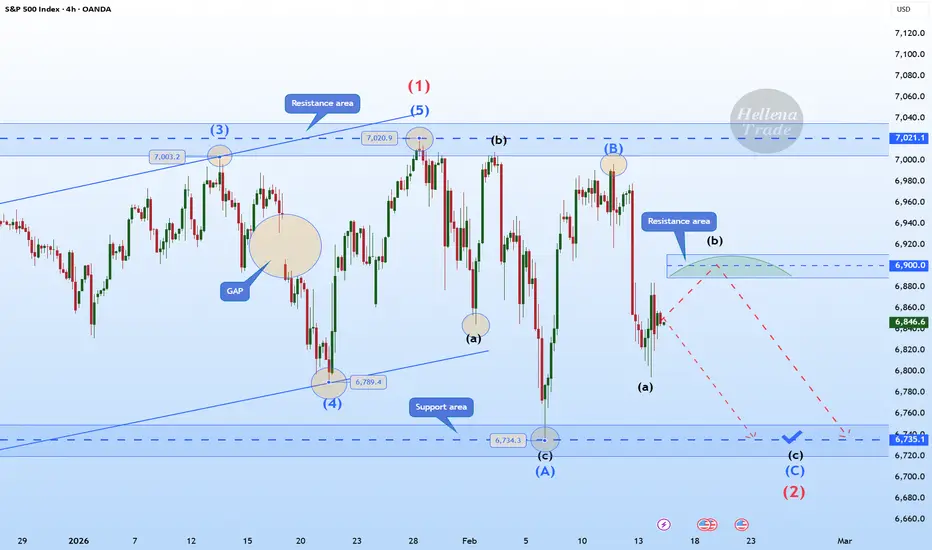
Hellena | SPX500 (4H): SHORT to support area of 6735.Colleagues, it seems that we are facing a combined correction, which means that wave “2” is not yet complete and we should expect a price decline to the support area of 6735, where I think we should take profits.
As part of a small “abc” correction, it is possible to reach the 6900 area before the
SPX - Covid style decline to repeat?It might be crazy idea, but SPX could experience another Covid 2020 style decline starting next week.
In late December I posted idea of a 35%+ decline in the market in 1H of 2026 (linked below), highlighting rotation away from growth/risk to value/safe assets. I anticipated few more weeks of chop

S&P 500: Retest Done — Next Push to New ATH?The S&P 500 index ( SP:SPX ) completed its downward movement as I expected in the previous idea (full target) .
Currently, the S&P 500 index has managed to break the resistance zone($6,956-$6,918) and is completing a pullback to this zone.
In terms of Elliott wave theory, it seems that the S&P 5

S&P500 is it about to crash due to a Global Liquidity peak??S&P500 (SPX) has been rising non-stop within its 3-year Bull Cycle following the October 2022 market bottom of the 2022 Inflation Crisis Bear Cycle. Such Bear Cycles are systemic and take place periodically on the long-term scale. Since the 2009 bottom of the U.S. Housing Crisis, those Bear Cycles h

SP500 Consolidation a bullish mid rangeSP500 Price is trading within a rising and maintaining a broader bullish structure despite recent volatility the market found strong demand near the lower boundary of the channel, followed by an impulsive bullish recovery signalling buyers stepping back in with strength.
Currently, price is consoli

See all ideas
Displays a symbol's value movements over previous years to identify recurring trends.
Frequently Asked Questions
S&P 500 Index reached its highest quote on Jan 28, 2026 — 7,013.7 USD. See more data on the S&P 500 Index chart.
The lowest ever quote of S&P 500 Index is 665.6 USD. It was reached on Mar 6, 2009. See more data on the S&P 500 Index chart.
S&P 500 Index is just a number that lets you track performance of the instruments comprising the index, so you can't invest in it directly. But you can buy S&P 500 Index futures or funds or invest in its components.