SPX: Powell saved the weekThe US equity markets were traded in a more pessimistic way during the previous week, however, a speech held by Fed Chair Powell at Jackson Hole Symposium changed the sentiment on Friday. The market turned from pessimistic to optimistic, after Chair Powell signalled the possibility of easing monetary policy in the coming period, implying potential rate cut. The market expectations shifted, as posted by CME Fed WatchTool investors sentiment jumped to 83% odds for a rate cut in September. All US equity indices gained on Friday, with S&P 500 adding 1,52% and closing the week at 6.466. However, with Friday's move the index only covered losses from the previous four days of the week, adding a modest 0,3% for the week.
Stocks of tech companies traditionally surged on positive news on potential rate cuts. However, this time the market was also driven by a surge in stocks of construction companies as well as the financial industry. Namely, the market estimated that these industries might benefit the most from decreased interest rates. It might be expected that the positive sentiment will hold on financial markets at least for the week ahead. It should be considered that Friday brings the PCE Price index in July, in which sense, some higher volatility might be expected on this day, in case that July figures do not meet market expectations.
SPX500 trade ideas
sp500 prepares for a retracement fibonacci speaks clearly, we are ready for a bearish leg, which could bounce into the clear support, and which coincides with fibonacci 38.2, to continue its run, up to the illustrated area, made with the fibonacci reversal.

SP500 4H Trading Outlook for Major Currency Pairs and Indices, Especially Gold and Silver, in the Upcoming Week
In this series of analyses, we have reviewed short-term trading perspectives and market outlooks.
As can be seen, each analysis highlights a key support or resistance area near the current price of the asset. The market’s reaction to or break of these levels will determine the subsequent price trend up to the next specified levels.
Important Note: The purpose of these trading outlooks is to identify key price levels and potential market reactions, and the analyses provided should not be considered as trading signals.

Green Energy & Carbon Credit TradingIntroduction
The 21st century has been defined by two monumental shifts: the urgent need to combat climate change and the technological transformation of how we produce, distribute, and consume energy. At the center of these developments lies green energy, a term that embodies renewable, sustainable, and low-carbon energy systems. Alongside it, carbon credit trading has emerged as one of the most innovative market-based solutions for mitigating greenhouse gas (GHG) emissions.
Together, green energy and carbon credit trading form a powerful duo: while renewable energy reduces direct emissions, carbon credit markets provide financial incentives and frameworks for industries and countries to reduce or offset their carbon footprints. Understanding both requires exploring the dynamics of global energy systems, environmental policies, financial markets, and international cooperation.
Part I: Green Energy
1. Defining Green Energy
Green energy refers to power derived from renewable, natural sources that are not only sustainable but also generate minimal or no greenhouse gas emissions during operation. Common forms include:
Solar Power – harnessing sunlight through photovoltaic panels or concentrated solar thermal plants.
Wind Energy – converting wind’s kinetic energy into electricity via turbines.
Hydropower – generating electricity using water flow in rivers or dams.
Biomass & Bioenergy – energy from organic material such as crop residues, wood, or algae.
Geothermal Energy – tapping the Earth’s internal heat for heating or power generation.
Ocean Energy – wave and tidal systems converting marine energy into power.
Green energy distinguishes itself from fossil fuels (coal, oil, natural gas) by being replenishable and having a substantially lower carbon footprint.
2. Drivers of Green Energy Adoption
Several forces are driving the adoption of green energy worldwide:
Climate Change Awareness – Rising global temperatures, sea-level rise, and extreme weather events demand urgent emission reduction.
Energy Security – Countries aim to reduce dependence on imported fossil fuels.
Technological Advances – Falling costs of solar panels, wind turbines, and batteries have made renewables cost-competitive.
Policy Support – Governments incentivize renewables through subsidies, tax credits, and renewable portfolio standards.
Corporate Commitments – Multinationals pledge to shift toward 100% renewable energy (RE100 initiative).
Consumer Demand – Citizens increasingly prefer sustainable energy and products.
3. Global Green Energy Landscape
(a) Europe
The European Union (EU) has been at the forefront, with policies such as the European Green Deal aiming for carbon neutrality by 2050. Countries like Germany (Energiewende), Denmark (wind leader), and Spain (solar power) dominate renewable penetration.
(b) United States
The U.S. has seen a major green energy boom, led by solar and wind, despite political swings. States like California and Texas lead, and the Inflation Reduction Act (IRA, 2022) provides historic renewable energy subsidies.
(c) China
China is the world’s largest investor and producer of solar panels, wind turbines, and EV batteries. Its ambitious goal is to achieve carbon neutrality by 2060.
(d) India
India aims for 500 GW of renewable capacity by 2030, with strong growth in solar and wind, supported by policies like the National Solar Mission.
(e) Rest of the World
Africa shows potential in solar, the Middle East is diversifying from oil into renewables, and Latin America (Brazil, Chile) is expanding hydropower and solar.
4. Challenges in Green Energy
Intermittency – Solar and wind are weather-dependent, requiring backup systems or storage.
Storage – Battery technology is improving but still expensive at scale.
Grid Infrastructure – Old grids need modernization to handle variable renewable energy.
Investment & Financing – Upfront capital costs can be high, requiring supportive financing models.
Land Use & Environmental Concerns – Large solar or wind projects may affect ecosystems.
Policy Uncertainty – Inconsistent policies discourage long-term investment.
Part II: Carbon Credit Trading
1. Concept of Carbon Credits
A carbon credit represents the right to emit one metric ton of carbon dioxide equivalent (CO₂e). These credits are part of market-based mechanisms to reduce greenhouse gas emissions.
There are two key approaches:
Cap-and-Trade Systems (Compliance Markets)
Governments cap total emissions and issue allowances. Companies must hold enough allowances to cover their emissions, but they can trade if they emit less or more.
Voluntary Carbon Markets (VCMs)
Corporations and individuals purchase carbon offsets voluntarily to neutralize their emissions, often funding renewable energy, reforestation, or clean technology projects.
2. Origins of Carbon Credit Trading
The concept was popularized under the Kyoto Protocol (1997), which introduced three flexible mechanisms:
Clean Development Mechanism (CDM) – Developed countries invest in emission reduction projects in developing nations.
Joint Implementation (JI) – Projects between developed countries.
Emissions Trading – Countries with surplus allowances can sell to others.
Later, the Paris Agreement (2015) established a more global framework with Article 6, which enables international cooperation through carbon markets.
3. How Carbon Trading Works
Example:
A cement factory emits 1 million tons CO₂ annually.
Government sets a cap of 800,000 tons.
The factory must reduce emissions or buy 200,000 credits from another company that reduced emissions below its allowance.
This system incentivizes efficiency and low-carbon investment while rewarding overachievers.
4. Compliance Markets vs Voluntary Markets
Feature Compliance Market Voluntary Market
Basis Regulation (laws, caps) Voluntary CSR, sustainability goals
Participants Governments, industries Corporations, NGOs, individuals
Examples EU ETS, California Cap-and-Trade, RGGI Gold Standard, Verra (VCS), Climate Action Reserve
Size Larger, more liquid Smaller but growing rapidly
Objective Meet legal emission targets Achieve carbon neutrality & branding
5. Carbon Credit Standards & Certification
For credibility, carbon credits must meet strict criteria:
Additionality – Reductions wouldn’t have happened without the project.
Permanence – Reductions are long-term (e.g., forests not cut down later).
Verification – Independent third-party audit of projects.
Leakage Prevention – Emission reduction in one area shouldn’t cause increases elsewhere.
Prominent standards include:
Verra’s Verified Carbon Standard (VCS)
Gold Standard (WWF-supported)
Climate Action Reserve
American Carbon Registry (ACR)
6. Criticism & Challenges of Carbon Trading
Greenwashing – Companies may buy cheap offsets instead of real emission cuts.
Double Counting – Same credit claimed by two entities.
Project Integrity – Some projects (like forest offsets) face permanence risks.
Price Volatility – Carbon credit prices vary widely, affecting planning.
Equity Issues – Developing countries may face exploitation if credits are undervalued.
Part III: Intersection of Green Energy & Carbon Credits
Green energy projects often generate carbon credits by displacing fossil fuel energy. For example:
A solar farm replacing coal power saves emissions, generating credits.
A biogas project using agricultural waste reduces methane emissions, creating tradable credits.
Thus, green energy is both a direct decarbonization strategy and a carbon credit revenue generator.
Many corporations purchase renewable energy certificates (RECs) or carbon offsets from green projects to meet net-zero pledges.
Part IV: Global Case Studies
1. European Union Emissions Trading System (EU ETS)
World’s largest compliance carbon market.
Covers ~10,000 installations in energy, industry, aviation.
Credits traded across EU countries, providing billions in green investment.
2. California Cap-and-Trade Program (USA)
Launched in 2013.
Includes industries, fuel distributors, and electricity providers.
Linked with Quebec’s carbon market.
3. China’s National ETS
Started in 2021, initially covering power plants.
Expected to expand to cement, steel, and aviation.
Will be the world’s largest market by emissions coverage.
4. India’s Green Energy & Carbon Trading Push
Renewable energy projects (solar, wind) generate millions of CERs under CDM.
India plans a national carbon trading scheme aligned with its 2070 net-zero goal.
Part V: Economic & Financial Dimensions
Carbon Pricing as Economic Signal
Carbon credits put a price on pollution, internalizing environmental costs. This incentivizes cleaner technologies.
Investment in Green Projects
Carbon revenues make renewable energy and reforestation projects financially viable, especially in developing countries.
Emerging Financial Instruments
Green Bonds
Carbon ETFs
Carbon futures and options on exchanges like ICE and CME
Corporate Net-Zero Strategies
Companies like Microsoft, Google, and Shell rely on both green energy and carbon credits to achieve carbon neutrality.
Part VI: Future Outlook
Growth of Voluntary Carbon Markets
Expected to grow from ~$2 billion (2022) to over $50 billion by 2030.
Digital Carbon Trading
Blockchain and tokenization are enhancing transparency and traceability of credits.
Integration with ESG Investing
Carbon performance will be a key metric in investment decisions.
Global Cooperation
More linkages between national carbon markets (e.g., EU, China, North America).
Corporate Accountability
Greater demand for high-quality credits and real emission reductions rather than symbolic offsets.
Conclusion
Green energy and carbon credit trading represent two sides of the same coin in the global climate action narrative. Green energy reduces emissions at the source by replacing fossil fuels, while carbon markets provide flexible, market-driven tools to finance emission reductions and incentivize global cooperation.
However, both face challenges—technological, economic, and ethical—that must be addressed. Transparency, integrity, and equitable benefit-sharing will be essential to ensure that these systems truly help achieve the goals of the Paris Agreement.
The future will likely see tighter integration between renewable energy expansion, carbon pricing mechanisms, and sustainable finance, creating a global ecosystem where climate responsibility and economic opportunity go hand in hand.

SPX500 & NAS100 AT RESISTANCE CROSSROADS, GOLD GAINING STEAMIn this weekend's analysis on the SPX500 and NAS100 indices, I see a potential bullish trend continuation but also at a key resistance level with hidden bears ready to attach bulls. This is one of the setups that patience is more rewarding than taking a bet.
Gold is gaining strength to the upper range and still in the sideways channel. Here too patience for a clear breakout will be more rewarding. I think based on the length of the sideways, once there is a clear breakout, Gold will really rally to it's next targets. Please watch the entire video to understand my analysis and thoughts. Cheers and have a great trading week.

SPX500USD – Holding Above 6,490, Targeting 6,540The S&P 500 Index has cleared the 6,490 resistance level, confirming bullish strength. Price is now holding above this zone, with momentum building toward the next upside target at 6,540.
Support at: 6,490 / 6,440 🔽
Resistance at: 6,540 🔼
🔎 Bias:
🔼 Bullish: Sustained strength above 6,490 keeps 6,540 in focus.
🔽 Bearish: A break back below 6,490 and 6,440 would weaken momentum.
📛 Disclaimer: This is not financial advice. Trade at your own risk.

S&P500 Nvidia’s guidance has tempered risk appetiteNvidia’s earnings dampened sentiment overnight, with shares down -3% in after-hours trading after a strong Q2 sales beat was overshadowed by softer guidance and concerns over a potential US plan to tax China AI chip sales. The disappointment weighed on futures, with NASDAQ 100 down -0.29% vs. -0.12% for S&P 500.
That said, prior to the results, the S&P 500 (+0.24%) closed at another record high, supported by strength in energy (+1.15%) on firmer oil prices and tech (+0.48%). Small-caps also outperformed, with the Russell 2000 (+0.64%) at an 8-month high, now just 3% below its November 2021 peak.
Takeaway for S&P traders: Nvidia’s guidance has tempered risk appetite, but sector rotation into energy and small-caps continues to support breadth, helping the index hold record levels despite tech headwinds.
Key Support and Resistance Levels
Resistance Level 1: 6516
Resistance Level 2: 6542
Resistance Level 3: 6564
Support Level 1: 6416
Support Level 2: 6400
Support Level 3: 6381
This communication is for informational purposes only and should not be viewed as any form of recommendation as to a particular course of action or as investment advice. It is not intended as an offer or solicitation for the purchase or sale of any financial instrument or as an official confirmation of any transaction. Opinions, estimates and assumptions expressed herein are made as of the date of this communication and are subject to change without notice. This communication has been prepared based upon information, including market prices, data and other information, believed to be reliable; however, Trade Nation does not warrant its completeness or accuracy. All market prices and market data contained in or attached to this communication are indicative and subject to change without notice.

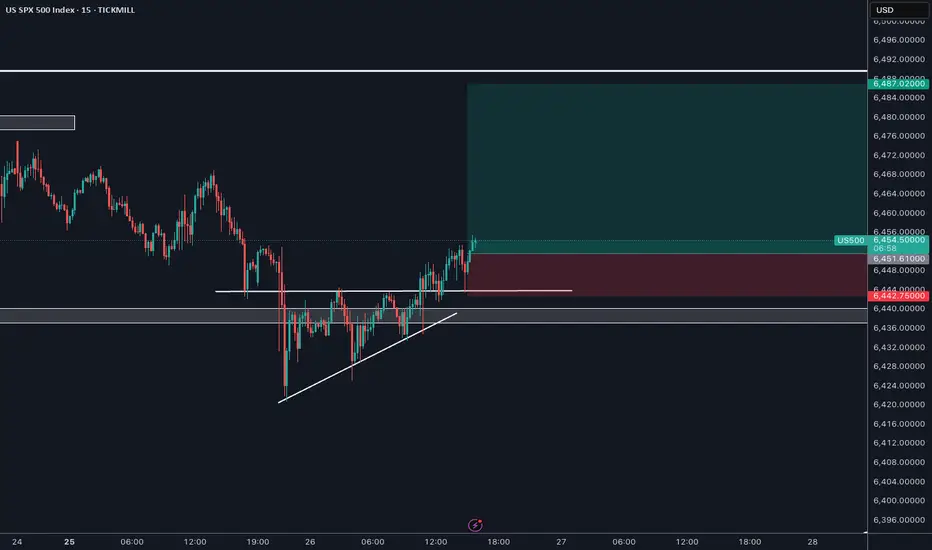
US500 breaks consolidation, eyeing all-time highs after pullbackThe US500 reached a key support area on the H1 chart and started building a bullish structure.
On the intraday (M5/M1), price broke above local resistance and then retested the breakout zone with a clean pullback. This retest was confirmed by a strong bullish candle, signaling continuation to the upside.
Trade plan:
Entry: after confirmation of the pullback at the breakout zone.
Stop-loss: below support (around 6437).
Target: all-time high zone at 6485–6490.
Risk management: once the first target is reached, stop can be moved to breakeven to protect capital.
This setup supports the expectation of bullish continuation, as long as support holds.
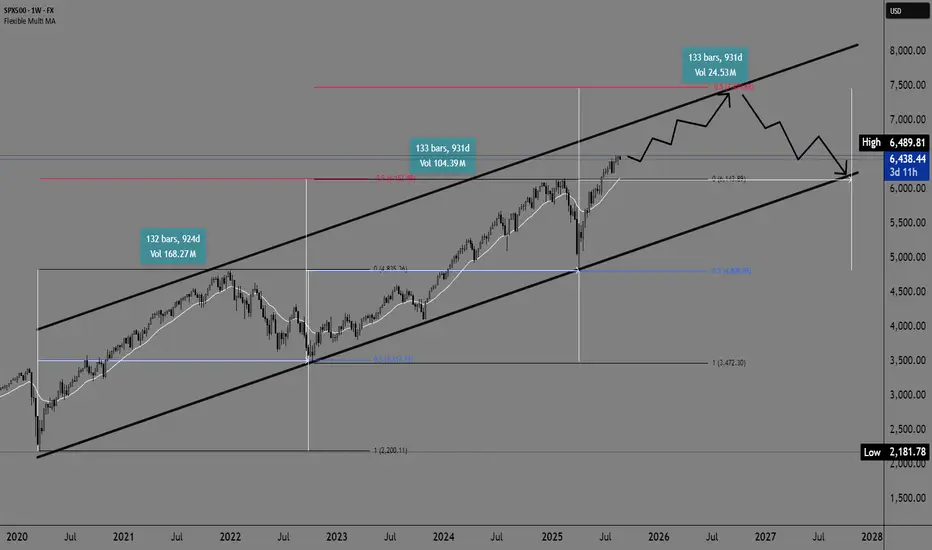
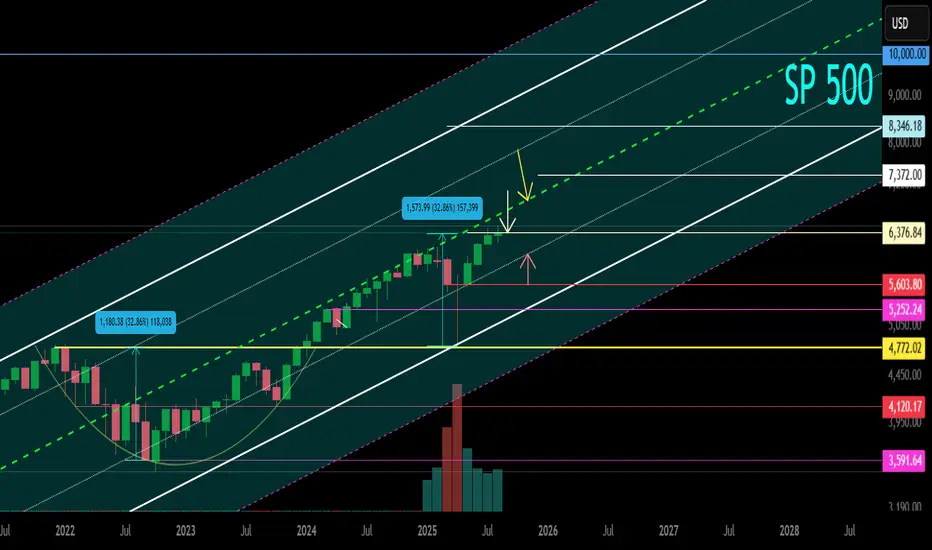
SPX500 Weekly Trend AnalysisSPX500 Weekly Trend Analysis
The SPX500 on a weekly timeframe continues to show an upward trend within a rising channel that has been in place since 2020. The price behavior in relation to the 50.0% Fibonacci retracement levels is particularly interesting—the previous two pullbacks both stopped at this key level, confirming its significant role as support.
As a reminder, after forming a low in 2020, the SPX500 entered a long bullish trend that lasted until December 2021, when it recorded its first high at 4500.00. After that, the index pulled back to the 50.0% Fibonacci level and then continued with a new bullish rally.
A new higher high was formed around 6000.00, which is again connected to the -50.0% Fibonacci level. The next pullback, similar to the previous one, found support at the 50.0% Fibonacci retracement, suggesting a continuation of the upward trend.
Based on this pattern, there is a realistic possibility of a new bullish rally with a potential target of 7500.00 (-50.0% Fibonacci level). Following the previous cycles from low to high and pullback, the average interval is approximately 920–930 days, which provides a rough time projection:
Next high: By the end of 2026
Next pullback: First part of 2027 or, at the latest, by October 2027
This pattern confirms the strong long-term growth structure and implies that the SPX500 will likely maintain its positive momentum for several more years, with periodic corrections that rely on key Fibonacci levels.
Greatest buyback opportunity on SPX @ 3,958$!SPX should see an increase to 6,860$ and then see a financial crash like drop to 4,817$ at the least. Thereafter, to drive other asset classes even lower such as BTC, SPX will drop even lower to 3,958$!
That's the price action I expect to see over the next few weeks, months etc.

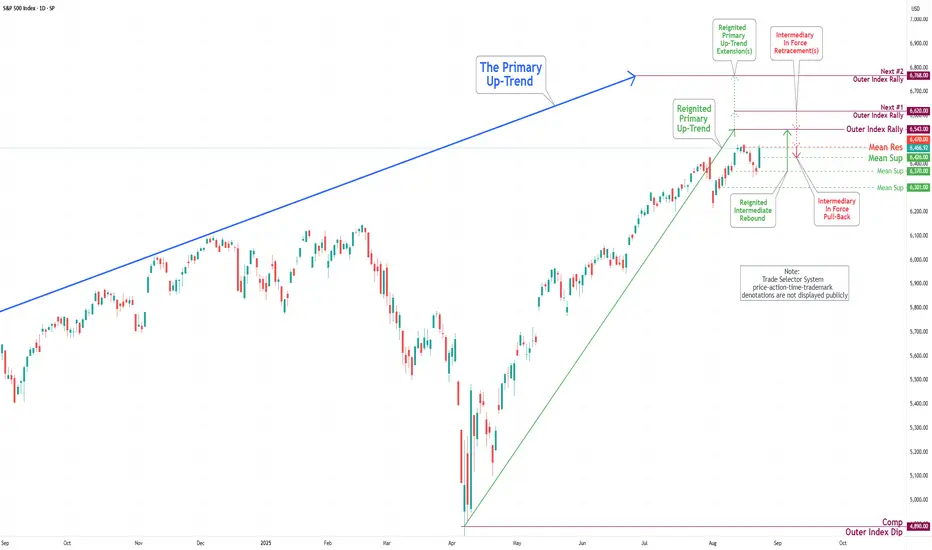
S&P 500 Daily Chart Analysis For Week of August 22, 2025Technical Analysis and Outlook:
During the trading activity of the previous week, the S&P 500 Index experienced significant volatility before reestablishing its strong bullish trend. Initially, the Index faced a substantial decline, reaching our designated target of Mean Support at 6370. Subsequently, it rebounded vigorously, attaining our target of Mean Resistance at 6470, and is currently aiming for the Outer Index Rally target of 6543. It is essential to recognize, however, that there remains a possibility of a decline to Mean Support at 6426 before the upward trajectory resumes.
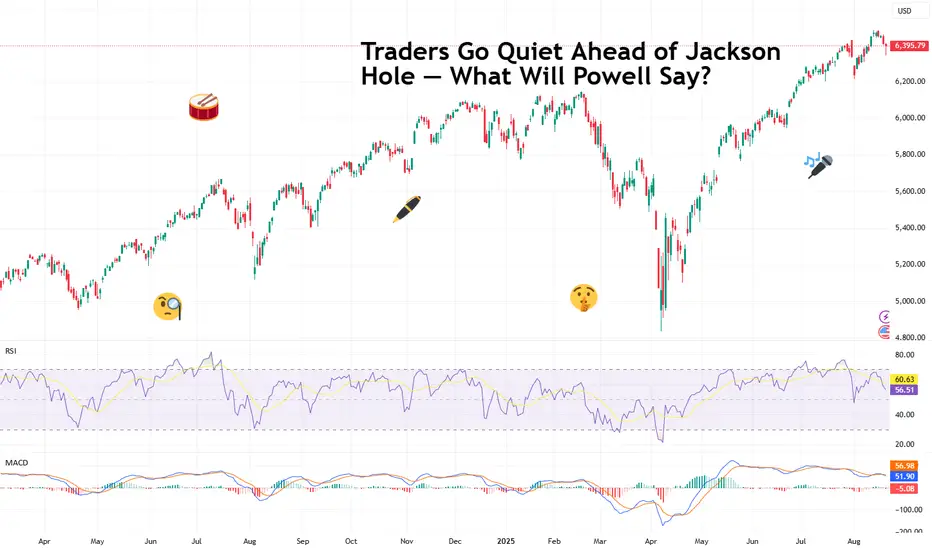
Traders Go Quiet Ahead of Jackson Hole — What Will Powell Say?Markets have been eerily quiet this week. Not because traders suddenly discovered meditation, but because everyone is waiting for one man in Wyoming to make things move.
Federal Reserve Chair Jerome Powell, the man who moves markets with a simple “Good afternoon,” is about to step onto the stage at the annual Jackson Hole Economic Symposium. And when he does, markets will hang on every word — because it’s his final speech as Fed boss at the premium event.
⛰️ Jackson Hole: Where Hiking Boots Meet Basis Points
The Jackson Hole conference isn’t your average PowerPoint snoozefest. Each year, central bankers from around the world swap suits for Patagonia fleeces and gather in Wyoming’s Grand Teton National Park. Think Davos, but with more elk.
This year’s theme? “Labor Markets in Transition.” Translation: the Fed wants to talk demographics, productivity, and immigration — the forces shaping how Americans work and how the economy grows. But make no mistake: nobody’s tuning in for a TED Talk on labor force participation rates. They want Powell’s take on interest rates.
🎯 Powell’s Big Moment
Powell’s speech may only run about 15 minutes (he’s not known for monologues), but the stakes couldn’t be higher. His term as Fed chair ends in May, and President Donald Trump has spent most of this year taking swings at him — calling him a “major LOSER” and grumbling that the Fed is moving “Too Late” on rate cuts.
Trump has even floated the idea of firing Powell early, which, technically speaking, isn’t supposed to happen. But this is 2025, and “not supposed to happen” has lost most of its meaning.
So, Jackson Hole could be Powell’s last best chance to lock in a legacy: defending the Fed’s independence while signaling where rates are headed next.
⛅️ Markets Already Have a Guess
Wall Street isn’t exactly sitting in suspense. Interest-rate swaps are pricing in an 80% chance of a 25-basis-point cut in September, with two full cuts baked in before the year is out.
Why? Because the data leaves Powell little wiggle room:
Jobs market: Recent revisions show weaker-than-thought employment growth . Maximum employment? Not quite.
Inflation: July’s consumer price index came in at 2.7% year-on-year — stable, but not scary enough to justify keeping rates where they are forever.
Tariffs: Trump’s sweeping duties could pressure inflation further, but they’re also weighing on growth. Powell’s challenge is threading the needle between those forces.
Translation: the Fed looks ready to flip from “higher for longer” to “cutting season.”
🧘♂️ Traders on Mute
If you think markets look a little sleepy, you’re not wrong. On Monday, the S&P 500 basically took a nap , slipping 0.01% as traders sat on their hands. Tuesday was even worse with big tech nosediving all day long.
It’s not just Powell they’re waiting for. Roughly 95% of S&P 500 companies have now reported earnings, (mandatory note: catch all earnings dates in the Earnings Calendar ) with more than 80% beating expectations.
Companies have been surprisingly nimble, offsetting tariffs and riding the weaker dollar . Yet despite the blowout earnings season, nobody wants to make big moves until Powell clears the air.
Call it the pre-Jackson Hole silence — the calm before the potential volatility storm.
🥊 Powell vs. Trump
There’s also political theater baked into this. Trump has made no secret of his desire for lower rates to juice growth and pump markets. Powell, however, has tried to keep the Fed above the political fray.
But that balancing act has been messy. Lower too quickly, and Powell risks stoking more inflation. Hold too high, and he risks slowing the labor market just as it’s showing cracks. Either way, he’ll be accused of playing politics.
This isn’t just about economics. It’s about central bank independence — a fancy way of asking: Can Powell make decisions without getting steamrolled by the White House?
🔮 What to Watch For
Here’s what traders will parse in his speech:
Tone: Does Powell sound more dovish (hinting at cuts) or still hawkish (concerned about tariffs fueling inflation)?
Framework: Will he unveil a new policy strategy for inflation and jobs?
Forward guidance: Any nods to September’s meeting or beyond will be amplified a thousand times on trading desks worldwide.
In other words, the market doesn’t just want Powell’s words. It wants the subtext and the context.
🚀 Why It Matters for Traders
For traders (yes, you), Powell’s Jackson Hole moment has real portfolio consequences:
Equities: A dovish Powell could extend the market’s record run — the S&P 500 and Nasdaq already logged new all-time highs this summer.
Bonds: Rate cuts could mean yields falling, bond prices rising. Treasuries might not be the snooze trade they’ve been.
Dollar: Lower rates could push the greenback down, offering a boost to commodities and emerging markets. Lower rates = lower deposit yields = less appeal to hold greenback.
Crypto: Yes, even Bitcoin BITSTAMP:BTCUSD cares. A dovish Fed means more liquidity sloshing around — which historically finds its way into risk assets.
🏁 The Takeaway
Markets are quiet now, but don’t expect them to stay that way. Powell’s Jackson Hole speech is shaping up as one of the most important of his career — maybe his swan song as Fed chair.
Off to you : Here’s a question (or two). Will he go dovish, handing traders the rate cuts they crave? Or will he stand firm, reminding everyone that the Fed won’t be bullied by politics? Share your thoughts in the comments!
S&P (CASH500) | 30min Inverse Head & Shoulders | GTradingMethodHello Traders.
Welcome to today’s trade idea by GTradingMethod.
🧐 Market Overview:
Following Friday’s sharp rally after Jackson Hole, the S&P 500 may be forming a bull flag. If confirmed, this setup could drive an equal measured move higher, with the inverse head & shoulders pattern acting as a potential breakout structure.
📊 Trade Plan:
Risk/Reward: 3.6
Entry: 6460.1
Stop Loss: 6453.8
Take Profit 1 (50%): 6481
Take Profit 2 (50%): 6489
💡 GTradingMethod Tip:
Always wait for confirmation of breakout patterns to avoid false moves.
📌 Please note:
This is not financial advice. This content is to track my trading journey and for educational purposes only.

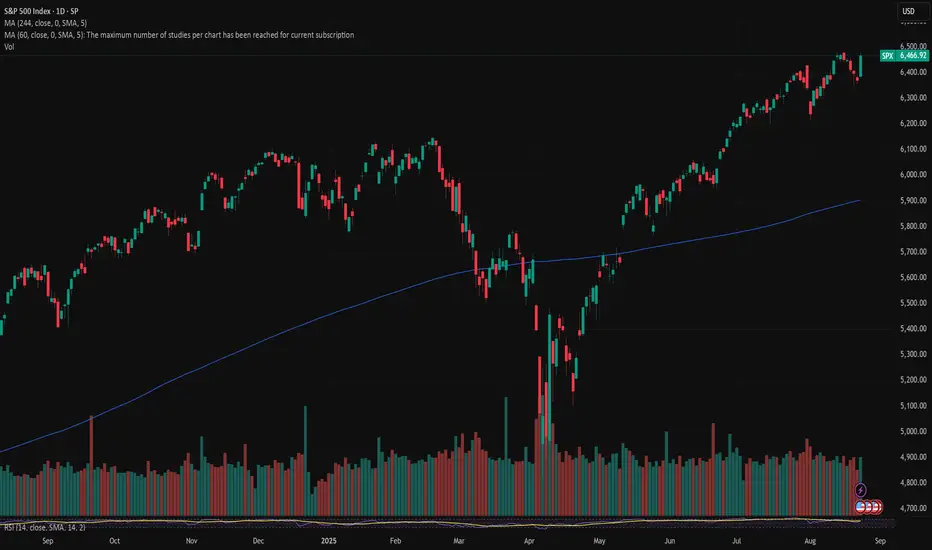
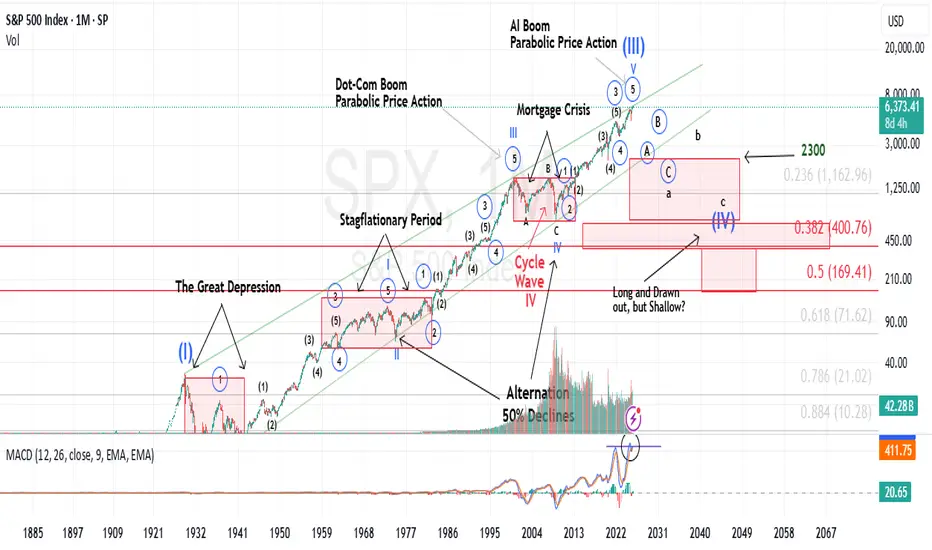
SP500 Secondary trend. Part of the channel. Reversal zone. 2025 Logarithm. Time frame 1 month (less is not necessary). The SP500 index primarily reflects the "health" of the American stock market and the economy as a whole. This is reflected in all markets by the domino effect.
Now, after a huge takeout and recovery, the price is at the maximums of the local trend that has formed, and this is also the maximum of the index as a whole for its entire 100-year existence (before displaying on the chart).
🔄 Locally, the price has run into the resistance of the median of the ascending channel (green dotted line). Now the resistance level of this zone will be formed.
🟢 A breakout of this zone upwards - an exit above the median, promises strong growth and pumping of the stock market as a whole.
🔴 And the reverse process is not a breakthrough and not a consolidation above this zone - consolidation in the range under resistance and above the dynamic support of the internal channel. An extremely negative case is a decline in the lower zone of the channel.
🧠 The chart as a whole shows the channel range itself. Including on both sides, price slippage zones (low probability), as well as key support / resistance levels of this secondary trend that exist, and those that will be formed in the future, but will be key for the development of the trend. This can be an addition to the analysis and formation of tactics and money management in other markets, including cryptocurrency.
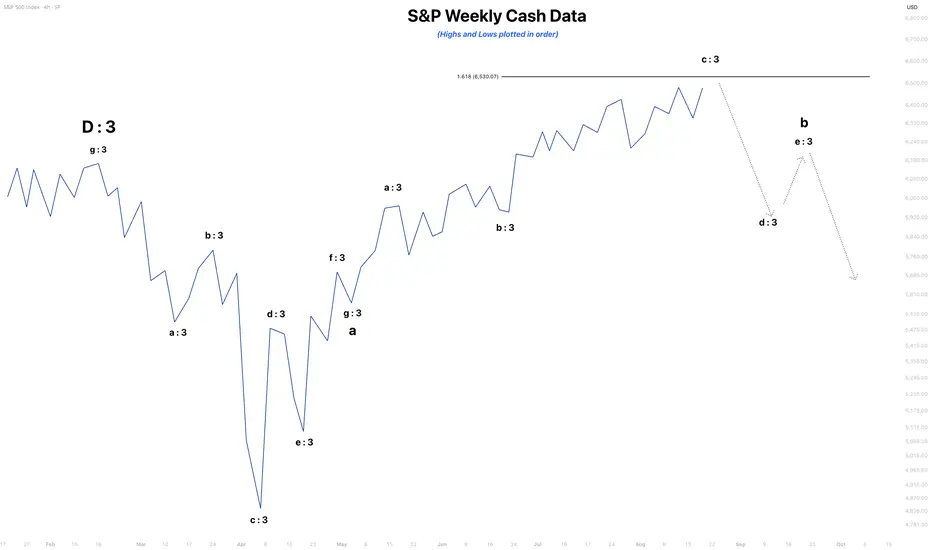
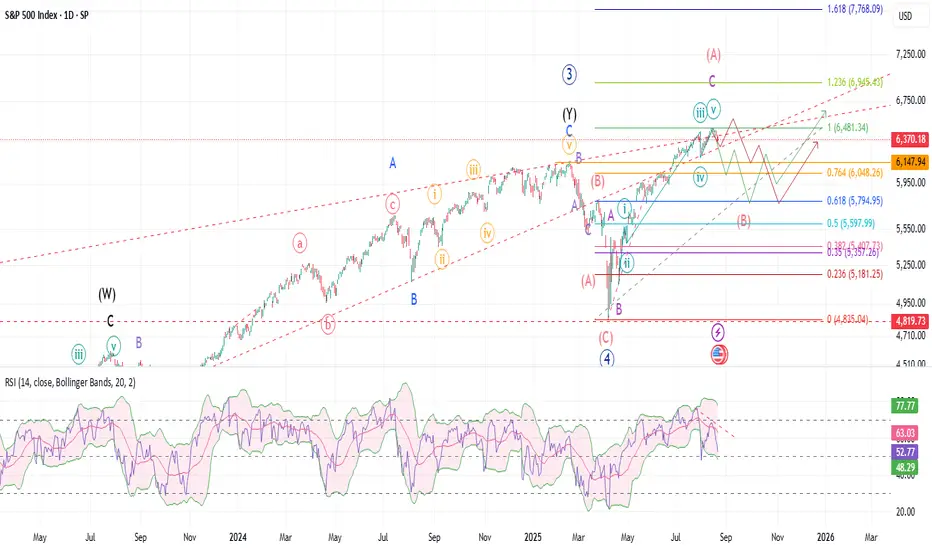
S&P Weekly NEOWAVE AnalysisThe index appears to be approaching a potential short-term top. The ongoing Wave B structure is most likely unfolding as a Neutral Triangle, given the prolonged time taken by Wave C. Based on the guideline of alternation, Wave D is expected to be sharp and deep, while Wave E will likely mirror the length of Wave A.
US500 at All-Time High – Pullback or Breakout Ahead?The US500 has reached the All-Time High (ATH) zone after a strong bullish leg.
We are now at a key decision point: will the price correct lower to gather strength, or break out and extend the rally?
📊 Scenario 1 – Pullback before breakout
Possible rejection at the ATH with a correction toward the 6440–6460 support/resistance zone.
If buyers defend this area, it could provide a solid long entry opportunity.
📊 Scenario 2 – Direct breakout
A clean breakout above 6480–6500 with strong volume could trigger another bullish wave.
Waiting for confirmation is crucial to avoid a false breakout.
⚖️ Conclusion
The broader trend remains bullish (H4 uptrend line intact). The most likely path is a continued move higher, potentially after a short pullback to relieve buying pressure.
👉 This is an educational analysis only, not financial advice.
S&P 500 Eyes Breakout as Powell Signals Rate CutThe S&P 500 is once again approaching record territory, with momentum accelerating after Fed Chair Jerome Powell signaled a potential rate cut at Jackson Hole. Markets welcomed the dovish shift, boosting risk appetite and driving stocks higher.
Beyond Powell’s comments, several other factors are fueling the rally. Softer inflation readings have reinforced the case for easier policy, while labor market data shows a cooling trend without triggering recession fears. This “goldilocks” scenario continues to support equities.
Strong corporate earnings have also underpinned the move, particularly from the tech and consumer sectors, where margins remain resilient despite macro uncertainty. Capital inflows into equity ETFs highlight renewed investor confidence, while declining bond yields are making stocks relatively more attractive.
On the technical side, the S&P 500 is pushing toward the 6,500 level, its all-time high. A clean break above this barrier would confirm fresh upside momentum, potentially triggering further buying from trend-following funds.
While risks remain from geopolitics and trade tensions, the current mix of easing Fed expectations, solid earnings, and supportive technicals suggests the index could extend higher. A breakout above 6,500 may set the stage for another leg in the bull market.


SPX: Bad news if support breaksSPX is coming up on the support area around 6300. Next week will be the do or die test. If support trendline breaks, then probability of Minor degree B wave goes up by a lot. Right now, the bullish scenario is on the red path. If, SPX gets support on the trendline and bounces to make another ATH along with Daily and Weekly RSI making another lower high, then that would be the local top. More bearish scenario is if the support breaks right now. That will put SPX on the green path; breakdown, retest trendline and then crash. In that case, should expect correction to last till the end of September; maybe till mid October, and then the Halloween rally to finish up the year. Should expect market to get down to 0.618 to 0.5 fib level before the down turn is over. Do not want to see the market get below 5k. For now, the trendline is where the next move will most likely be decided. I do not think the generational crash is here just yet. There are still a lot of investors on the side lines. Crypto market still hasn't seen the blow off top. Underlying economy is still holding steady, even though some cracks are appearing. Depending on how the correction unfolds, either a 3 or a 5 waves move, we will find out the magnitude and the degree.
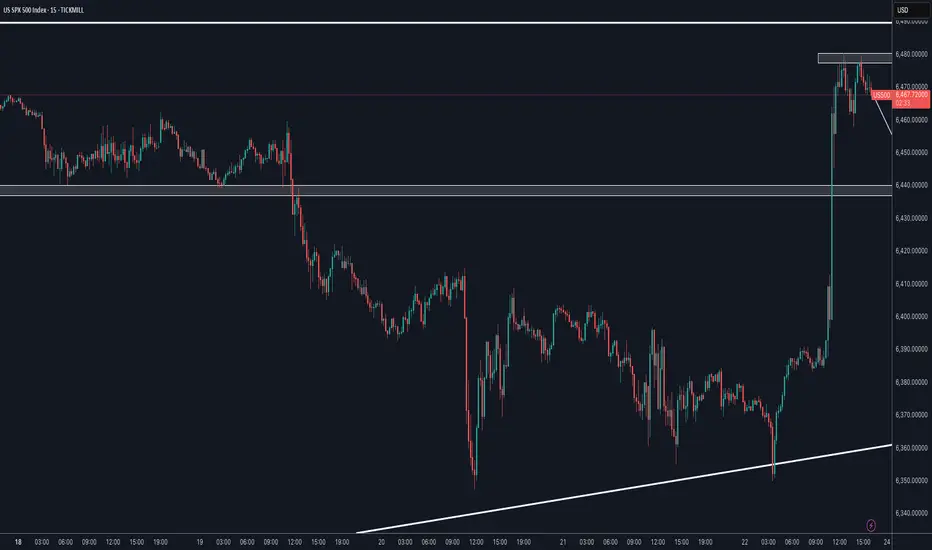
SPX500 H4 | Bearish dropS&P500 has rejected off the sell entry at 6,407.74, which is a pullback resistance that aligns with the 38.2% Fibonacci retracement and could drop from this level to the downside.
Stop is at 6,491.06, which is a swing high resistance.
Take profit is at 6,302.91, which is a pullback support that is slightly below the 61.8% Fibonacci retracement.
High Risk Investment Warning
Trading Forex/CFDs on margin carries a high level of risk and may not be suitable for all investors. Leverage can work against you.
Stratos Markets Limited (tradu.com ):
CFDs are complex instruments and come with a high risk of losing money rapidly due to leverage. 65% of retail investor accounts lose money when trading CFDs with this provider. You should consider whether you understand how CFDs work and whether you can afford to take the high risk of losing your money.
Stratos Europe Ltd (tradu.com ):
CFDs are complex instruments and come with a high risk of losing money rapidly due to leverage. 66% of retail investor accounts lose money when trading CFDs with this provider. You should consider whether you understand how CFDs work and whether you can afford to take the high risk of losing your money.
Stratos Global LLC (tradu.com ):
Losses can exceed deposits.
Please be advised that the information presented on TradingView is provided to Tradu (‘Company’, ‘we’) by a third-party provider (‘TFA Global Pte Ltd’). Please be reminded that you are solely responsible for the trading decisions on your account. There is a very high degree of risk involved in trading. Any information and/or content is intended entirely for research, educational and informational purposes only and does not constitute investment or consultation advice or investment strategy. The information is not tailored to the investment needs of any specific person and therefore does not involve a consideration of any of the investment objectives, financial situation or needs of any viewer that may receive it. Kindly also note that past performance is not a reliable indicator of future results. Actual results may differ materially from those anticipated in forward-looking or past performance statements. We assume no liability as to the accuracy or completeness of any of the information and/or content provided herein and the Company cannot be held responsible for any omission, mistake nor for any loss or damage including without limitation to any loss of profit which may arise from reliance on any information supplied by TFA Global Pte Ltd.
The speaker(s) is neither an employee, agent nor representative of Tradu and is therefore acting independently. The opinions given are their own, constitute general market commentary, and do not constitute the opinion or advice of Tradu or any form of personal or investment advice. Tradu neither endorses nor guarantees offerings of third-party speakers, nor is Tradu responsible for the content, veracity or opinions of third-party speakers, presenters or participants.

Are Longterm Interest Rates Telling Us Something?I rarely cite financial news in my market updates.
My reasoning is simple: all perspectives, bullish or bearish, are ultimately reflected in price action. That price action forms patterns, and those patterns can be analyzed to produce reasonable forecasts. After years of applying Elliott Wave theory, this approach has consistently stood the test of time.
That said, I’ll break from tradition today, as I believe the following excerpt is particularly relevant to my latest Trading View update. It comes from Barbara Kollmeyer’s article, “There’s a slow-motion crisis in bonds — and this bearish strategist thinks it will hit stocks.”
For context, I regularly track multiple market indices, futures contracts, single stocks, and notably, the yield on the 30-year U.S. Treasury Bond. For the past year, I’ve highlighted the counterintuitive rise in long-term yields that ironically began when the Fed started cutting its benchmark rate in September 2024. While brief divergences between long-term yields and Fed policy aren’t unusual, this persistent uptrend is different. The yield has been carving out a clear pattern of higher highs and higher lows, appearing now on the verge of a breakout—not just toward incremental new highs, but potentially into a runaway scenario for long-term rates.
This is why Albert Edwards’ recent comments caught my attention:
“There is a slow-motion crisis unfolding in the government bond markets that equity investors continue to ignore at their peril. The upward grind for long bond yields has been relentless, yet investors keep ignoring that to focus instead on more bullish metrics such as the latest reporting season driven by the mega-cap IT stocks, that promises a pot of gold at the end of the AI rainbow.”
His perspective resonated with me.
Having lived through the dot-com boom and bust, I recall how new technologies can fuel outsized market optimism. AI undoubtedly carries transformational potential, much like the Internet. But just as it took nearly two decades for the Internet to fully translate from speculative boom to tangible economic value, AI’s payoff will likely follow a similarly extended trajectory. It’s not an immediate catalyst.
What I am certain of is this: the cost of long-term money is rising, with implications far beyond bond charts. Higher yields directly affect mortgage rates and other long-term financing costs. More importantly, sustained upward pressure in long-term rates has the potential to weigh heavily on equities, broader markets, and asset valuations for far longer than many currently expect.
S&P dip buying opportunity supported at 6340US equities staged a sharp intraday rebound, with the S&P 500 recovering from losses of over -1% to close down just -0.24%. Tech remained under pressure (NASDAQ -0.67%, Mag-7 -1.11%), weighed by reports questioning the near-term profitability of AI adoption, though DB research stressed that productivity gains are still likely longer term. Gains in energy (+0.86%) and other cyclical sectors helped offset the tech weakness as Brent crude rose +1.6% to $66.84/bbl. Geopolitical headlines around Ukraine and potential security arrangements kept risk sentiment cautious.
Conclusion: Despite renewed tech volatility, the S&P’s resilience and sectoral rotation suggest dip-buying interest remains intact, but with near-term upside likely capped until tech stabilises.
Key Support and Resistance Levels
Resistance Level 1: 6433
Resistance Level 2: 6466
Resistance Level 3: 6500
Support Level 1: 6340
Support Level 2: 6310
Support Level 3: 6280
This communication is for informational purposes only and should not be viewed as any form of recommendation as to a particular course of action or as investment advice. It is not intended as an offer or solicitation for the purchase or sale of any financial instrument or as an official confirmation of any transaction. Opinions, estimates and assumptions expressed herein are made as of the date of this communication and are subject to change without notice. This communication has been prepared based upon information, including market prices, data and other information, believed to be reliable; however, Trade Nation does not warrant its completeness or accuracy. All market prices and market data contained in or attached to this communication are indicative and subject to change without notice.

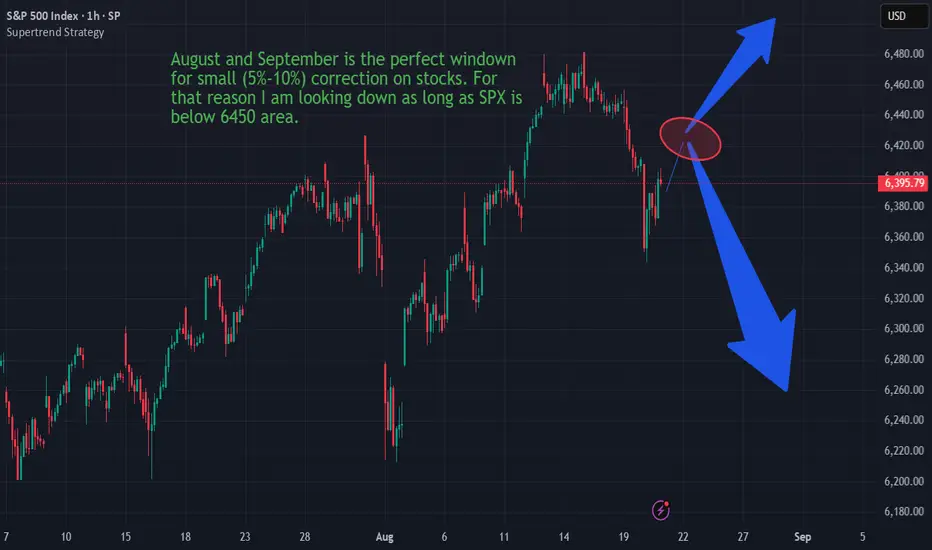
SPX- potential for 5% drop in comming weeks.Currently market is oscilating around 6400 lvls, which is only 1% below ATH. Historicaly August and September are relatively bearing so we are at good levels to short the market with tight tops right abobe ATH. Risk/Reward is great. 1:5.