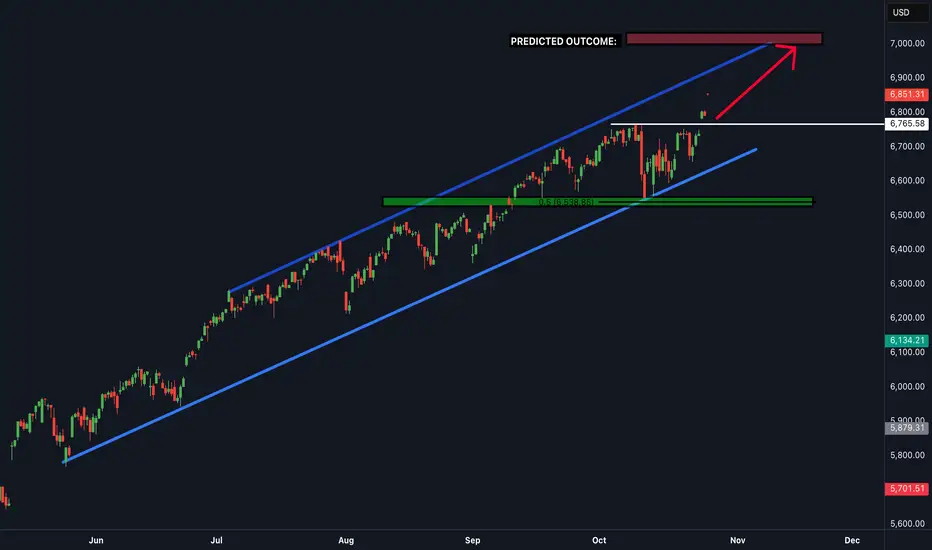
S&P 500 will sell from 7000from price action analysis the s and p 500 will sell to the next resistance level turned suppourt
Trade ideas

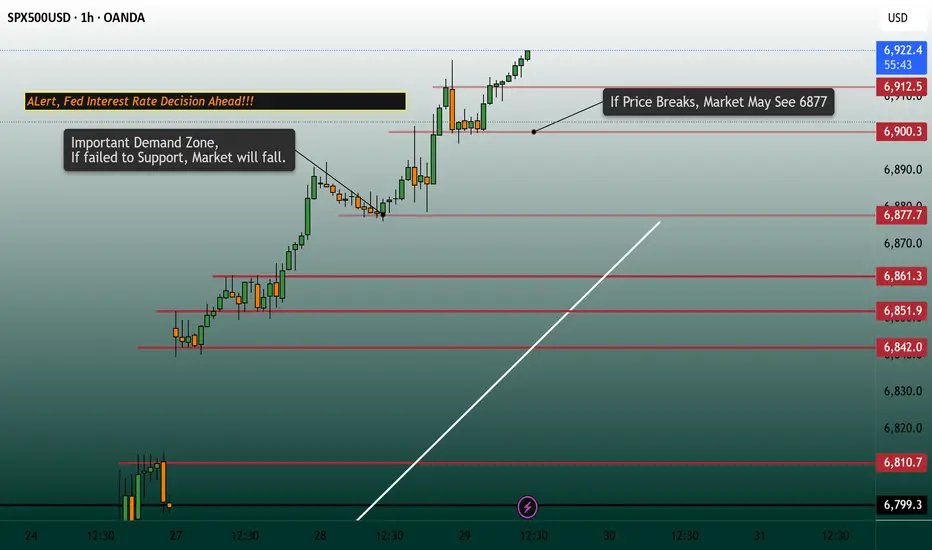
SPX | Daily Analysis #8 - 29 October 2025Hello and welcome back to DP
Market Review:
Over the past two days, as mentioned in our #7 analysis, “a sustained move above 6,860 may signal further bullish momentum toward the upside.”
This scenario played out as expected, with price reaching the 6,900 area for the first time. However, short sellers are now stepping in, attempting to fade the rally and fill the gap.
Currently, all eyes are on the upcoming Federal Reserve interest rate decision and Chairman Powell’s comments. Both China and the U.S. have remained relatively quiet, keeping market attention focused on monetary policy.
Meanwhile, President Trump stated yesterday that he intends to replace Powell in the coming months. Powell has previously clarified that the President does not have direct authority to remove the Fed Chair, so this statement adds a layer of political uncertainty.
According to CME FedWatch, there is about a 95% probability of a 25 bps rate cut being announced.
1H–4H Technical Analysis:
The 6,900 area is currently acting as a strong resistance zone, followed by the 6,878 support area.
• Bears have entered around 6,900–6,917, attempting to push prices lower.
• Bulls, however, are showing resilience and defending the zone.
If price fails to hold above 6,900, we could see a pullback toward 6,878.
Should 6,878 fail to hold, a sharper decline toward the gap zone could occur.
Given the interest rate decision, expect high volatility — with sharp moves both up and down before and after the announcement.
If you’re planning to trade this event, manage your stop loss carefully and avoid overexposure.
Disclaimer:
This content is for informational purposes only and does not constitute financial or investment advice. © DIBAPRISM
Amir D.Kohn
Geopolitical Tensions and Energy MarketsIntroduction
Energy markets are among the most geopolitically sensitive sectors in the global economy. The production, transportation, and consumption of oil, gas, and other energy sources are deeply intertwined with the political and strategic interests of nations. Geopolitical tensions—ranging from wars and sanctions to diplomatic conflicts and trade restrictions—can dramatically alter the dynamics of energy supply, demand, and pricing. The 21st century has witnessed several such disruptions, from the U.S.–Iran confrontations and Russia–Ukraine war to Middle East instability and U.S.–China trade tensions. These events reveal a clear pattern: energy is not merely a commodity; it is a strategic weapon and a cornerstone of national security.
This essay explores how geopolitical tensions influence energy markets globally, analyzing the historical context, current landscape, major case studies, and future implications for energy security and transition.
The Geopolitical Nature of Energy
Energy, particularly oil and natural gas, has long been at the center of global power dynamics. The distribution of energy resources is highly uneven—Middle Eastern nations hold roughly half of the world’s oil reserves, while Russia, the U.S., and a few others dominate gas and shale production. This geographic concentration creates dependency relationships between energy-producing and energy-consuming countries.
For instance, Europe has traditionally depended heavily on Russian natural gas, while China and India rely on Middle Eastern oil. Such dependencies grant exporting nations substantial geopolitical leverage. Conversely, import-dependent economies must ensure access through alliances, trade routes, and sometimes military presence, as seen in the U.S. naval presence in the Persian Gulf.
Energy is therefore both an economic resource and a political instrument. The price of oil and gas, the stability of supply chains, and the policies of major producers like OPEC and Russia all have direct implications for global economic health and security.
Historical Context: Energy and Geopolitics
The relationship between geopolitics and energy markets has a long and turbulent history:
The 1973 Oil Embargo – The Arab members of OPEC cut oil supplies to Western nations supporting Israel during the Yom Kippur War, causing a global oil shock. Prices quadrupled, inflation surged, and energy security became a top priority for Western governments.
Iranian Revolution (1979) – The overthrow of the Shah and subsequent instability in Iran, one of the world’s major oil producers, led to another sharp increase in oil prices.
Gulf War (1990–91) – Iraq’s invasion of Kuwait raised fears of disrupted oil supplies. The U.S.-led coalition intervened not just for political reasons but also to safeguard global energy flows from the Persian Gulf.
Russia–Ukraine Conflict (2014 onwards) – Russia’s annexation of Crimea and subsequent tensions with the West led to sanctions, pipeline disputes, and a reassessment of Europe’s dependence on Russian gas.
These events highlight that geopolitical conflicts often trigger major shifts in energy markets, influencing both pricing and investment trends.
Recent Geopolitical Tensions Affecting Energy Markets
1. Russia–Ukraine War (2022–present)
Perhaps the most consequential recent example of geopolitics disrupting energy markets is the Russian invasion of Ukraine. Russia was a leading exporter of oil, natural gas, and coal. The European Union’s decision to impose sanctions and phase out Russian energy imports triggered a seismic shift in global energy flows.
Impact on Europe: European countries scrambled to secure alternative sources of natural gas, turning to liquefied natural gas (LNG) from the U.S., Qatar, and Australia. Germany rapidly built LNG terminals, while the EU boosted renewable energy investment to reduce dependence on imports.
Impact on Prices: Oil and gas prices surged to multi-year highs in 2022. The benchmark Brent crude briefly crossed $120 per barrel, while European gas prices hit unprecedented levels.
Global Realignment: The crisis deepened Russia’s energy partnership with China and India, as both nations increased imports of discounted Russian oil. This realignment signaled a shift in energy geopolitics toward a more multipolar world.
2. Middle East Instability
The Middle East remains a focal point of geopolitical tension, with conflicts in Israel–Palestine, Iran–Saudi rivalry, and Yemen affecting energy production and supply routes.
Strait of Hormuz: Nearly 20% of global oil passes through this narrow maritime chokepoint. Any threat to its stability, such as Iranian naval maneuvers or Western sanctions, instantly raises oil price volatility.
Iran and Sanctions: U.S. sanctions on Iran’s oil exports have repeatedly tightened global supply, forcing importers like India and China to diversify their sourcing strategies.
3. U.S.–China Strategic Competition
The energy market is also influenced by the broader strategic rivalry between the U.S. and China. As China is the world’s largest importer of oil and gas, its energy security policies have global repercussions.
Energy Supply Routes: China has invested heavily in pipelines and maritime routes through the Belt and Road Initiative (BRI) to reduce vulnerability to U.S.-controlled sea lanes.
Technology and Energy Transition: The U.S. and China are competing not only for fossil fuel security but also for dominance in renewable energy technologies, electric vehicles, and rare earth materials used in batteries.
4. OPEC+ Policy and Internal Tensions
The Organization of the Petroleum Exporting Countries (OPEC) and its allies (OPEC+) continue to play a central role in stabilizing or manipulating oil prices. However, internal political and economic tensions often create uncertainty.
Disagreements between Saudi Arabia and Russia over production quotas have led to volatile price swings.
Saudi Arabia’s Vision 2030 plan aims to diversify its economy, but oil revenue remains essential, linking its domestic stability to global oil demand.
Energy as a Strategic Weapon
Energy resources are frequently used as instruments of political leverage. For example:
Russia has repeatedly used gas supply as a geopolitical tool, cutting or limiting deliveries to Ukraine and Europe during disputes.
The U.S. uses its position as the world’s largest oil and gas producer to influence markets through strategic petroleum reserves and export controls.
OPEC decisions to cut or increase production can serve political objectives beyond pure market stabilization.
Such actions demonstrate that energy is not merely an economic commodity—it is a strategic asset used to advance national interests or punish adversaries.
Impact on Energy Prices and Global Inflation
Geopolitical tensions typically lead to supply disruptions or fears thereof, which in turn drive price volatility. Oil and gas prices are especially sensitive to perceived risk in producing regions.
For example:
The 2022–2023 European energy crisis pushed natural gas prices in Europe up by over 400%, triggering widespread inflation.
High energy costs ripple through the global economy, increasing transportation, manufacturing, and food prices.
Inflationary pressures have forced central banks to tighten monetary policies, contributing to slower economic growth.
Thus, geopolitical events in one region can have global macroeconomic consequences, illustrating the interconnectedness of energy and financial stability.
Energy Security and Policy Responses
Governments worldwide are adapting to growing geopolitical risks by prioritizing energy security and diversification.
Diversification of Supply: Countries are seeking new suppliers to reduce dependence on politically unstable regions. For example, the EU’s LNG diversification strategy post-Ukraine war.
Strategic Reserves: Many nations maintain strategic petroleum reserves to cushion against supply shocks.
Investment in Renewables: The transition toward renewable energy sources such as solar, wind, and hydrogen is increasingly viewed as a way to enhance long-term energy independence.
Regional Cooperation: Initiatives like the European Energy Union or India’s International Solar Alliance aim to strengthen collaborative resilience.
The Energy Transition and Geopolitical Realignment
The global push toward clean energy introduces a new layer of geopolitical complexity. While renewable energy reduces reliance on fossil fuel exporters, it also creates new dependencies—on minerals such as lithium, cobalt, and nickel used in batteries and solar panels.
China’s Dominance: China currently dominates the global supply chain for critical minerals and clean energy technologies. This gives it significant strategic leverage in the emerging energy economy.
New “Green” Geopolitics: Countries rich in rare earth elements, such as Chile, the Democratic Republic of Congo, and Australia, are becoming new centers of strategic competition.
Energy Transition Risks: Fossil fuel-dependent nations like Saudi Arabia, Russia, and Nigeria face economic vulnerability if demand for hydrocarbons declines faster than they can diversify.
Thus, while the energy transition may reduce some traditional geopolitical risks, it will likely create new ones centered around technology, minerals, and control of renewable infrastructure.
Future Outlook
The future of energy geopolitics will be shaped by several key trends:
Regionalization of Energy Trade: The post-globalization era may see more regional energy blocs, such as Asia’s growing intra-regional trade or Europe’s internal energy integration.
Technological Sovereignty: Nations will compete to control green technology supply chains—solar panels, hydrogen production, and carbon capture systems.
Strategic Energy Corridors: Pipelines, undersea cables, and new shipping routes (such as the Arctic route) will emerge as contested zones of influence.
Hybrid Energy Warfare: Cyberattacks on energy infrastructure, such as the 2021 Colonial Pipeline incident in the U.S., underscore the growing vulnerability of digitalized energy systems.
Conclusion
Geopolitical tensions and energy markets are inseparable. The global energy landscape is not determined solely by supply and demand fundamentals but also by power politics, alliances, and conflicts. From the oil crises of the 1970s to the Russia–Ukraine war, the world has repeatedly witnessed how geopolitical shocks can reshape energy flows, drive inflation, and influence economic stability.
As the world transitions to cleaner energy, new forms of energy geopolitics are emerging—centered on technology, critical minerals, and renewable dominance. Ensuring stable, affordable, and sustainable energy supplies in such a volatile geopolitical environment will require international cooperation, strategic diversification, and robust investment in energy innovation.
In essence, the 21st century’s energy security challenge lies not only in managing fossil fuel dependencies but also in navigating the geopolitical complexities of a rapidly transforming global energy order.

IMF’s Crucial Role in the Global EconomyIntroduction
The International Monetary Fund (IMF) stands as one of the most influential international financial institutions in the world. Established in 1944, it has played a pivotal role in maintaining global monetary stability, providing financial assistance to countries in distress, and shaping the world’s economic policies. Over the decades, the IMF has evolved from a post-war reconstruction tool into a global financial watchdog that guides nations through crises, fosters economic cooperation, and promotes sustainable development. Its crucial role is rooted in the principles of global economic interdependence, stability, and inclusive growth.
Historical Background and Foundation
The IMF was conceived during the Bretton Woods Conference in July 1944, held in New Hampshire, USA. This conference was attended by representatives of 44 nations who sought to rebuild the international economic order after the devastation of World War II. The primary architects, John Maynard Keynes from Britain and Harry Dexter White from the United States, envisioned a system that would ensure exchange rate stability and prevent the kind of competitive devaluations and trade barriers that contributed to the Great Depression.
The IMF officially came into existence on December 27, 1945, with 29 member countries signing its Articles of Agreement. Its initial mission was to oversee the fixed exchange rate system and provide short-term balance of payments assistance. Over time, as the world economy evolved—especially after the collapse of the Bretton Woods system in 1971—the IMF adapted its functions to address new global challenges.
Objectives of the IMF
The IMF’s mandate, as outlined in its Articles of Agreement, revolves around several key objectives:
Promoting International Monetary Cooperation – The IMF provides a forum for consultation and collaboration on international monetary issues among its 190+ member countries.
Ensuring Exchange Rate Stability – It aims to maintain stable exchange rates and prevent competitive devaluations that can destabilize trade and investment flows.
Facilitating Balanced Growth of Trade – The IMF works to promote the expansion of international trade, which contributes to economic growth and employment.
Providing Financial Assistance – It extends financial resources to member countries facing balance of payments problems, enabling them to stabilize their economies.
Reducing Global Poverty – Through concessional lending and structural reform programs, the IMF seeks to alleviate poverty, especially in developing nations.
These objectives make the IMF not just a lender of last resort but a central institution for economic governance, coordination, and stability.
Structure and Governance
The IMF’s structure reflects its global membership and collaborative nature. Its main organs include:
The Board of Governors – Composed of one governor from each member country, usually the finance minister or central bank governor. It meets annually to make key policy decisions.
The Executive Board – Consists of 24 Executive Directors representing member countries or groups of countries. It handles the day-to-day operations and decisions.
The Managing Director – The head of the IMF, appointed by the Executive Board, oversees the institution’s operations. Traditionally, the Managing Director is European, while the President of the World Bank is American—a reflection of post-war political arrangements.
Quota System – Each member’s financial contribution (quota) determines its voting power and access to IMF resources. The quota reflects the country’s relative size in the global economy.
While this structure is designed to balance representation, there have been debates about reforming the quota system to give emerging economies like China, India, and Brazil greater influence.
Functions of the IMF
The IMF’s role extends across several crucial domains:
1. Surveillance
IMF surveillance involves the monitoring of global, regional, and national economies to identify potential risks and recommend corrective measures. Through the Article IV Consultations, the IMF reviews each member country’s economic policies and provides policy advice. These reviews promote transparency, fiscal discipline, and effective governance.
The IMF also publishes the World Economic Outlook (WEO) and the Global Financial Stability Report (GFSR), which are highly respected analyses of global economic trends and risks.
2. Financial Assistance
When countries face severe economic crises, such as currency collapses or balance of payments deficits, the IMF provides financial support. This assistance is typically conditional on the implementation of policy reforms—known as IMF programs or conditionalities.
Some of the key lending instruments include:
Stand-By Arrangements (SBA): For short-term balance of payments problems.
Extended Fund Facility (EFF): For longer-term structural issues.
Poverty Reduction and Growth Trust (PRGT): For low-income countries at concessional rates.
Rapid Financing Instrument (RFI): For emergency assistance, such as during the COVID-19 pandemic.
These programs are designed to stabilize economies, restore investor confidence, and lay the groundwork for recovery.
3. Technical Assistance and Capacity Development
The IMF helps countries strengthen their institutions and human capital through training and technical assistance. This covers areas like fiscal policy, central banking, statistics, and legal frameworks. Such capacity-building programs are crucial for developing nations seeking to modernize their economies and manage resources effectively.
IMF’s Role in Global Financial Crises
The IMF has been central in managing several major financial crises throughout history. Its interventions have often defined the path of global recovery.
1. The Latin American Debt Crisis (1980s)
During the 1980s, many Latin American countries defaulted on their debts due to rising interest rates and falling commodity prices. The IMF stepped in with stabilization programs aimed at restructuring debt and curbing inflation. Although these programs helped restore macroeconomic stability, they were also criticized for imposing austerity measures that deepened poverty.
2. The Asian Financial Crisis (1997–1998)
The crisis that began in Thailand spread rapidly across East Asia, leading to currency collapses and severe recessions. The IMF provided substantial financial packages to countries like Indonesia, South Korea, and Thailand. However, its insistence on fiscal austerity and structural reforms was controversial, with some critics arguing that these policies worsened the downturn. Nonetheless, the IMF later adapted its approach, incorporating lessons from this crisis.
3. The Global Financial Crisis (2008–2009)
The 2008 crisis marked a turning point for the IMF. For the first time in decades, advanced economies sought IMF advice and support. The institution played a key role in coordinating global stimulus measures, advising on monetary easing, and supporting emerging economies with emergency funds. The IMF also increased its lending capacity and introduced flexible credit lines to respond more effectively to future shocks.
4. The COVID-19 Pandemic (2020–2022)
The pandemic triggered an unprecedented global economic shutdown. The IMF acted swiftly, approving over $250 billion in financial support to more than 90 countries. It created emergency lending mechanisms and temporarily suspended debt payments for low-income countries. The IMF also emphasized inclusive recovery, digital transformation, and climate resilience as new priorities.
IMF’s Role in Developing Economies
Beyond crisis management, the IMF plays a vital role in supporting developing and low-income nations. Through its Poverty Reduction and Growth Trust (PRGT) and Extended Credit Facility (ECF), the IMF offers low-interest or interest-free loans to promote sustainable growth.
The IMF’s support extends to:
Encouraging fiscal responsibility and public financial management.
Advising on tax reforms to improve revenue collection.
Supporting exchange rate stability and foreign reserve management.
Promoting structural reforms that attract investment and create jobs.
However, the IMF’s involvement in developing countries is often debated. Critics argue that its policy prescriptions sometimes prioritize financial stability over social welfare. In response, the IMF has increasingly integrated social spending protections and climate policies into its programs.
Criticisms and Controversies
Despite its critical role, the IMF has faced substantial criticism over the years:
Austerity Measures:
IMF programs often require governments to cut public spending and increase taxes, leading to social unrest and inequality.
Sovereignty Concerns:
Countries receiving IMF loans must often implement policy reforms dictated by the Fund, which some view as external interference.
Western Dominance:
The United States and European countries hold disproportionate voting power, raising questions about fairness and representation.
One-Size-Fits-All Policies:
Critics argue that the IMF’s macroeconomic models do not always account for the unique conditions of individual economies.
Slow Adaptation to Climate and Inequality Issues:
Although the IMF has recently embraced climate finance and inclusive growth, its traditional focus on fiscal stability sometimes limits flexibility.
Despite these criticisms, the IMF has made significant efforts to reform its approach—introducing debt sustainability analyses, gender equality frameworks, and climate resilience funding.
IMF’s Modern Role: A Shift Toward Sustainability
In recent years, the IMF’s priorities have broadened beyond financial stability to encompass inclusive and sustainable development. Key initiatives include:
Climate Change:
The IMF now assesses climate risks in its surveillance and offers support for green transitions through its Resilience and Sustainability Trust (RST).
Digital Finance:
It monitors the rise of central bank digital currencies (CBDCs) and crypto-assets, ensuring global financial stability in the digital era.
Gender Equality and Social Inclusion:
Recognizing that inequality can undermine growth, the IMF integrates social spending and gender equality goals into its programs.
Debt Transparency:
It promotes clear reporting of public debt to avoid hidden liabilities that could trigger future crises.
These reforms signify the IMF’s evolution into a comprehensive guardian of global stability, addressing not only monetary issues but also social and environmental challenges.
Conclusion
The International Monetary Fund remains a cornerstone of the global financial system. From its origins in the post-war era to its modern-day role in managing crises, supporting development, and promoting sustainability, the IMF has continuously adapted to a changing world.
Its crucial role lies in balancing economic stability with social progress, bridging the gap between nations, and offering a safety net in times of uncertainty. Despite its flaws and criticisms, the IMF’s presence ensures that no nation stands alone in the face of economic turbulence. As globalization deepens and new challenges—like digital disruption and climate change—emerge, the IMF’s role will become even more essential in shaping a resilient, inclusive, and sustainable world economy.
SPX500 (Sp500) SPX500: Bulls Maintain Strong Control
The SPX500 is currently trading around 6875, with bullish momentum firmly intact. Market sentiment remains optimistic as buyers continue to dominate price action, supported by strong breadth and resilience across key sectors.
As long as the index sustains above recent support zones, the near-term outlook favors further upside. Potential upside targets can be observed around 7007, 7209, and 7512 in the sessions ahead.
While short-term consolidations are possible, the broader trend structure continues to point toward strength and continuation of the prevailing uptrend.
This analysis is intended for educational purposes and reflects a professional market outlook, not financial advice.

6969An important note to my previous idea. We have a slightly different picture on SPX. Since SPX didn't go below 6550 it needs to reach 6969 level in order for the Fib target levels to match the same levels as on US500. Is this someone's joke? ...
Anyway the price is at the channel resistance on both charts, so I expect a strong pullback to start soon.

S&P 500 Analysis – 26 October 2025
- S&P 500 broke resistance level 6800.00
- Likely to rise to resistance level 7000.00
S&P 500 index opened today with the upward gap which broke the key resistance level 6800.00 (which stopped the previous impulse wave (3) at the start of October, as can be seen from the daily S&P 500 index chart below).
The breakout of the resistance level 6800.00 accelerated the active minor impulse wave 3 of the medium-term impulse sequence (5) from the start of this month.
Having just broken out of the daily up channel from August, S&P 500 index can be expected to rise to the next round resistance level 7000.00, target price for the completion of the active impulse wave 3.

Weekly Outlook: XAUUSD, #SP500, #BRENT for 27-31 October 2025XAUUSD: BUY 4075.00, SL 4025.00, TP 4225.00
Gold starts the week near record territory, with spot prices fluctuating around $4,080 per ounce. Support comes from expectations of a Federal Reserve rate cut at the October 28–29 meeting and the recent pullback in U.S. Treasury yields ahead of the decision. Headlines about a potential temporary government funding pause in the U.S. and delayed data releases enhance gold’s role as a defensive asset, while September inflation came in slightly below expectations, reinforcing the case for policy easing. In addition, fund inflows into gold have stayed strong after October’s price spike.
The fundamental backdrop remains constructive: World Gold Council data point to renewed net purchases by central banks late in the summer, and October saw more active investment flows into “paper” gold as market volatility rose and real yields eased. Risks to this view include a more cautious Fed tone and a brief dollar rebound after the decision, but these are offset by steady institutional demand and ongoing geopolitical uncertainty.
Trade idea: BUY 4075.00, SL 4025.00, TP 4225.00
#SP500: BUY 6785, SL 6705, TP 7025
U.S. equities enter the week on strong footing: the S&P 500 holds near 6,790 after softer September inflation data and lower government bond yields. Markets are focused on the Fed’s October 28–29 decision; the prevailing view anticipates another rate cut, which would reduce borrowing costs and support the valuation of future earnings. The reporting season is in full swing, with expectations for double-digit earnings growth for 2025 and a busy week of results from index constituents.
Fundamentally, the index benefits from a combination of easing rate pressure, resilient profit expectations in sectors tied to digital infrastructure and AI-related investment, and a broadly steady consumer backdrop. Key risks include any prolonged disruption to federal services that could distort the macro data flow, and the chance of tighter corporate guidance given currency strength and fluctuations in global electronics demand.
Trade idea: BUY 6785, SL 6705, TP 7025
#BRENT: SELL 66.30, SL 68.00, TP 61.20
Brent trades around $66 per barrel. The weekly news flow is mixed: on one hand, infrastructure risks linger in the Black and Baltic Sea regions; on the other, international agencies flag accelerating supply growth alongside moderate demand. The earlier OPEC+ decision to allow a marginal output increase and revised surplus projections effectively cap prices despite sporadic supply disruptions and sanctions-related headlines.
By late October, industry assessments imply a gradual rebuild in inventories and a softer price path into Q4, albeit with elevated headline-driven volatility. Additional pressure comes from a cooler global backdrop and rising non-OPEC+ production, while any Fed rate cut would only partly lift the commodity complex. Short-position risks include an escalation of geopolitical tensions that threatens exports and an unexpectedly sharp draw in weekly U.S. stock data.
Trade idea: SELL 66.30, SL 68.00, TP 61.20

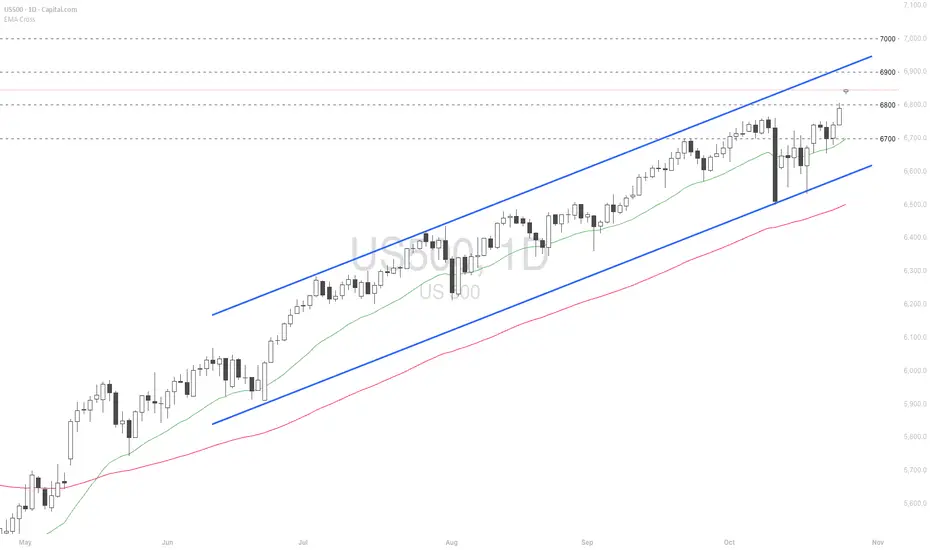
SPX500: Trump's trip to East Asia shakes marketsHello Traders,
This is the Daily Chart!!
We had great bullish year! A bullish channel is crystal clear! we are about to be considered as overbought buyers! But since it's stocks and the channel is broken, we are till bullish!!
And this is the chart of recent 3M,
1- the break is powerful.
2- we need a correction, technically.
3- we are about the mid-term channel.
4- top of the long-term channel could also be firsthand support, they call it SL hunt, I don't.

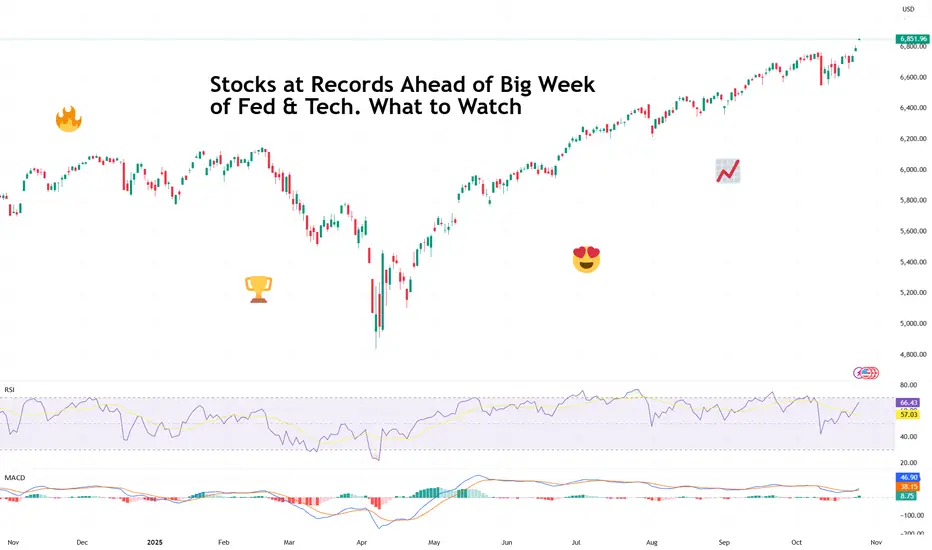
Stocks at Records Ahead of Big Week of Fed & Tech. What to WatchRecord highs, rate-cut optimism, five tech giants on deck — what a time to be a market participant!
It’s Monday, and Wall Street is back doing what it does best — setting new records and pretending not to worry about what comes next.
After a cooler-than-expected inflation print and some diplomatic smiles from Washington and Beijing, all three major indexes are kicking off the week in full throttle.
Last Friday, the Dow Jones Industrial Average TVC:DJI finally closed north of 47,000 for the first time ever, rising 472 points, or 1%.
You know that feeling when you hit every green light on the way to work? That’s what Friday felt like. The S&P 500 SP:SPX climbed 0.8%, and the Nasdaq Composite NASDAQ:IXIC gained 1.2%. Together, the trio ended the week at record highs.
The spark? September’s Consumer Price Index ECONOMICS:USCPI rose 3.0%, slightly below the 3.1% expected. Traders took that as a nod from the economy that the Federal Reserve can keep easing off the monetary brakes.
Odds of at least a half-point in rate cuts by year-end jumped to nearly 97%, according to the CME FedWatch Tool.
Soft inflation, strong sentiment, and new highs — *insert feelsgoodman meme.*
🤝 A Trade Truce (For Now)
Adding to optimism, US and Chinese negotiators sounded unusually positive over the weekend. The two sides reportedly hammered out a trade framework, setting the stage for President Donald Trump and Chinese leader Xi Jinping to meet in South Korea later this week.
Treasury Secretary Scott Bessent said the talks “ought to pave the way” for a broader discussion on tariffs, tech transfers, and everything in between — the kind of vague optimism that markets eat up like comfort food.
For now, investors are choosing to focus on the handshake rather than the fine print. After all, in the markets, hope is often more powerful than details.
🏦 The Fed’s Big Moment
The main event, however, comes midweek. The Federal Reserve is widely expected to cut interest rates ECONOMICS:USINTR by a quarter point on Wednesday. But the real show starts after the decision, when Jerome Powell takes the mic.
Traders will be parsing every word of his press conference for hints on how much further the Fed is willing to go. The tone of his remarks could determine whether markets keep coasting at record highs — or finally take a breather.
So far, Powell has managed to thread the needle: easing just enough to keep growth alive without letting inflation flare back up. But with stocks at all-time highs and job data still missing due to the government shutdown, he’s got a tough balancing act.
💻 Big Tech Takes the Stage
Anyway, peak earnings season is here and if macro policy is the first act this week, Big Tech earnings are the broader narrative.
Five members of the Magnificent Seven — Microsoft NASDAQ:MSFT , Alphabet NASDAQ:GOOGL , Meta NASDAQ:META , Apple NASDAQ:AAPL , and Amazon NASDAQ:AMZN — will all report their latest results.
That’s roughly $12 trillion in combined market cap stepping into the spotlight.
After a few solid years of sky-high expectations around AI, cloud, and advertising recovery, investors are craving proof that the hype is translating into actual earnings.
The question isn’t whether these companies are still dominant — it’s whether they can keep growing fast enough to justify valuations that have already priced in perfection.
Microsoft, Meta and Alphabet kick things off Wednesday, Apple and Amazon step up Thursday. Somewhere between all that, expect social media feeds to explode with charts, hot takes, and the occasional meme about “buying the dip” before it even happens.
🌍 Markets in a Mood
It’s one of those rare weeks when every major force — central banks, geopolitics, and tech earnings — converge into a single market narrative. And, by the looks of it, that narrative is leaning bullish.
Still, keep an eye out for surprises.
Off to you : Where do you think markets are heading this week? Are you excited to snap up some tech shares ahead of the updates or looking to play defense? Share your thoughts in the comments!
SPX500 On the way to the upside! BUY NOWSPX500 is in a clear upwards channel and has broken the last bit of resistance (white line shown) - this is a clear confirmation that the next target will be the next resistance zone to the upside shown above (this is a great buy trade opportunity)
US500Trading forex based on strong fundamentals is beneficial because it allows investors to make informed decisions grounded in real economic data rather than speculation. By analyzing key indicators like interest rates, inflation, GDP growth, employment, and geopolitical stability, a trader can anticipate currency movements driven by macroeconomic forces. This approach helps identify long-term trends and reduces emotional or impulsive trading, offering more consistent and sustainable profits. In essence, good fundamentals turn forex trading from a gamble into a strategic investment rooted in economic reality.

SPX500 ShortElite Analysis
Short on spx500, price gave us the reversal after liquidation of asia high on 1m tf
Targeting lower liquidity pools

SPX | Daily Analysis #7 - 27 October 2025Hello and welcome back to DP Weekly Market Review,
Past Week Overview:
The past week saw a strong inflow of volume from investors optimistic about a market rebound, following the sharp two-week decline driven by renewed U.S.–China trade tensions. The S&P 500 initially showed a K-shaped reaction, but buyers quickly stepped in, pushing prices higher. By Friday, the market not only recovered but also broke above the previous high, setting a new record.
On Sunday, Treasury Secretary Bessent announced that the U.S. and China are ready to reach a trade agreement. This news fueled bullish sentiment in the Asian session, causing a major gap-up in the markets, with the index opening around the 6,850 zone.
Week Ahead:
This week stands as one of the most critical of the quarter for global markets.
Federal Reserve Decision: All eyes are on the Fed’s rate announcement—whether they hike, cut, or hold. Every word from Chair Powell regarding “soft landing,” “inflation progress,” or “economic resilience” could move global markets sharply.
Tech Earnings Season: The “Tech Titans” — Apple, Microsoft, Meta, Amazon, and Google — report their earnings this week. These giants collectively account for around 35% of the Nasdaq’s total weight.
U.S.–China Relations: President Trump is expected to meet President Xi for the first time in his second term, with trade tensions still in the background.
1H – 4H Technical Outlook:
As shown on the chart, the market opened with a large bullish gap. Some short-term traders anticipate a pullback to fill the gap, which could push prices down toward the 6,800 area. However, a sustained move above 6,860 may signal further bullish momentum toward the upside.
Trading Strategy:
For now, patience is key — let the market reveal its reaction around key price zones before entering new positions.
Disclaimer:
This content is for informational purposes only and does not constitute financial or investment advice. © DIBAPRISM
Amir D.Kohn

S&P 500 ready for correction?Hi Guys,
The sharp selloff on the US indices recently was a sign of further selling to come on the US Indices. As with just about all corrections there is the selling pressure in the form of an engulfing candle or breach of support etc, that indicates that the correction is imminent.
There is strong confluence to support a case for a nice pullback.
Firstly index is approaching 7000. Psychological number and if one takes a look at every time 1000 points has been reached the SP 500 has had a pullback.
Secondly the 1.618 fib retracement of the most recent correction is almost exactly at the 7000 mark.
Last of all , trendline resistance from recent price action and also from last few years lies in same area.
Sell trades using lower time frames, with price action candlestick chart patterns could result in some nice risk to reward trades.
Safe Trading all

S&P 500 made new all time highs of 6807- S&P 500 does not left behind, it also made new all time highs from Shocks of Tariffs to Market Recovery 📈
- The U.S. market witnessed a sharp 3% drop after Trump’s 100% tariff announcement on China, wiping off nearly $3 trillion in market cap.
- Yet, in just 15 days, the index bounced back, adding back those trillions and stabilizing near a $58 trillion market cap.
- Volatility remains high as trade tensions and election uncertainty drive investor sentiment. ⚖️

US stocks hit record highs on better-than-expected CPI
The Sep US CPI indicated that tariff-driven inflation has not materialized, reinforcing the Fed’s dovish policy stance and driving US equities to new record highs. The prevailing view in the market remains with “Don’t fight the Fed.” The stock market’s impressive resilience, defying the typical seasonal weakness through Oct, reflects a dovish Fed stance amid the absence of recession signals.
The S&P; 500 remained within the ascending channel, reaching a new high at 6,800. Diverging bullish EMAs suggest that the bullish structure may extend further. If the index closes above 6,800, it could advance toward 6,900. Conversely, a drop below 6,800 may lead the price to retreat toward 6,700, which coincides with EMA21.
SPX500 | Price Falling Toward Key Pullback SupportS&P500 is falling towards the buy entry at 6,752.42, which is a pullback support that aligns with the 23.6% and the 38.2% Fibonacci retracement and could bounce from this level to the upside.
Stop loss is at 6,712.42, which is a pullback support that lines up with the 61.8% Fibonacci retracement.
Take profit is at 6,837.58, which aligns with the 78.6% Fibonacci projection.
Stratos Markets Limited (tradu.com ):
CFDs are complex instruments and come with a high risk of losing money rapidly due to leverage. 68% of retail investor accounts lose money when trading CFDs with this provider. You should consider whether you understand how CFDs work and whether you can afford to take the high risk of losing your money.
Stratos Europe Ltd (tradu.com ):
CFDs are complex instruments and come with a high risk of losing money rapidly due to leverage. 70% of retail investor accounts lose money when trading CFDs with this provider. You should consider whether you understand how CFDs work and whether you can afford to take the high risk of losing your money.
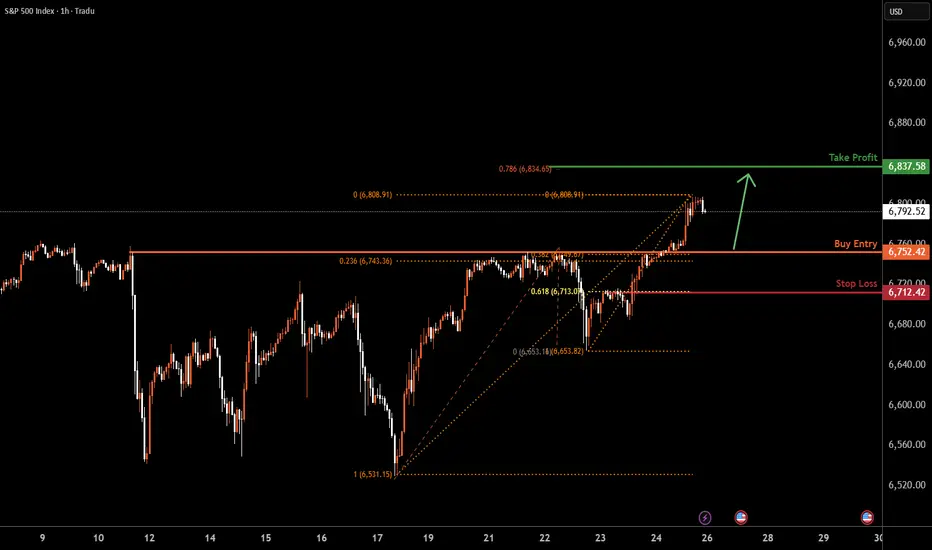
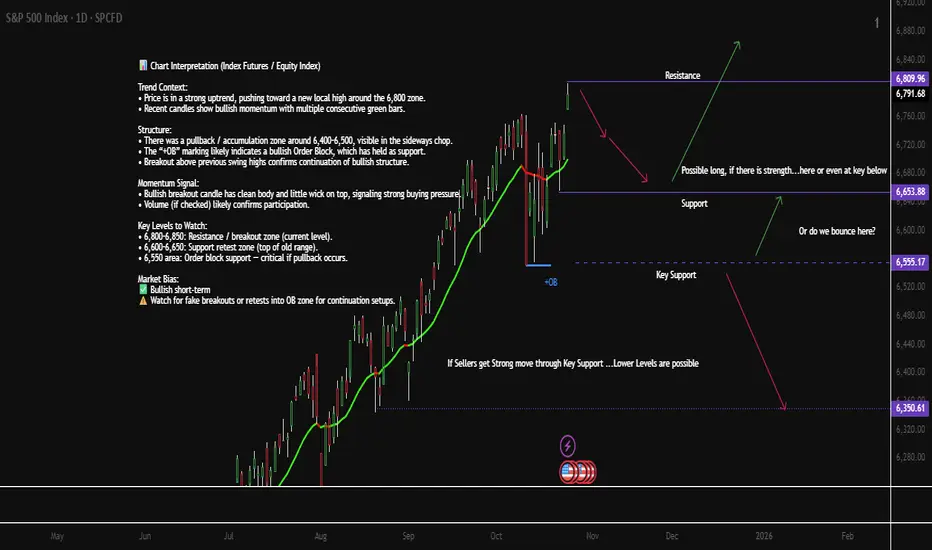
Chart Interpretation (Index Futures / Equity Index) SPX / S&PChart Interpretation (Index Futures / Equity Index)
TECHNICAL ANALYSIS
Trend Context:
• Price is in a strong uptrend, pushing toward a new local high around the 6,800 zone.
• Recent candles show bullish momentum with multiple consecutive green bars.
Structure:
• There was a pullback / accumulation zone around 6,400–6,500, visible in the sideways chop.
• The “+OB” marking likely indicates a bullish Order Block, which has held as support.
• Breakout above previous swing highs confirms continuation of bullish structure.
Momentum Signal:
• Bullish breakout candle has clean body and little wick on top, signaling strong buying pressure.
• Volume (if checked) likely confirms participation.
Key Levels to Watch:
• 6,800–6,850: Resistance / breakout zone (current level).
• 6,600–6,650: Support retest zone (top of old range).
• 6,450 area: Order block support — critical if pullback occurs.
Market Bias: Bullish short-term
Watch for fake breakouts or retests into OB zone for continuation setups.
FUNDEMENTAL ANALYSIS
U.S. Market Key Events — Week of Oct 27–31
Mon Oct 27
• 4:00 AM — 🇪🇺 German IFO Business Climate (watch EUR tone early session)
Tue Oct 28
• 9:00 AM — 🇺🇸 Richmond Manufacturing Index
• Tentative — 🇺🇸 CB Consumer Confidence
Wed Oct 29
• 9:00 AM — 🇺🇸 Pending Home Sales m/m
• 1:00 PM — 🇺🇸 Federal Funds Rate Decision (FOMC)
• 1:30 PM — 🇺🇸 FOMC Press Conference (high impact)
Thu Oct 30
• Tentative — 🇺🇸 Advance GDP q/q
• Tentative — 🇺🇸 Advance GDP Price Index
U.S.–China Trade Talks (market sensitivity risk)
Fri Oct 31
• Tentative — 🇺🇸 Core PCE Price Index m/m
• Tentative — 🇺🇸 Employment Cost Index q/q
📝 Focus on FOMC (Wed), GDP & Trade Talks (Thu), Core PCE (Fri) — high impact sessions for S&P / Dow / USD.
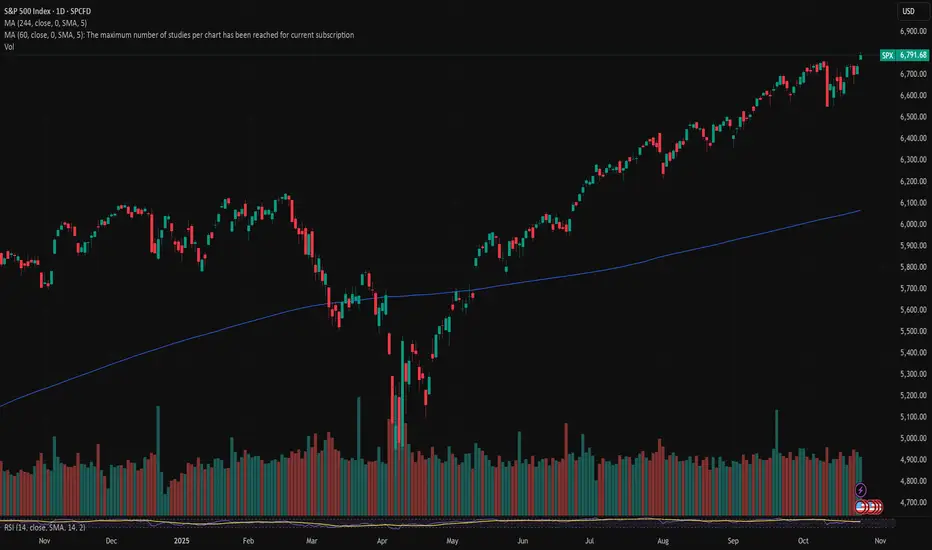
SPX: Back to the old path?Although a trading week on the US equity markets was a bit uncertain, still, Friday's US inflation figures brought back market optimism and pushed the S&P 500 to another all-time highest level during this year. Posted data showed that inflation was holding relatively firmly in September at the level of 3,0% on a yearly basis, which increased investors expectations that the Fed might cut interest rates by another 25 basis points on Wednesday, October 29th, when the FOMC meeting will be held. The S&P 500 reached the level of 6.805 on Friday, and closed the week at 6.791.
Tech companies were leading the surge in the index value, however, this time the financial sector benefited. Investors are expecting that the environment of decreased interest rates will support banks lending and increase their profits in the future period. Big names like JPMorgan, Wells Fargo and Citigroup were traded higher by 2%.
Apple was the company who was in the spotlight of investors, whose shares reached an all time highest level, helped by fresh optimism around demand for the iPhone 17 series, both on the US and China markets. Amazon had a bumpy start of the week, when Amazon Web Services (AWS) suffered a major global outage, affecting thousands of apps, websites and services worldwide. Still, their share price managed to surge by 1,6% till the end of the week. Regardless of the relatively volatile week, Nvidia shares continue to be traded with a strong demand following upbeat signals for a demand for its Blackwell GPU platforms and other AI infrastructure. A rally in the Broader AI and semiconductor supply chain (e.g. Taiwan Semiconductor Manufacturing Company) helped propel sentiment around Nvidia.
The week ahead might also be a volatile one, considering that the FOMC meeting will be held on Wednesday. Markets are currently expecting that the Fed will cut interest rates by 25 bps. In this case, the market optimism will continue. However, it should be noted that the US equity markets continue to be sensitive to fundamentals. Risks hold around trade-tariffs and the US Government “shutdown”.
Up again for SPX500USDHi traders,
Last week SPX500USD went up (making a Triangle invalid), made a correction down and went up again. It looks like the coreection was a running flat.
So now price could be in the next impulsive wave 5 (red) up and next week we could see more upside for this pair.
Let's see what the market does and react.
Trade idea: Wait for the finish of this bigger correction. Trading inside a Triangle is a sure way to lose.
This shared post is only my point of view on what could be the next move in this pair based on my technical analysis.
But I react and trade on what I see in the chart, not what I've predicted or expect.
Don't be emotional, just trade your plan!
Eduwave

Fib's extensionIf so, then this thing won't stop until it reaches the purple level. That's where the correction could really begin. I'm not ready to say when yet, because the angle of attack could be either gradual or exponential, depending on the economy and the political situation.

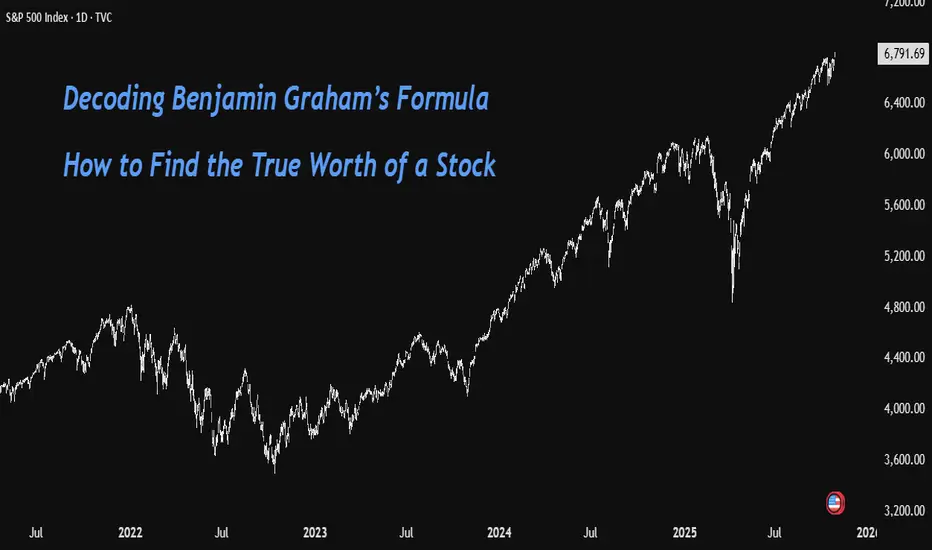
Graham's Formula for Intrinsic Value of a Stock➡ About Benjamin Graham
Benjamin Graham is widely known as the Father of Value Investing. He was a professor, economist, and mentor to great investors like Warren Buffett. Graham’s investment philosophy focused on buying stocks below their intrinsic value to ensure a margin of safety and protecting capital even when markets behave irrationally. His books The Intelligent Investor and Security Analysis remain timeless classics in the world of investing.
➡ His Formula to Calculate the Intrinsic Value of a Stock
Graham designed a simple mathematical model to estimate what a stock is truly worth- its intrinsic value.
Formula:
V=EPS×(8.5+2g)
Later, he modified it to account for changing interest rates:
V= /Y
Meaning of Each Value in the Formula
V: Intrinsic value or the fair value of the stock.
EPS: Earnings per share (trailing twelve months).
8.5: Base P/E ratio for a no-growth company.
g: Expected annual earnings growth rate (for next 7–10 years).
4.4: Average yield on high-grade corporate bonds when Graham proposed the formula.
Y: Current yield on AAA-rated corporate bonds (used to adjust for changing interest rate conditions).
➡ How to Calculate
Let' sunderstand the calculations with the help of an example of NVDA stock:
EPS= 3.5 (TTM)
Growth rate= 32.8 (next 3-5years)
Y= 4.09
All other values remain the same
V= / 4.09
V= 279
So, the intrinsic value of the stock would be around 279
Current price= 186
Difference= 67%
Hence the Formula suggests that the current price is still way below its fair value and hence buyable.
➡ Are these Too Aggressive Valuations?
Yes, it may be too optimistic. The term '2g' gives very high weightage to growth, which can inflate valuations quickly. In a world where corporate earnings growth is less predictable and global interest rates fluctuate, this approach may overvalue companies that appear to have strong growth potential on paper.
➡ Relevance in the Current Market Scenario
While Graham’s formula is historically important and a great conceptual framework for understanding valuation, it should not be used as a standalone tool today. Markets are far more complex and influenced by globalization, technology, inflation, and interest rate cycles.
A more balanced approach is to use Graham’s principles (margin of safety, valuation discipline) but rely on modern valuation models like Discounted Cash Flow (DCF) or Relative Valuation Ratios and treat the formula as a learning foundation rather than a precise valuation tool.
What do you think about this tool for calculating a stock's valuation?
Is it still relevant?
Do 🚀 comment 💬
Disclaimer: I am not a valuation analysis expert so apply your due diligence while investing. The stock example taken in this educational post is just for demonstration purpose and not a buy/sell recommendation.