US stocks hit record highs on better-than-expected CPI
The Sep US CPI indicated that tariff-driven inflation has not materialized, reinforcing the Fed’s dovish policy stance and driving US equities to new record highs. The prevailing view in the market remains with “Don’t fight the Fed.” The stock market’s impressive resilience, defying the typical seasonal weakness through Oct, reflects a dovish Fed stance amid the absence of recession signals.
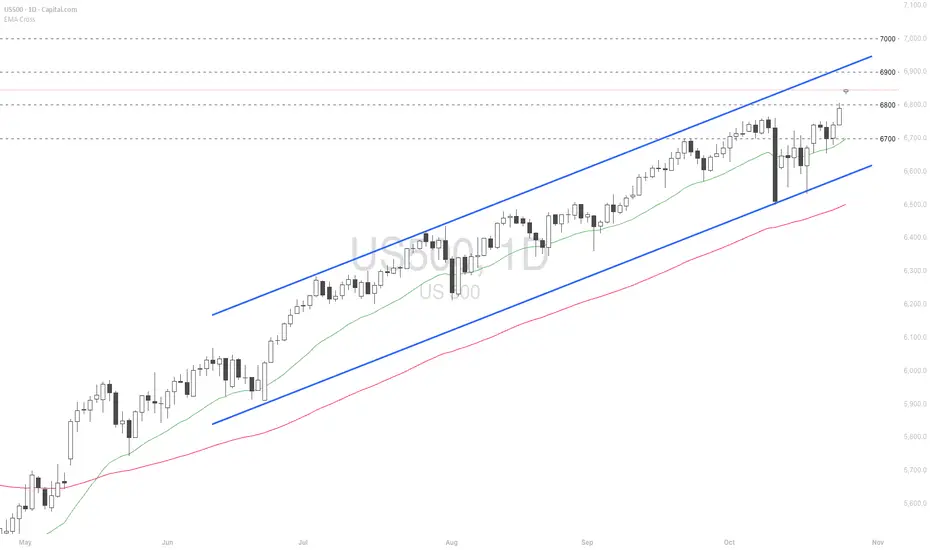
The S&P; 500 remained within the ascending channel, reaching a new high at 6,800. Diverging bullish EMAs suggest that the bullish structure may extend further. If the index closes above 6,800, it could advance toward 6,900. Conversely, a drop below 6,800 may lead the price to retreat toward 6,700, which coincides with EMA21.
Trade ideas
SPX500 | Price Falling Toward Key Pullback SupportS&P500 is falling towards the buy entry at 6,752.42, which is a pullback support that aligns with the 23.6% and the 38.2% Fibonacci retracement and could bounce from this level to the upside.
Stop loss is at 6,712.42, which is a pullback support that lines up with the 61.8% Fibonacci retracement.
Take profit is at 6,837.58, which aligns with the 78.6% Fibonacci projection.
Stratos Markets Limited (tradu.com ):
CFDs are complex instruments and come with a high risk of losing money rapidly due to leverage. 68% of retail investor accounts lose money when trading CFDs with this provider. You should consider whether you understand how CFDs work and whether you can afford to take the high risk of losing your money.
Stratos Europe Ltd (tradu.com ):
CFDs are complex instruments and come with a high risk of losing money rapidly due to leverage. 70% of retail investor accounts lose money when trading CFDs with this provider. You should consider whether you understand how CFDs work and whether you can afford to take the high risk of losing your money.
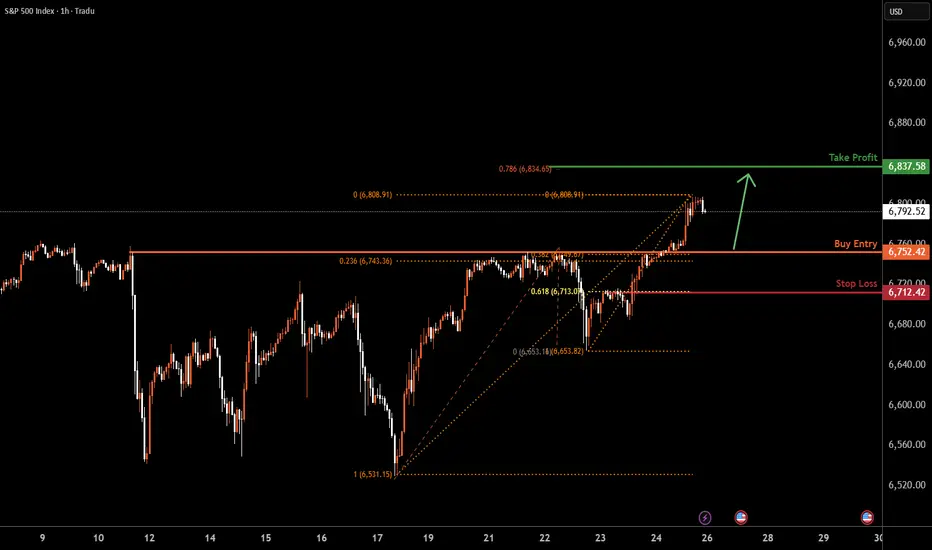
Chart Interpretation (Index Futures / Equity Index) SPX / S&PChart Interpretation (Index Futures / Equity Index)
TECHNICAL ANALYSIS
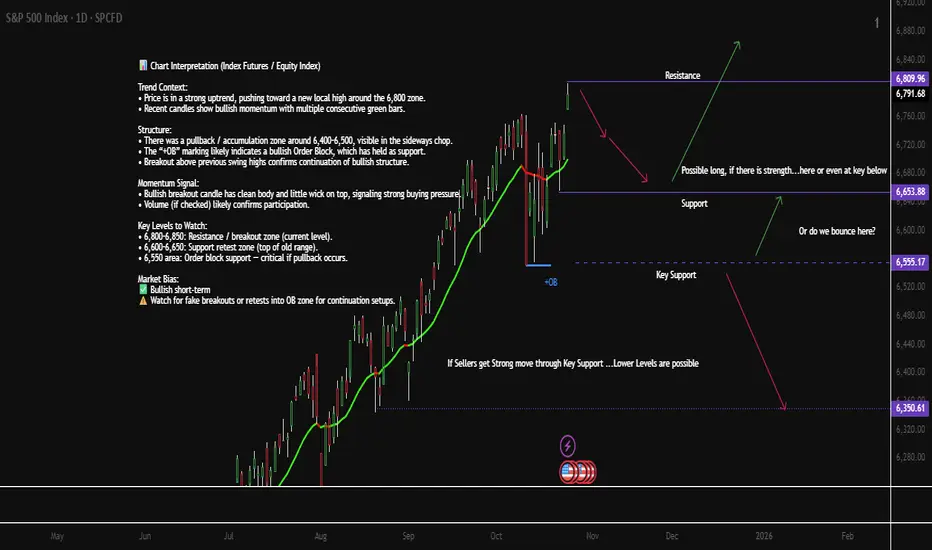
Trend Context:
• Price is in a strong uptrend, pushing toward a new local high around the 6,800 zone.
• Recent candles show bullish momentum with multiple consecutive green bars.
Structure:
• There was a pullback / accumulation zone around 6,400–6,500, visible in the sideways chop.
• The “+OB” marking likely indicates a bullish Order Block, which has held as support.
• Breakout above previous swing highs confirms continuation of bullish structure.
Momentum Signal:
• Bullish breakout candle has clean body and little wick on top, signaling strong buying pressure.
• Volume (if checked) likely confirms participation.
Key Levels to Watch:
• 6,800–6,850: Resistance / breakout zone (current level).
• 6,600–6,650: Support retest zone (top of old range).
• 6,450 area: Order block support — critical if pullback occurs.
Market Bias: Bullish short-term
Watch for fake breakouts or retests into OB zone for continuation setups.
FUNDEMENTAL ANALYSIS
U.S. Market Key Events — Week of Oct 27–31
Mon Oct 27
• 4:00 AM — 🇪🇺 German IFO Business Climate (watch EUR tone early session)
Tue Oct 28
• 9:00 AM — 🇺🇸 Richmond Manufacturing Index
• Tentative — 🇺🇸 CB Consumer Confidence
Wed Oct 29
• 9:00 AM — 🇺🇸 Pending Home Sales m/m
• 1:00 PM — 🇺🇸 Federal Funds Rate Decision (FOMC)
• 1:30 PM — 🇺🇸 FOMC Press Conference (high impact)
Thu Oct 30
• Tentative — 🇺🇸 Advance GDP q/q
• Tentative — 🇺🇸 Advance GDP Price Index
U.S.–China Trade Talks (market sensitivity risk)
Fri Oct 31
• Tentative — 🇺🇸 Core PCE Price Index m/m
• Tentative — 🇺🇸 Employment Cost Index q/q
📝 Focus on FOMC (Wed), GDP & Trade Talks (Thu), Core PCE (Fri) — high impact sessions for S&P / Dow / USD.
SPX: Back to the old path?Although a trading week on the US equity markets was a bit uncertain, still, Friday's US inflation figures brought back market optimism and pushed the S&P 500 to another all-time highest level during this year. Posted data showed that inflation was holding relatively firmly in September at the level of 3,0% on a yearly basis, which increased investors expectations that the Fed might cut interest rates by another 25 basis points on Wednesday, October 29th, when the FOMC meeting will be held. The S&P 500 reached the level of 6.805 on Friday, and closed the week at 6.791.
Tech companies were leading the surge in the index value, however, this time the financial sector benefited. Investors are expecting that the environment of decreased interest rates will support banks lending and increase their profits in the future period. Big names like JPMorgan, Wells Fargo and Citigroup were traded higher by 2%.
Apple was the company who was in the spotlight of investors, whose shares reached an all time highest level, helped by fresh optimism around demand for the iPhone 17 series, both on the US and China markets. Amazon had a bumpy start of the week, when Amazon Web Services (AWS) suffered a major global outage, affecting thousands of apps, websites and services worldwide. Still, their share price managed to surge by 1,6% till the end of the week. Regardless of the relatively volatile week, Nvidia shares continue to be traded with a strong demand following upbeat signals for a demand for its Blackwell GPU platforms and other AI infrastructure. A rally in the Broader AI and semiconductor supply chain (e.g. Taiwan Semiconductor Manufacturing Company) helped propel sentiment around Nvidia.
The week ahead might also be a volatile one, considering that the FOMC meeting will be held on Wednesday. Markets are currently expecting that the Fed will cut interest rates by 25 bps. In this case, the market optimism will continue. However, it should be noted that the US equity markets continue to be sensitive to fundamentals. Risks hold around trade-tariffs and the US Government “shutdown”.
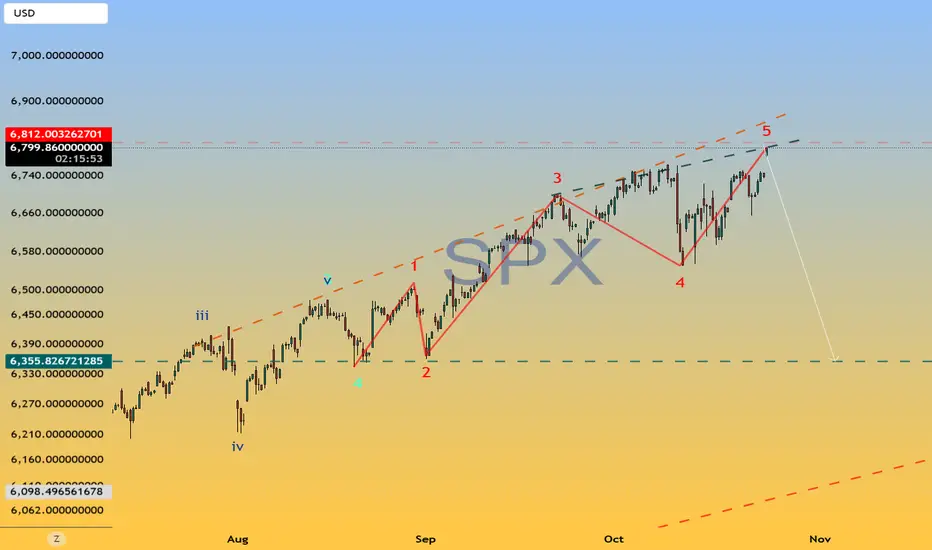
Up again for SPX500USDHi traders,
Last week SPX500USD went up (making a Triangle invalid), made a correction down and went up again. It looks like the coreection was a running flat.
So now price could be in the next impulsive wave 5 (red) up and next week we could see more upside for this pair.
Let's see what the market does and react.
Trade idea: Wait for the finish of this bigger correction. Trading inside a Triangle is a sure way to lose.
This shared post is only my point of view on what could be the next move in this pair based on my technical analysis.
But I react and trade on what I see in the chart, not what I've predicted or expect.
Don't be emotional, just trade your plan!
Eduwave

Fib's extensionIf so, then this thing won't stop until it reaches the purple level. That's where the correction could really begin. I'm not ready to say when yet, because the angle of attack could be either gradual or exponential, depending on the economy and the political situation.

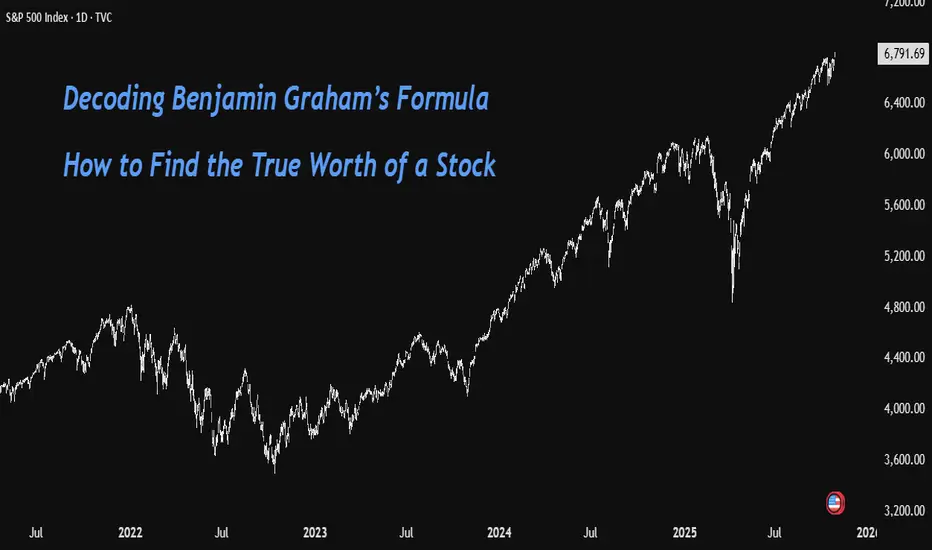
Graham's Formula for Intrinsic Value of a Stock➡ About Benjamin Graham
Benjamin Graham is widely known as the Father of Value Investing. He was a professor, economist, and mentor to great investors like Warren Buffett. Graham’s investment philosophy focused on buying stocks below their intrinsic value to ensure a margin of safety and protecting capital even when markets behave irrationally. His books The Intelligent Investor and Security Analysis remain timeless classics in the world of investing.
➡ His Formula to Calculate the Intrinsic Value of a Stock
Graham designed a simple mathematical model to estimate what a stock is truly worth- its intrinsic value.
Formula:
V=EPS×(8.5+2g)
Later, he modified it to account for changing interest rates:
V= /Y
Meaning of Each Value in the Formula
V: Intrinsic value or the fair value of the stock.
EPS: Earnings per share (trailing twelve months).
8.5: Base P/E ratio for a no-growth company.
g: Expected annual earnings growth rate (for next 7–10 years).
4.4: Average yield on high-grade corporate bonds when Graham proposed the formula.
Y: Current yield on AAA-rated corporate bonds (used to adjust for changing interest rate conditions).
➡ How to Calculate
Let' sunderstand the calculations with the help of an example of NVDA stock:
EPS= 3.5 (TTM)
Growth rate= 32.8 (next 3-5years)
Y= 4.09
All other values remain the same
V= / 4.09
V= 279
So, the intrinsic value of the stock would be around 279
Current price= 186
Difference= 67%
Hence the Formula suggests that the current price is still way below its fair value and hence buyable.
➡ Are these Too Aggressive Valuations?
Yes, it may be too optimistic. The term '2g' gives very high weightage to growth, which can inflate valuations quickly. In a world where corporate earnings growth is less predictable and global interest rates fluctuate, this approach may overvalue companies that appear to have strong growth potential on paper.
➡ Relevance in the Current Market Scenario
While Graham’s formula is historically important and a great conceptual framework for understanding valuation, it should not be used as a standalone tool today. Markets are far more complex and influenced by globalization, technology, inflation, and interest rate cycles.
A more balanced approach is to use Graham’s principles (margin of safety, valuation discipline) but rely on modern valuation models like Discounted Cash Flow (DCF) or Relative Valuation Ratios and treat the formula as a learning foundation rather than a precise valuation tool.
What do you think about this tool for calculating a stock's valuation?
Is it still relevant?
Do 🚀 comment 💬
Disclaimer: I am not a valuation analysis expert so apply your due diligence while investing. The stock example taken in this educational post is just for demonstration purpose and not a buy/sell recommendation.
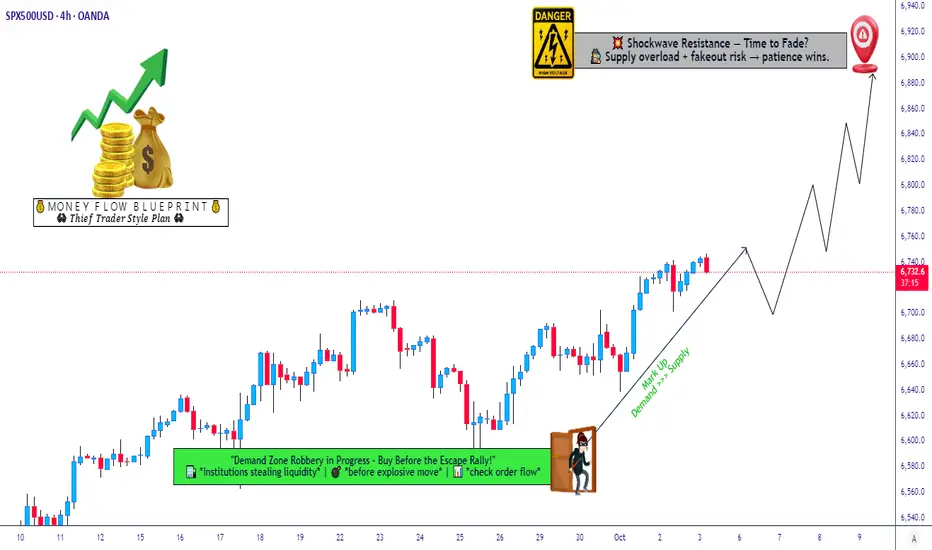
SPX 500 Swing/Day Trade Plan | Bullish Layers & Risk Guard✨ SPX 500 Index | Market Wealth Strategy Map (Swing/Day Trade) ✨
🚨 Plan: Bullish bias with Thief Strategy (layered limit entries).
🕹️ Style: Multiple buy-limit orders placed at different levels (“layering method” for smarter entries).
🎯 Entry Plan (Layered Thief Style)
🔑 Buy Limit Layers: 6660, 6680, 6700, 6720
➕ You can add more layers if market conditions allow.
🧠 Idea: Scaling in like a true Thief 🕶️ — stealing the best spots!
🛑 Stop Loss (SL)
Thief SL: @ 6640
⚠️ Note: Dear Ladies & Gentlemen (Thief OG’s), I’m not recommending you to use only my SL.
It’s your money → your choice → your risk management.
🎯 Target (TP)
Primary Target: @ 6900
🌀 Why? Shockwave resistance ⚡ + overbought zones 📈 + liquidity traps 🪤.
⛑️ Again, it’s your choice to set your own TP — escape with profits when you feel comfortable!
📊 Related Pairs & Correlations to Watch
CAPITALCOM:US500 / SP:SPX / CME_MINI:ES1! → Direct correlation to SPX 500.
NASDAQ:NDX / NASDAQ 100 → Often leads tech momentum, affects SPX swings.
TVC:DXY (US Dollar Index) → Strong dollar = pressure on indices. Weak dollar = fuel for bulls.
CAPITALCOM:US30 (Dow Jones) → Sometimes diverges from SPX, offering confluence signals.
TVC:VIX → Volatility Index — spikes = watch out for fakeouts / liquidity grabs.
💡 Key Takeaways
✅ Thief layering entry style = Scaling smarter, not harder.
✅ SL/TP = Flexible to your own trading psychology & risk appetite.
✅ Always respect risk management & don’t copy-paste blindly.
✅ Remember: markets love traps — be the thief, not the victim.
✨ “If you find value in my analysis, a 👍 and 🚀 boost is much appreciated — it helps me share more setups with the community!”
⚠️ Disclaimer: This is a Thief-style strategy shared just for fun & market learning purposes.
Not financial advice — trade at your own risk!
#SPX500 #US500 #SP500 #SPX #ThiefStrategy #DayTrading #SwingTrading #IndexTrading #MarketAnalysis #StockMarket
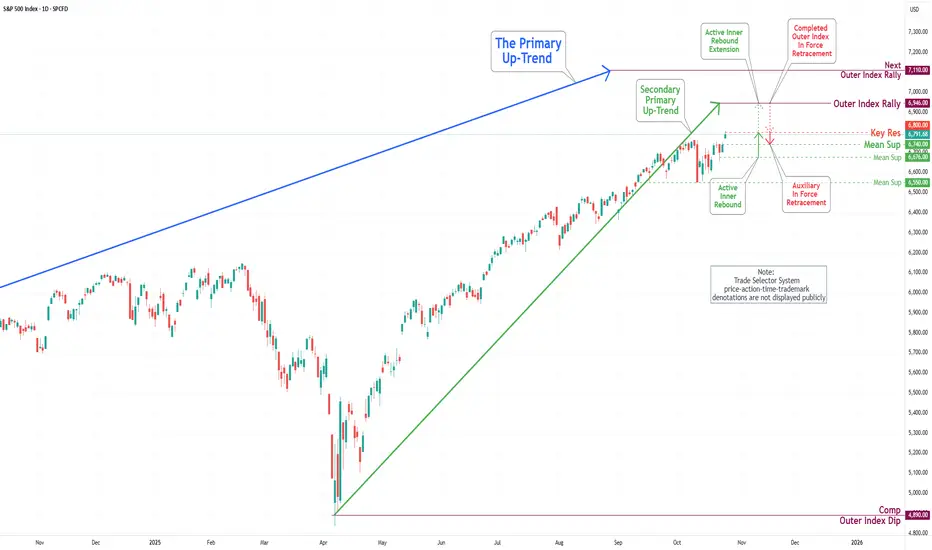
S&P 500 Daily Chart Analysis For Week of Oct 24, 2025Technical Analysis and Outlook:
The most recent trading session exhibited significant volatility in the S&P 500 Index, marked by pronounced price fluctuations between the Mean Resistance at 6671 and the Key Resistance at 6753. This range served as a crucial threshold for market participants, prompting a series of rapid buying and selling that influenced the index's overall wild movement. Ultimately, this price action culminated in a breakout above the completed Outer Index Rally at 6768.
At present, the index is situated at the newly established Key Resistance level of 6800, which lies just below the historical high of 6807. This positioning indicates the potential for further upward momentum, as the prevailing trend suggests a well-structured Active Inner Rebound extension toward the Next Outer Index Rally target of 7110.
Conversely, it is imperative to acknowledge the possibility of a sustained, steady-to-lower pullback from the Key Resistance level of 6800 to Mean Support 6740 for the Secondary Primary Up-Trend to continue on its path.
SPX into the new weekWe either pop 6800 on good news or retrace to test support.That looks to be the pattern we are trading uneless it breaks

S&P 500 (US500) MASSIVE TECHNICAL BREAKDOWN | ULTIMATE Trading 🚀 S&P; 500 (US500) MASSIVE TECHNICAL BREAKDOWN | Oct 27-31, 2025 | ULTIMATE Trading Strategy 📊
Current Price: 6,792.5 | Strategy: Intraday Swing Trading | Timeframes: 5M → 1D Analysis ⏰
━━━━━━━━━━━━━━━━━━━━━━━━━━━━━━━━━━━━━━━━━━━━━━━━━━━━━━━━━━
💪 DAILY (1D) ANALYSIS - Swing Trader's Powerhouse Setup
S&P; 500 on the daily timeframe is displaying STRONG BULL STRUCTURE near support zones offering clean entry opportunities this week! 🎯
━━━━━━━━━━━━━━━━━━━━━━━━━━━━━━━━━━━━━━━━━━━━━━━━━━━━━━━━━━
⚡ 4-HOUR (4H) SWING TRADE SETUP - PRIMARY ENTRY BLUEPRINT
The 4H timeframe is showing TEXTBOOK BREAKOUT FORMATION! When price closes above 6,840 with volume spike = AGGRESSIVE LONG ENTRY triggered! Ichimoku Cloud on 4H shows bullish cloud color with price above all components = strong continuation bias locked in! 📊
━━━━━━━━━━━━━━━━━━━━━━━━━━━━━━━━━━━━━━━━━━━━━━━━━━━━━━━━━━
🎯 1-HOUR (1H) INTRADAY EXECUTION ZONE - Strike Point Identified
Hourly chart displaying PERFECT CONSOLIDATION BREAKOUT PATTERN!

US500 Surges On Softer US CPI DataFundamental & Sentiment Analysis
The US500 surged this week after the release of cooler than expected US CPI data. This bolstered expectations for further rate cuts by the Fed at its 28–29 Oct meeting. Investor sentiment turned sharply bullish, pushing the index to new record highs near 6,792 on Friday.
The inflation report for September 2025 surprised markets to the downside: headline US CPI rose 0.3% (3.0% YoY) and core CPI rose 0.2% (3.0% YoY), both below forecasts.
This moderation fueled optimism that inflation is cooling sustainably, raising the odds of a 25 basis point rate cut at the upcoming FOMC meeting. Following the CPI release, the US500 rose to 6,762 intraday, just shy of its all-time high.
Technical Outlook
The outlook for the coming week is moderately bullish, with potential consolidation at record highs. Momentum remains supported by softer inflation, dovish Fed expectations, and continued strong corporate earnings.
However, technical analysts warn of short-term pullbacks as the index tests critical resistance levels. A correction toward 6,720 would be healthy before a move higher toward 7,000.
The US stock market is positioned for further gains into year-end if inflation stays contained and the Fed confirms a sustained policy easing trajectory.
Analysis is by Terence Hove, Senior Financial Markets Strategist at Exness

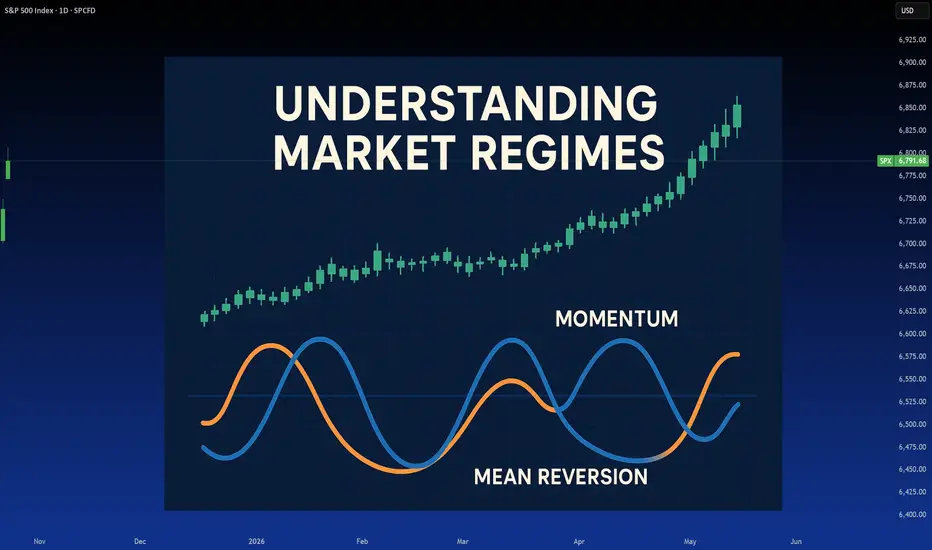
Market Regimes: What they are and why they matterRegimens, what are they and why they matter?
Most traders, especially new ones, don’t understand trading regimens. This is actually normal. Even as a quant based trader with higher education in stats/sciences, I learned of Regimen trading later in my trading career, having successfully navigated trading without it; but insurmountably improving things when I discovered it.
What is a regimen you may ask? Is it what’s going on in North Korea? Or even the USA?
Chances are, most people may think regime is synonymous with something like fascism or some ultra political significance, but the truth is regime can mean a few things, and I think its important, before getting into the real details, to first understand the meaning of regime.
The Meriam-Webster dictionary defines regime as:
regular pattern of occurrence or action (as of seasonal rainfall)
the characteristic behavior or orderly procedure of a natural phenomenon or process
mode of rule or management a government in power
a form of government
a government in power
a period of rule
If you were to do a grad school ‘ concept analysis’ on regime, you would get some interesting findings of regime. Essentially, all of these definitions have a significance/underlying overlap in meaning. The simplified meaning? I would say (without having done an actual concept analysis), a regime is a “pattern of behaviour / rules / government that forms repeating characteristics that can be measured and predicted against its previous characteristics”.
Still too complex? Let’s simplify with both political and scientific examples.
Political
In the current presidency in the U.S., the Republican party was swift to implement sweeping tariffs against international trade partners, blanketing entire continents in a matter of days with tariffs. These were then paused, resumed, paused, resumed, lowered, raised, lowered, raised, paused, resumed, revoked, resumed, lowered, raised, etc.
Under the current political regime, we can identify the behaviour of “tariff implementation”. From previous tariff implementation and revocation and adjustment, we have the characteristics of this regime. We can then use these characteristics to predict future outcomes under this regime, i.e. we would hypothesize “Tariffs will be paused within the coming 2 months”. We can say this because this is a characteristic of the current regime. In fact, the term TACO is a perfect example of repeating regime characteristics!
What about a scientific example?
Well we can draw on Meriam-Webster making reference to seasonal rainfall. In climatology, a " rainfall regime " refers to the characteristic pattern of precipitation over a region during the year—especially its timing, intensity, and variability across seasons. Identifying these regimes are pivotal to forecasting future meteorological and climatological events!
What about my field? Epidemiology and Biostatistics?
In Epi, we have multiple different regimes, such as:
Treatment Regime: A prescribed course of medical therapy, such as a drug regimen for tuberculosis or chemotherapy for cancer. It includes dosage, timing, and duration.
Vaccination Regime: A schedule of immunizations designed to prevent disease outbreaks—e.g., two-dose mRNA COVID-19 vaccine regime followed by boosters.
Control Regime: A set of public health policies or containment strategies—like quarantine protocols, mask mandates, or vector control in malaria-endemic areas.
Surveillance Regime: The systematic collection and analysis of health data to monitor disease trends—e.g., wastewater surveillance for poliovirus or syndromic surveillance for flu-like illness.
These all matter because these regimes dictate future characteristics/outcomes.
Great! Now that you have an idea of what a regime means, let’s talk about regimes in trading.
If you haven’t already guessed, there obviously exists “ market regime s”. These are, more or less, defined as “a distinct period characterized by specific patterns in market behavior—such as trends, volatility, and macroeconomic conditions—that influence investment strategies and risk management. ”
If you look back to our examples, you can begin to imagine why regimes matter. Remember, TACO! Previous behaviour dictates future characteristics. Once you understand the way or median in which some phenomena operates, you can use these characteristics to predict future characteristics.
If you wanted to dissect market regimes, it could get relatively involved and complex. For example, things such as:
Seasonality,
Momentum,
Mean Reversion,
Financial / economic stability
Geopolitical stability
These can all influence market regimes in their own way and can, in fact, be standalone market regimes. If you trade seasonality, you are trading “ seasonal regimes ”.
Momentum and Mean reversion are independent regimes of themselves (more on that shortly).
If you trade fundamentals, you will be trading economic and geopolitical regimes.
But which is correct? Not all regimes can exist at the same time, correct?
Yes and no! Regimes can momentarily shift and flip into a different one. Take, for example, the U.S. implementation of Tariff’s at the beginning of 2025. The initial blanket tariffs caused a mean reversion regime fueled by financial/economic and geopolitical stability. We had 3 regimes working together for the result, which was ultimately a mean reversion. This quickly shifted from a mean reversion regime to a momentum based regime (more on this shortly).
So, yes, we can, theoretically, have more than one regime simultaneously. However, when it comes to markets, and this is where you are in luck, its actually pretty easy! Markets tend to be either:
Mean reverting; or
Momentum based.
And that’s really that. Those are the only 2 regimes you will ever truly need to pay attention to, which will give you a better edge at trading. Seasonality, financial and geopolitical stability will either augment mean reversion or momentum, but generally are not independent regimes in and of themselves.
In the end, markets either go up, down or sideways. It can be driven by broader contexts, but in the end the up/down/sideways is driven by a predominate regimen;
Down markets: usually mean reverting.
Up markets: usually momentum.
Sideways markets: usually mean reverting with occasional momentum deviations.
If you want to learn more about the evolution of the market, you can check out my post about how the market has evolved into its current regime here:
Now, let the real fun begin and let’s talk about how to correctly trade based on the current regime!
There are some steps, first one must:
Identify the current regime concretely.
Apply the correct strategies that are compatible with the current regime.
Understand the momentum, mean reversion paradox
I will walk you through how to do this step by step.
Identifying the Current Regime Concretely
The easiest way to identify the current regime is by using Hurst Exponent.
The Hurst exponent is a number between 0 and 1 that tells you how predictable a time series is—like stock prices or rainfall.
If it's close to 0, the data is very random and tends to switch directions often.
If it's around 0.5, the data behaves like a random walk—no clear trend.
If it's close to 1, the data shows strong trends and tends to keep moving in the same direction.
So, it helps you measure persistence vs. randomness in patterns over time. The closer to 1 the more “persistent” the market is said to be. Persistence is basically the math equivalent of momentum. If a market is persistent, it will tend to trend with momentum.
The closer to 0 the more random the market is said to be . Randomness usually favours “mean reversion”
For simplicity, if you get a Hurst Exponent > 0.5, you are likely in a momentum regime. If < 0.5, you are likely in a mean reversion regime.
Let’s take a look at some examples using QuantNomad’s Hurt Exponent indicator ( available here ):
This is just before the crash in February 2025. We can see that up here, the Hurst Exponent was < 0.5, indicating a mean reversion preference. And indeed, the market ended up mean
reverting back to its quadratic mean (481) with the crash.
Then let’s see what happened:
After the crash, we can see that the Hurst Exponent was consistently > 0.5, indicating persistence in the market, i.e. trendy and momentum based.
Remember, as a rule of thumb, momentum markets generally faour upside and mean reverting tend to be downside favouring. If we narrow the regime to smaller timeframe regimes, you can see this phenomenon quite easily. Let’s look at SPY on a bearish day and bullish day against the Hurst Exponent:
We can see that on this bull trend day, Momentum and persistence reigned dominate. Hurst did not drop below 0.5, at least not for long, which indicated a persistent trend that was momentum driven.
Now a bearish day:
You can see on this bear trend day that Hurst stayed below 0.5 persistently, indicating mean reverting behaviour.
This also highlights how lower timeframes can have independent and day to day regimes, but its always important and critical to pay attention to the major regime a market is in on the larger timeframe.
Applying Correct Strategies
Depending on the regime, you MUST tailor your strategy to match the regime. If you are trading a mean reverting regime, oscillators like RSI and Stochastics aren’t going to work well. If you are trading a momentum regime with high persistence, mean reverting strategies like Bollinger Bands and Z-Score are not going to work.
As a rule of thumb, when Hurst is > 0.5, you want oscillator based strategies such as RSI, Stochastics, etc.
One indicator that I would recommend in momentum based regimes is my own, Momentum Probability Oscillator indicator ( available here ). This indicator operationalizes probability/sentiment through momentum metrics instead of mean reversion metrics. Let’s take a look at some examples:
In this example on the hourly timeframe for SPY, you can see that momentum is lost (signified by the oscillator falling below the yellow line) indicating that the likely outcome will be selling, this is shown by the pink arrows.
In this next example, we can see where momentum is reclaimed and the bias shifts to upside.
Because this indicator quantifies momentum probabilistically, it does well in momentum based, persistent regimes to identify strong trends and pullback of trends.
In reality, you can use any oscillator in a momentum based, persistent regime, but obviously I am biased to my own creations.
What about a mean reverting regimen?
If we are in a mean reverting regime, your best indicators to use are Bollinger Bands or, my favourite, the Z-Score probability indicator (by yours truly) available here .
Let’s use $NYSE:IRDM as our mean reverting example
In this image, the red arrow marks the transition to a mean reverting regime. So what do we use here? Well let’s take a look at the Z-Score probability indicator:
The red lines mark the transition to a mean reversion based regime. At the time of this transition, IRDM was oversold based on the Z-Score probability. We can see it in fact rallied back up to a z-score of 0 (mean reversion) before rejecting back down from the 0.
This is incredibly powerful, as the Hurst Exponent tells you that you can trust a reversion back to a mean!
Let’s try a smaller, intraday example, going back to SPY:
This day, SPY looked pretty bullish; however, the Hurst Exponent was consistently below 0.5 indicating mean reversion.
If we applied the Z-Score probability indicator:
I flipped the indicator to use Candles so you can more easily see the mean reversion behaviour. SPY goes to either extremes and always mean reverts back to 0, at times even consolidating in the mean reversion range.
And Bollinger bands:
If we look at a momentum driven day:
We can see that there is a skew or bias to one side of the average. The z-score is all over the map with no real expansion within the average range and infrequent and sporadic reversions that come more from extensive consolidation rather than actual mean reversion.
The indicator isn’t unusable in momentum based trading, but its not ideal. If we flip this same chart to the momentum probability oscillator we can see a stark difference in utility:
You can see the trend is using the full range of the oscillator and there is clear bounces at lower range and rejections at higher range with frequent “mean reversion” of the oscillator momentum based mean.
Now finally, the last section:
The Momentum Mean Reversion Paradox
This is, obviously, a self made up term. However, this is a phenomenon that will happen in corrective environments, where a mean reversion is so substantial, it becomes augmented by momentum itself.
What does this mean? It means that, despite the market actually mean reverting, the Hurst exponent flips to > 0.5, as the market is “persistently bearish”.
We can see this if we flip back to our $NYSE:IRDM example:
Here, we can see despite IRDM selling, the Hurst Exponent is incredibly trendy, with a really high value of > 0.55. Yet, despite this, the ticker continues down. This is the hallmark of a correction.
This is incredibly important and I really would advise you to mark this down and remember this. You can actually tell that something is “correcting” using this exact approach. When Hurst > 0.5 and the trend is down, this is the hallmark of a TRUE correction. No speculation needed!
Statistics is the best, I’m telling you.
Let’s look at the SPY crash of 2025:
During the SPY crash of 2025, the Hurst flipped to > 0.5, with a max of 0.57 indicating a hugely persistent trend. This means that this was a strong correction for SPY, flipping from a Hurst of < 0.5 to a Hurst of > 0.5 with a strong downtrend.
Crashes tend to happen abruptly without such transitions. For example, if we look at the COVID crash:
Theoretically Hurst warned us in advance that SPY was entering mean reversion territory, but when it actually happened, it happened so fast, Hurst never truly converted from mean reversion to trending. It was just a jumbled mess. This is the hallmark of a crash.
Concluding Remarks
And now, my friends, you know all there is to know about how to identify market regimes! Understanding these concepts will put your eons ahead of the average trader and allow you to select the correct tools and actually understand what the market is doing and when its gearing up for some corrections/mean reversions.
This is a long post, I will leave it there, but I really hope you learned something from this and will take some of the key points away!
Thanks for reading and as always, safe trades!
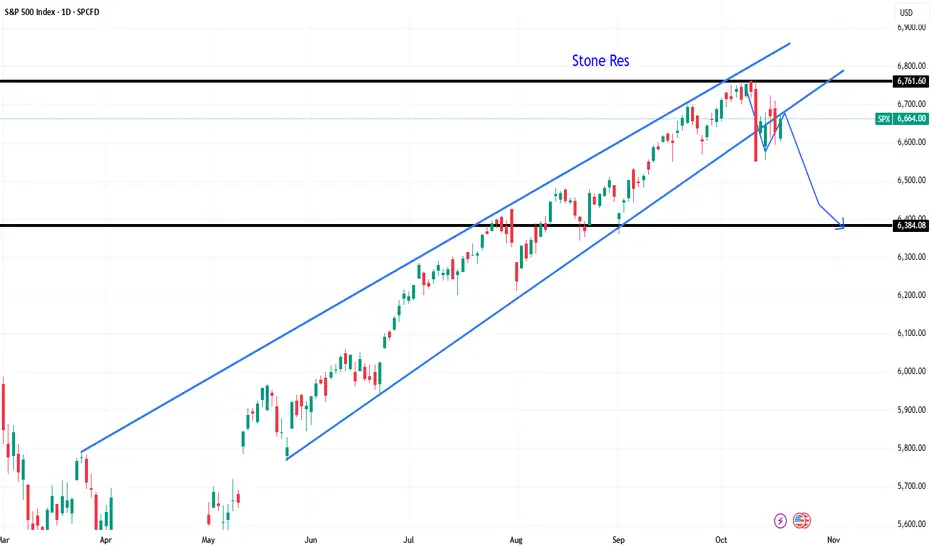
Crash still to come . eps 2As i said in last analyse . As long as 6760 hold which equal 720 Gann angle
we are going dn
first target was hit @ 6530
then ...
the price has rebound from 6530 which = 630 Gann angle
again , if 6760 hold we are going to 2nd target @ 6350 which = 540 angle
* If you like . give a push , for more charts
Good Luck
Markets look stretched, but the S&P 500 rally isn’t over yetLooking at historical trends, there still appears to be roughly 10% more room for the S&P 500 to climb before hitting resistance. Around the 7,300 level could be where the index pauses to catch its breath, or even consolidates before the next move, which will likely be downward.
Good luck!

S&P 500 — Short IdeaEntering short from current levels.
Stop-loss: if price closes above 6770 (4H candle body).
Take-profits: along the price movement — will adjust dynamically.
⚠️ Disclaimer:
This post is not financial advice and should not be interpreted as a trading recommendation.
I share my personal market view for educational and informational purposes only.
Everyone should make their own decisions, manage their own risks, and trade based on their own analysis.

SPX500 Bullish Breakout!
HI,Traders !
#SPX500 is going up now
And the price broke the
Key horizontal level
Around 6695.82 and
The breakout is confimred
So we are bullish biased
And we will be expecting
A further bullish move up !
Comment and subscribe to help us grow !

Failure to Reach 6813 Will Result In Bloodshed for SPXThis will get ugly very quick if buyers/investors can't reach 6813 quickly.
SPX500 Blueprint Confirms a Bullish Flow Reversal!🏃♂️💨 SPX500 Heist: The Bullish Getaway Plan! (Swing Trade Blueprint)
The market's pulling back, but the big money is still accumulating! We've spotted a bullish setup on the SPX500, and we're planning a strategic "thief-style" entry to catch the next leg up. This isn't a reckless smash-and-grab; it's a calculated heist. 🗿
📊 The Master Plan: Technical Blueprint
Direction: 🟢 BULLISH
Trend Confirmation: Strong bullish structure confirmed by the Triangular Moving Average (TMA).
Entry Signal: We're looking for a retest and bounce from the Simple Moving Average (SMA), suggesting the pullback is a healthy accumulation phase before the next move higher.
🎯 The Heist Strategy: Execution & Logistics
🚪 Entry Protocol: "Layered Limit Orders"
We're not chasing the price. We're setting traps! Using a layered limit order strategy to average into the trade at key levels.
Suggested Buy Zones (Layer Your Orders):
Layer 1: 6780
Layer 2: 6760
Layer 3: 6740
Layer 4: 6700
Feel free to adjust the number of layers and levels based on your own risk appetite.
🚨 Escape Route: Stop Loss
Every good thief has an exit plan if the heist goes south.
Stop Loss (The Getaway Car): A break below 6680 suggests the plan is invalid. This is our "abort mission" signal.
⚠️ Note to the Thief OG's: This is my planned SL. You are the master of your own capital. Manage your risk accordingly!
💰 Profit Target: Cashing the Loot
We're aiming for a major resistance zone where the "police" (sellers) are likely waiting.
Take Profit Target: 6900
Why here? This area acts as a strong technical resistance, potentially an overbought trap. Our goal is to escape with the profits before any reversal!
⚠️ Note to the Thief OG's: This is my target. You can take money off the table whenever you see fit. Partial profits are always a smart move!
🔍 Related Markets to Watch
AMEX:SPY (SPDR S&P 500 ETF): The direct ETF tracker. Moves in near-perfect correlation.
CME_MINI:ES1! (S&P 500 E-mini Futures): The futures market often leads the price action in the index.
/ES (Micro E-mini S&P 500 Futures): A smaller contract size with the same directional bias.
NASDAQ:NDX (Nasdaq 100 Index): Often moves in tandem with the SPX; a strong NDX can pull SPX higher.
TVC:DXY (US Dollar Index): A strong inverse correlation. A weaker Dollar is generally bullish for US equities.
✨ Key Takeaways
Strategy: Bullish Swing Trade on a pullback.
Method: Layered limit order entries for optimal average price.
Catalyst: TMA & SMA support holding as accumulation zones.
Goal: Capture the move towards 6900 resistance.
✨ “If you find value in my analysis, a 👍 and 🚀 boost is much appreciated — it helps me share more setups with the community!”
Hashtags: #SPX500 #TradingSetup #SwingTrading #US500 #TradingPlan #Bullish #MarketAnalysis #TechnicalAnalysis #TradingView #ThiefStrategy

Utilities vs S&P 500 — defensive spread for market extremesWhen markets reach phases of overvaluation and extreme concentration, we believe positioning in the Utilities vs S&P 500 spread (XLU/SPX) can make sense.
Looking back, in every correction of more than 20% in the S&P 500, the Utilities sector has outperformed — by margins ranging from +13% to +68%, depending on the severity of the selloff.
This spread acts as a defensive play, isolating sector risk and reducing exposure to market-wide drawdowns, while still participating in the broader market cycle.
Utilities tend to hold up better when:
Rates stabilize or decline.
Market breadth narrows to a few mega caps.
Risk-off sentiment starts to rise.
📈 We’re watching this spread closely at current levels.

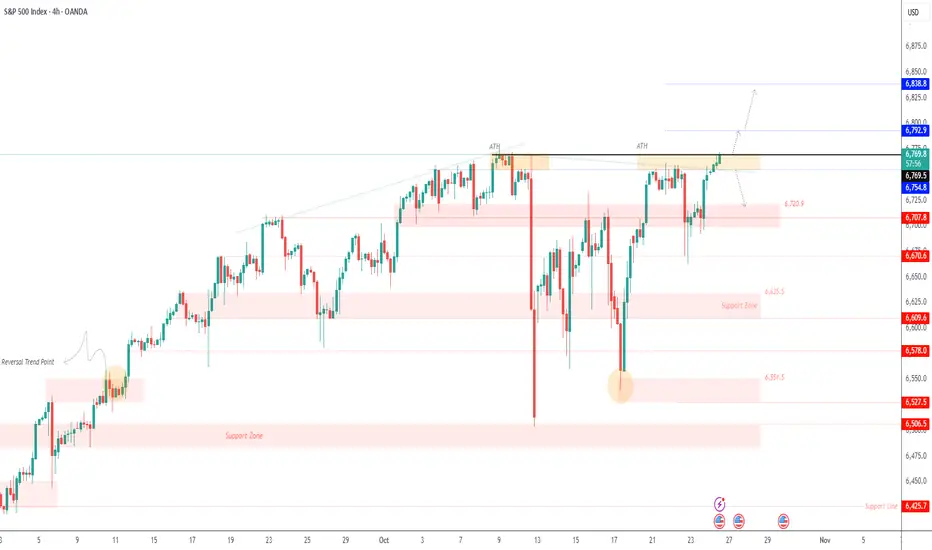
SPX500 | Futures Rise on Intel Boost Ahead of CPI DataSPX500 | Futures Rise on Intel Boost Ahead of CPI Data 📊
Wall Street futures edged higher on Friday, lifted by strong Intel earnings, as investors await a crucial U.S. inflation report (CPI) that could influence the likelihood of a December rate cut.
Technically, the SPX500 maintains a bullish structure, with potential to extend gains toward 6,792 → 6,838, especially if CPI data comes in below or in line with expectations.
However, if inflation prints higher than expected, the index could face bearish pressure toward 6,720 → 6,670.
Pivot Line: 6,770
Resistance: 6,792 – 6,838
Support: 6,720 – 6,670
5 Essentials of Trading Success
Trading is the greatest roller coaster you’ll ever ride.
Trading has its thrills, challenges, and endless potential for growth.
But, before you hit “Buy” or “Sell,” it’s crucial to lay down a solid foundation.
Too many traders jump in without preparation, and without knowing the real life variables.
When things go great, they feel normal and you feel in charge.
When things go bad, you feel it’s the end of the world.
So you need to learn to harness each of the 5 essentials to trading success.
Essential #1: Build a Solid Foundation of Knowledge
You wouldn’t drive a car without knowing the rules of the road, right?
Trading is no different.
Before placing your first trade, you’ll need to understand the key concepts and market basics that will serve as your roadmap.
Key areas to cover include:
Market types:
Know the difference between stocks, forex, commodities, and cryptocurrencies. Know which is the best stock screener. Also you need to know which markets will work for you and your trading personality.
Trading terminology:
Terms like “bearish,” “bullish,” “short-selling,” “leverage,” and “margin” might sound like jargon now, but they’ll soon become your everyday vocabulary.
Order types:
Limit orders, market orders, stop-loss, take-profit. Each of these orders serves a specific purpose. Mastering them is essential for making controlled and effective trades.
Essential #2: Select what you want to trade first: The Art of Asset Allocation
Trading is thrilling, but let’s face it.
No one knows what the market will do tomorrow.
That’s why choosing the right mix of assets—and learning the art of asset allocation—is crucial for long-term success.
What does asset allocation mean in practice?
Diversify your portfolio: Don’t put all your eggs in one basket. Invest and trade across different asset classes to spread out risk.
It’s better to trade different portfolios with stocks, Forex, indices and even commodities.
Successful trading isn’t about picking one “winning” asset.
It’s about managing risk and creating a balanced portfolio that can weather market storms.
Diversification is KEY!
Essential #3: Risk Management: Strategies to Protect Your Capital
If you only remember one thing from this article, let it be this:
Risk management is your best friend in trading.
Not only do you learn how to be a trader, but also a risk portfolio manager.
A smart trader doesn’t only think about potential gains—they think about how to protect their capital when things don’t go as planned.
Simple, powerful ways to manage risk include:
Set stop-loss orders: Automatically sell a position when it drops to a certain price to minimize losses.
Use position sizing: Avoid putting too much of your capital into a single trade. Limit each trade to a small percentage of your total funds—usually no more than 0.5%-2%.
Apply the “2% rule”: Never risk more than 2% of your capital on a single trade. This can help prevent one loss from wiping out your progress.
Remember, every trader has losses; it’s part of the game.
But with a solid risk management strategy, those losses won’t be catastrophic.
Essential #4: Charting the Path: Introduction to Technical Analysis
Charts are a trader’s treasure map. Learn to interpret them, and you’ll have insights into market trends, price movements, and potential buy/sell signals. Technical analysis allows traders to make data-driven decisions rather than relying on gut feelings.
Key tools for technical analysis:
Candlestick patterns: These can show trends, reversals, and market sentiment. Patterns like “doji,” “hammer,” and “engulfing” candles can offer powerful insights.
Indicators: Tools like moving averages, RSI (Relative Strength Index), and MACD (Moving Average Convergence Divergence) help you assess price momentum and potential reversal points.
As you might know by now. I like to stick to three indicators: Breakout patterns, 2 Moving Averages and Trend lines.
We need to learn to simplify our strategy because we will be following it over our entire trading career.
Trendlines: Drawn on charts, trendlines reveal price direction and potential breakout or breakdown levels.
Essential #5: The Psychology of Success: Developing a Trader’s Mindset
Trading isn’t just about strategies and technical skills; it’s also a mental game.
Emotions—fear, greed, EGO, frustration — can interfere with sound decision-making.
If you can’t manage your mind, you can’t manage your portfolio.
And that’s why it’s essential to develop a mechanical, professional and calm mind when trading.
Developing a disciplined mindset is what separates successful traders from those who burn out.
Conclusion
Let’s sum up the 5 ESSENTIALS to trading success.
Essential #1: Knowledge First: Understand trading terminology, market types, and order types.
Essential #2: Asset Allocation: Diversify your portfolio based on your risk profile.
Essential #3: Risk Management: Protect your capital with stop-losses, position sizing, and the 2% rule.
Essential #4: Technical Analysis: Learn chart patterns, indicators, and trendlines to guide decisions.
Essential #5: Trader’s Mindset: Control emotions, maintain discipline, and focus on long-term success.
Trading isn’t just a skill—it’s an adventure that rewards preparation, patience, and resilience.
Keep learning, stay focused, and remember: your success is built one trade at a time.
REVEALED: What REAL Trading isWhat is Financial Trading in a nutshell?
For the last 20 years I’ve summed up trading as just ONE BIG AUCTION.
It sounds like a fast-paced, high-risk, Wall Street movie scene with shouting brokers and skyrocketing graphs.
But, here’s the truth:
Trading is the most relaxing thing – when done right!
It’s a lifestyle, a process, and a mindset.
It’s one thing where YOU can take your finances on an exciting adventure — if you do it right.
Whether you’re a complete newbie or a seasoned trader, here is a refresher to dive into what trading really is.
Trading Is More Than Just an Auction of buying or selling…
Let’s clear up one thing first.
For the last 20 years I’ve summed up trading as just ONE BIG AUCTION.
And yes it is one big market of buying and selling – but that’s only part of it.
TRADING is all about solving a puzzle of analyzing probabilities, managing risks, and navigating uncertainty.
Every time you enter a trade (buy or sell), you’re making an educated guess on where the market is LIKELY to go next.
And you’re placing a bet on human behavior — how millions of people around the world (with their emotions, news reactions, and strategies) will affect the price of an asset.
That’s the technical side of trading. Here’s where I want you to integrate trading into your life…
Trading Is A Lifestyle
It’s not just about making money — it’s about integrating trading into your lifestyle.
You need to find the right markets, time, time frame, styles, strategy and approach.
Trading is like hitting the gym; it requires discipline, consistency, and a whole lot of sweat equity.
And just like you don’t get a six-pack or lose weight after ONE workout.
You shouldn’t expect to master trading overnight.
It’s a routine you build day by day.
A typical trading day might include:
Pre-market analysis (Weekly bias):
You need to check what’s happening in the world with other markets with both Asian, American, European and even London session.
You also need to look at the US Economic Calendar to see what news is arising for the week.
Analyse and Execute trades:
Once done the pre analysis, you need to do the actual analysis. See what trades are lining up according to your proven strategy. And if anything looks good to go EXECUTE.
Review and track your trades:
This is where you will reflect on what went right and what went wrong. This is where you’ll track and review your trades that lined up to add to your journal.
The key takeaway: Trading isn’t just what you do; it’s who you become.
Trading Is a Forever Game
When it comes to trading, think long-term.
Like, REALLY long-term. Because trading is a forever game.
Unlike sports with seasons or video games with levels, trading doesn’t end.
The markets will be there tomorrow, next week, and 100 years from now.
And as a trader, your mission is to stay in the game for the long haul.
That means managing your risk, protecting your capital, and always looking to improve your skills.
Trading Is A Business Where YOU Are The Boss
The beauty of trading?
You’re in control.
Trading is a business, and you are the CEO.
You call the shots, decide when to enter and exit trades, and ultimately, you take control of your financial destiny.
Like any business, trading requires:
Planning and strategy:
Risk and reward management:
Tracking performance and improving:
And, just like in any business, you’ll make mistakes.
But those mistakes are not failures; they’re lessons.
You learn from them, adapt, and get better. That’s what makes trading such an empowering journey.
Final Words:
Financial trading is more than a job, a hobby, or a side hustle.
It’s a process-driven approach to decision-making, a lifestyle to live, a forever game to play, and a business where you’re in charge.
If done right, trading can be one of the most rewarding pursuits you’ll ever undertake.
Key Takeaways
Trading is a process: Follow a set strategy, criteria, and rules for success.
Trading is a lifestyle: Incorporate trading into your daily routine and stick with it consistently.
Trading is a forever game: It’s not a one-time event; it’s a lifelong pursuit.
Trading is a business: You’re the CEO — plan your moves, manage your risk, and take charge of your financial destiny.
