How to turn $100 into $1,000,000 through trading?
The answer — You can’t..
Yes, theoretically you can imagine a chain of unbelievable coincidences, aggressive risk-taking, and pure luck. But in reality, that path almost always ends with a blown account long before any meaningful growth happens.
However, most people who enter this field genuinely believe they’ll be the exception. They’re convinced it will work out for them. Social media plays a big role in this — the way trading is presented: a glamorous lifestyle, freedom, expensive cars, travel, and supposedly all you have to do is press “buy” or “sell.”
✨ It creates the illusion of simplicity.
But the market isn’t a button. It’s competition.
Chasing massive returns, people start trading low-liquidity, questionable assets. They increase leverage, go all-in on their account, ignore stop losses. Risk management turns into a myth told by some crazy guy on the street, and their mental state starts resembling that same person preaching about discipline. Every trade becomes a casino bet.
🎢 First comes excitement.
😎 Then euphoria from a random win.
😤 Then aggression after a loss.
🎰 And finally — the urge to “win it back.”
And that’s exactly when the account starts melting the fastest.
💡 The truth is, a successful trader isn’t someone who makes 100x in a month.
A successful trader is someone who earns consistently.
Generating 10–14% per month with proper risk management is an extremely strong result. Most professional fund managers don’t even come close to delivering that consistently over time.
💰 With a $300,000 account — that’s a solid income you can live on.
🍦 With $100 — that’s ice cream money. And that’s okay.
📌 Now the important part.
If you want to start trading and you have $300 — great. Set it aside. But treat it not as a “life-changing opportunity,” but as tuition.
A small account should not be a gambling tool.
It should be a discipline-building tool.
It should be a system-testing tool.
It should be a habit-forming tool.
With a deposit like that, you learn to:
• respect risk per trade;
• accept losses calmly;
• avoid increasing size after a loss;
• stay out of the market when bored;
• follow rules even when emotions scream otherwise.
📈 If you can’t trade $300 consistently and with discipline, you won’t trade $30,000 successfully either. Not only profits scale — mistakes scale too.
❗ And if you quit your job with a $300 account to “fully dedicate yourself to trading,” you should probably go back.
Trading doesn’t like pressure.
When you need to pay rent, cover loans, and buy food, you start making decisions out of fear instead of following your system.
⚖️ And fear and the market are a bad combination.
First — stable income outside the market.
Then — stability on a small account.
Then — capital growth.
Enjoy!
S&P 500 Index - Standard & Poors 500 (SPX)
No trades
What traders are saying

S&P 500: Late-Cycle Signals Are BuildingThe S&P 500 is still holding near highs, but under the surface, things are starting to weaken. Both the chart and the economy are sending warning signs that are easy to miss if you only look at price.
Weekly Bearish Divergence
On the weekly chart, price made higher highs, but momentum did not . This is called a bearish divergence and it often shows up near the end of long uptrends.
It doesn’t mean the market crashes immediately but it usually means upside is running out of fuel.
A Fractal From the 2021 Bear Market
The projected move on the chart is based on what happened in 2021–2022:
- momentum faded
- price stayed high for a while
- then the market broke down and turned volatile
The current structure looks similar not identical, but familiar enough to be cautious.
The Economy Is Slowing
While prices are high, the economy is cooling:
- Layoffs in January 2026 were the highest since 2009
- There are now fewer job openings than unemployed people
- Wage growth is slowing
- Home sellers heavily outnumber buyers
- Consumer spending is weakening
These are classic late-cycle signals.
Bonds, Rates, and Pressure
Big foreign holders are selling U.S. bonds, pushing yields even higher. This creates pressure on stocks.
What This Means
When you combine:
- fading momentum on the chart
- a setup similar to past bear markets
- weaker jobs and spending
- stress in housing and bonds
You get a market that looks strong on the surface, but is losing strength underneath.
Conclusion
This doesn’t mean a crash tomorrow. But it does suggest that the S&P 500 may be entering a bear-market phase, not just a normal pullback.
Markets usually warn before they turn and right now, those warnings are getting louder.

Hellena | SPX500 (4H): LONG to 7048 area (MAX of wave "1").Colleagues, the price continues to move in an upward five-wave impulse.
At the moment, I am considering a movement in wave “3” of medium order to the area of 7048 (the main thing here is the update of the maximum of wave “1”).
In principle, everything is quite simple in terms of wave construction, and there is nothing more to add—the old scenario continues.
Manage your capital correctly and competently! Only enter trades based on reliable patterns!

US500: Eyes on 7,050 & 7,100 TargetsUS500: Eyes on 7,050 & 7,100 Targets
US500 is consolidating just beneath a well-defined intraday resistance zone around 6,990–7,000 after a strong impulsive move off the recent swing low.
Price has built a classic flag pattern that often precedes expansion.
A movement above the 6990 area would signal the start of the bullish movement.
Key Targets:
🎯 7,050
🎯 7,100
As long as price holds above the 6,940–6,950 support block on pullbacks, bullish structure remains intact.
You may find more details in the chart.
Thank you and good luck! 🍀
❤️ If this analysis helps your trading day, please support it with a like or comment ❤️

SPX - Covid style decline to repeat?It might be crazy idea, but SPX could experience another Covid 2020 style decline starting next week.
In late December I posted idea of a 35%+ decline in the market in 1H of 2026 (linked below), highlighting rotation away from growth/risk to value/safe assets. I anticipated few more weeks of chop before top is formed. Since then said rotation only intensified. SPX is flat. Yet, VIX is up a lot! New Fed chair, Kevin W., had been nominated. He seems to be of an opinion that FEDs job isn’t to prevent market collapses, instead react to them by providing liquidity. With all that being said I think as of 1/28 SPX top is in. Maybe market participants will try front running Kevin’s willingness to crash markets.
USA’s attract on Iran this weekend would be a trigger / headline to start this decline. With Monday being a holiday, Tuesday would be very dramatic for markets.

S&P 500: Retest Done — Next Push to New ATH?The S&P 500 index ( SP:SPX ) completed its downward movement as I expected in the previous idea (full target) .
Currently, the S&P 500 index has managed to break the resistance zone($6,956-$6,918) and is completing a pullback to this zone.
In terms of Elliott wave theory, it seems that the S&P 500 index has managed to complete the main wave 4 and is currently completing the main wave 5.
I expect the S&P 500 index to succeed in forming a new All-Time High(ATH) after breaking the resistance lines.
First Target: $7,031
Second Target: Resistance lines
Stop Loss(SL): $6,896
Points may shift as the market evolves
Note: This week, important indexes will be released from the US, which could have a significant impact on the S&P 500 index trend.
💡 Please respect each other's opinions and express agreement or disagreement politely.
📌 S&P 500 Index Analyze (SPX500USD), 4-hour time frame.
🛑 Always set a Stop Loss(SL) for every position you open.
✅ This is just my idea; I’d love to see your thoughts too!
🔥 If you find it helpful, please BOOST this post and share it with your friends.

S&P500 is it about to crash due to a Global Liquidity peak??S&P500 (SPX) has been rising non-stop within its 3-year Bull Cycle following the October 2022 market bottom of the 2022 Inflation Crisis Bear Cycle. Such Bear Cycles are systemic and take place periodically on the long-term scale. Since the 2009 bottom of the U.S. Housing Crisis, those Bear Cycles have bottomed at or very close to the 1W MA200 (orange trend-line).
The index hasn't made contact with its 1W MA200 since that October 2022 bottom. Even the Tariff War correction exactly one year ago didn't touch it. This is a sign that the overheated/ bought stocks may be reaching their peak.
What may have reached its peak (or is entering its peak zone) is the M2 Global Liquidity Index (black trend-line), the global money supply circulating the financial system. As you can see based on the Sine Waves tool, the Global Liquidity tends to peak around every 4 years roughly. The next Sine Wave absolute peak is on the week of February 23 2026 (2 weeks from now).
In the past 12 years, the Global Liquidity has peaked both a little earlier or later, so that's a Peak Zone we have entered. What this technically suggest for the stock market is that the S&P500 has very high chances of entering a Bear Cycle that should bottom at or very close to its 1W MA200. And based on the latter's trajectory, that could be around 5500.
Are you willing to hold your stocks based on that?
---
** Please LIKE 👍, FOLLOW ✅, SHARE 🙌 and COMMENT ✍ if you enjoy this idea! Also share your ideas and charts in the comments section below! This is best way to keep it relevant, support us, keep the content here free and allow the idea to reach as many people as possible. **
---
💸💸💸💸💸💸
👇 👇 👇 👇 👇 👇

SP500 Consolidation a bullish mid rangeSP500 Price is trading within a rising and maintaining a broader bullish structure despite recent volatility the market found strong demand near the lower boundary of the channel, followed by an impulsive bullish recovery signalling buyers stepping back in with strength.
Currently, price is consolidating above the mid-channel support zone, forming higher lows and suggesting a potential continuation to the upside. The highlighted grey zone represents a key demand / accumulation area, where price previously reacted and built momentum.
Key Level Zone;
Resistance Level ; 7,001 / 7,040
Support Levels ; 6,940 / 6,910
A clean break and acceptance above the mid-range could open the door for a measured move toward the upper channel, while failure to hold current support may trigger a pullback toward the lower range support before continuation.
You may find more details in the chart,
Trade wisely best of luck buddies.
Ps; Support with like and comments for better analysis Thanks for Supporting.

S&P 500In my view, the price is forming a bullish head‑and‑shoulders pattern. From here, it may see a slight correction to complete the second wave and form the right shoulder. After that, a breakout of the pattern could push the price above 7000.

Let's play with Fibonacci Price Theory & EPP PatternsThis video is an update for the SPX500 and Bitcoin - showing you how price structure tells you everything you need to know about the markets and which direction you need to stay focused on.
For me, trading is about learning to identify where the next big move is going to be and how I can position my trades to benefit from that move. It is not about chasing 20-50 minute trends. I'm going for the bigger price swings and I want to safely deploy my capital to profit from those moves.
I teach these techniques to help traders understand PRICE is all you need to focus on. Sure, other indicators are interesting and useful to help you understand where and how price may move in the future. But I believe PRICE tells us everything we need to know.
Watch this video. Ask questions if you have any.
Learning to use PRICE as an indicator is critically important.
GET SOME!

The updated sp 500 Be ready first stop 6520The chat posted are My view of the EW structure and its formation and to where I see us in a very short time > I am 75 % long Very deep in the money PUTS I can allow a print of 7005 to 7031 But I having doubts as We are in the cycle peak . Best of trades WAVETIMER

SPX500 | Futures Slip Ahead of Jobs & Inflation DataSPX500 | Futures Slip as AI Uncertainty Persists
Wall Street futures edged lower as concerns about AI-driven competition and margin pressure continued to weigh on sentiment. Investors now shift focus to upcoming jobs and inflation data, which could drive the next major move in equities.
Technical Outlook
The index needs to stabilize above 6918 to maintain bullish momentum.
A sustained move above this level would support further gains toward 6946 and 6988, with extended upside toward 7020.
A 1H candle close below 6900 would shift momentum bearish toward 6858, followed by 6800.
Key Levels
• Pivot: 6918
• Support: 6900 – 6858 – 6800
• Resistance: 6946 – 6988 – 7020

070425 Index baselinesimple baseline chart of major indexes and ETFs dating back to previous 52wk lows on 8 April 2025. With exception of IGV which came a day later.
To be used as a metric/tool for use in exploring future divergence.

S&P 500: Wave 5 Aims At $7,580 As Minimum Target After completion of consolidation in wave 4
The last wave 5 is expected to unfold
The minimum target of $7,580 is set at the 38.2% of waves 1-3 distance
Bullish trigger is located at the previous all-time high of $7,002

S&P500 Triple Zigzag: Bullish to 7,260-7,500
Current Main Scenario
⇒ Triple Zigzag from April low last year
※ Double Zigzag alternative still remains,
but this is the primary count now
⇒ Currently in (c) of Z wave
in Triple Zigzag W-X-Y-X-Z structure
⇒ Targets around 7,260 or 7,500
Expect ~20% decline after reaching target
⇒ Bias & Position Bullish
※ Upside confidence on touch/break of 7,006.68
⇒ Invalidation Point: 6,735.08
#SPX #SP500 #ElliottWave

Bullish until it isn'tStructural trendline had a false breakdown and recovery, so it's bullish until it isn't. VIX also showing some bear divergences on smaller time frames.

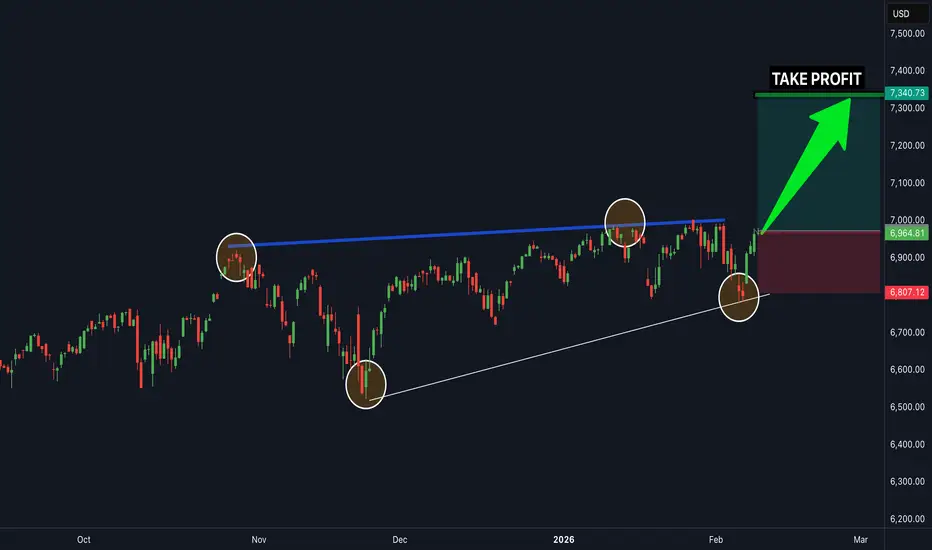
SPX.. Time to buy nowSPX 500 is in a clear upwards channel and has broken the last bit of resistance (white trendline line shown) - this is a clear confirmation that the next target will be the next resistance zone to the upside shown above (this is a great buy trade opportunity) - time to buy SPX 500 now...
Wave B Completion at 0.786 Fib? Potential Flat Correction SetupTechnical Analysis:
Structure: Following the initial impulse (Wave A), the market executed a deep correction. By piercing the 0.618 level and rejecting the 0.786, the structure has likely shifted from a simple Zigzag to a Flat Correction.
Reaction: The 0.786 level acted as a strong resistance zone (Deep Crab / Butterfly limit), rejecting the bullish attempt.
Forecast: If this level holds, I anticipate the start of impulsive Wave C to the downside.
Trade Plan:
Confirmation: Waiting for a lower low or a break of local market structure on lower timeframes.
Target: Testing the Wave A low or lower.
Invalidation: A clean break above the swing high (1.0).
Is this the top of Wave B or just a Friday pause? Let me know your thoughts!

SPX500 market review Colleagues, hello everyone. 👋
As expected, price traded within the range we discussed last week:
The only exception was Thursday, when price swept the liquidity from the week before last (marked on the chart as a liquidity sweep). However, after reacting to the weekly imbalance (Tested FVG), it returned back into the range.
Range Expansion 🔍
For us, this means the trading range has expanded:
Weekly Context 📊
The weekly candle formed a large wick. To me, this represents inefficient pricing, which suggests that in the coming trading days we may see a move toward:
• the first quartile (6,880)
• the equilibrium level (6,832)
• potentially the third quartile (6,783)
Daily Context 📊
Friday’s daily candle formed a confirmed order block (after the liquidity sweep), which confirms buyer strength following the test of the Tested FVG.
At the same time, this order block does not rule out a move toward the equilibrium of the order block itself (6,837), which aligns with the equilibrium of the weekly wick. This is a strong level where a reaction is likely.
Market Bias ⚖️
For me, this is a bullish context that does not exclude a pullback. I’m considering two possible scenarios and focusing on local targets, as the broader picture remains uncertain — essentially range-bound price action within a problematic zone above and below.
Scenario 1 🟢
In this case, I will evaluate the reaction at equilibrium through order flow on the mid-term timeframes (1H–4H).
Scenario 2 🟢

US500The US500 is bouncing off the upper trend line of the descending channel after crossing the upper Bollinger Band. The CCI has already left the overbought zone, and there is an imbalance at the bottom.

S&P500 Crash Incoming: Peak confirmedOver in this video, I updated the wave counts for SPX and warns of a crash incoming. I also talk about where to place the stop loss and also the price targets.
Good luck!


SPX I think we can float a little longSPX , I understand all the February Sell-off and I think it will continue ... that said their are bounces to be made and some important stocks still have more gas in the tank (namely a wave 4-5 on chips and memory manufacturing, and military , and b-wave on rare earth...but the mix will eventually align in due course and and a genuine major correction will go forward I am thinking around May (unless it already started) . with a B-wave bounce heading into the election and then a further C-wave after. ( probably doesn't matter who wins)
