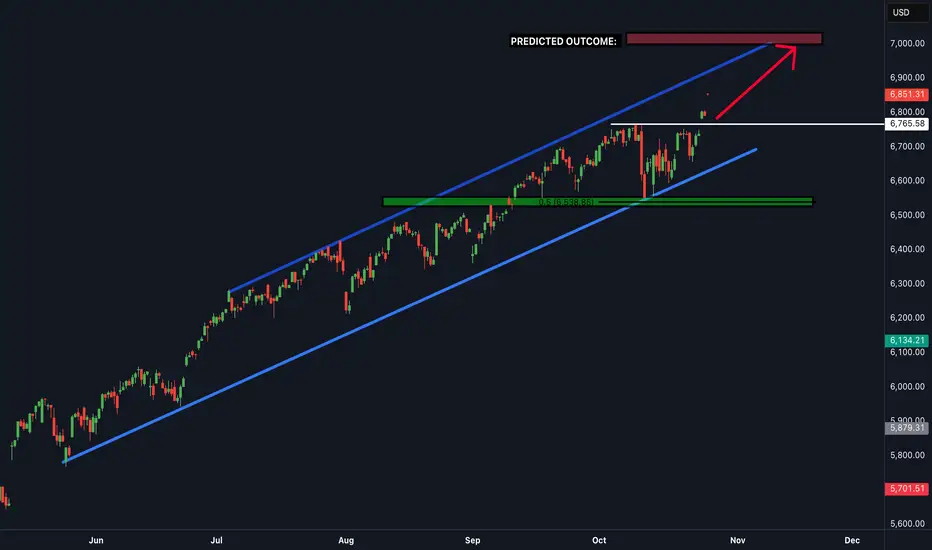
SPX500 Eyes 7000 — Breakout or Bull Trap Ahead?🦸♂️ SPX 500 Heist: The 7K Bull Run Playbook (Swing Trade Setup) ✅
Alright, crew, listen up! The market is a vault, and we're here to make a strategic withdrawal. The SPX 500 is showing us the blueprints for a potential bullish breakout. This is our plan to ride the wave.
🎯 The Master Plan: BULLISH
We're looking for a classic breakout play. The gates are at 6780, and once they're open, we're going in.
⚡ Entry Signal (The "Go" Signal)
Action: Consider long positions ONLY AFTER a confirmed daily breakout and close above the key level of 🎯 6780.00.
Translation: Don't jump the gun. Wait for the market to show its hand.
🚨 Stop Loss (The "Escape Route")
Location: My suggested escape hatch is down at 🛡️ 6600.00. Place it after the breakout we talked about.
A Note from the OG: "Dear Ladies & Gentleman (Thief OG's), I am not recommending you set only my SL. It's your own choice. You can make money, then take money at your own risk." 😉
💰 Profit Target (The "Loot Bag")
Destination: We're aiming for the major resistance zone at 🎯 7000.00. This is a psychological magnet and a previous area where sellers stepped in.
Why Here? It's a zone of strong resistance, potential overbought conditions, and traps for the greedy. Be smart and escape with your profits!
Another OG Note: "Dear Ladies & Gentleman (Thief OG's), I am not recommending you set only my TP. It's your own choice. You can make money, then take money at your own risk." 😎
🔍 Market Intel: Pairs to Watch
A master thief always checks the surrounding area. Keep an eye on these correlated assets:
AMEX:SPY (SPDR S&P 500 ETF): The direct tracker. Moves almost tick-for-tick with the SPX.
NASDAQ:NDX (Nasdaq 100): Tech-heavy cousin. If NDX is strong, it often pulls SPX up with it.
TVC:DXY (U.S. Dollar Index): Our usual antagonist. A stronger dollar can be a headwind for large-cap stocks.
CME_MINI:ES1! (S&P 500 E-mini Futures): The real-time action. This is where the big moves often happen first.
✨ Community Boost
If you find value in my analysis, a 👍 and 🚀 boost is much appreciated — it helps me share more setups with the community!
#SPX500 #SP500 #SwingTrading #MarketPlaybook #PriceAction #ThiefTrader #IndexAnalysis #TechnicalAnalysis #TradingStrategy #US500 #Equities #BreakoutStrategy #TradingView #StockMarket #RiskManagement
Trade ideas

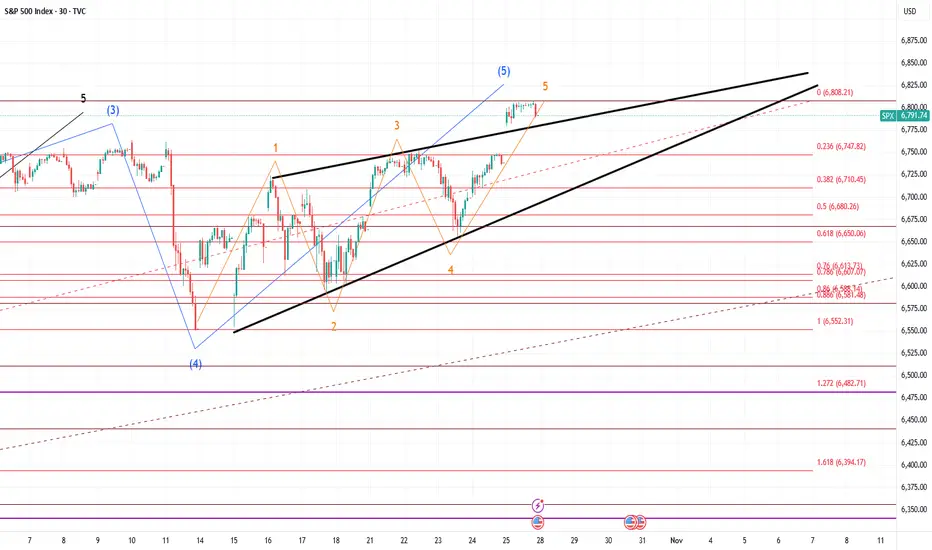
S&P 500 Analysis – 26 October 2025
- S&P 500 broke resistance level 6800.00
- Likely to rise to resistance level 7000.00
S&P 500 index opened today with the upward gap which broke the key resistance level 6800.00 (which stopped the previous impulse wave (3) at the start of October, as can be seen from the daily S&P 500 index chart below).
The breakout of the resistance level 6800.00 accelerated the active minor impulse wave 3 of the medium-term impulse sequence (5) from the start of this month.
Having just broken out of the daily up channel from August, S&P 500 index can be expected to rise to the next round resistance level 7000.00, target price for the completion of the active impulse wave 3.

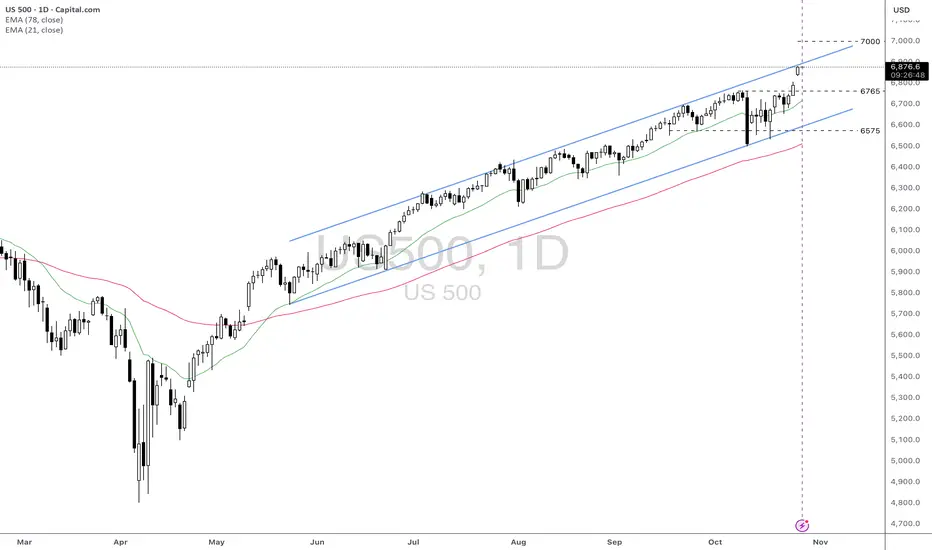
US500: Strong Upward Momentum Approaching 7000 LevelFundamental approach:
- The US500 advanced this week, propelled by strong earnings momentum from tech giants and robust performance in select sectors. Among top movers, Qualcomm rose over 11% following upbeat earnings guidance, while Alphabet and Tesla also rallied ahead of their highly anticipated quarterly results. W.R. Berkley Corporation and Welltower Inc. were notable gainers, reflecting sector rotation and risk-on flows in the index.
- Earnings from the 'Magnificent Seven', including Microsoft, Alphabet, and Meta, drove sentiment, with over 86% of S&P 500 companies reporting results above consensus expectations so far this quarter. Tesla's performance was mixed, while Amazon is set to announce slightly lower profits, but the broader group is still outpacing the rest of the market in earnings growth.
- Tech earnings and the upcoming FOMC decision are key catalysts that may influence future US500 moves. Broad sector participation and ongoing AI investment could sustain upward momentum if macroeconomic conditions remain supportive.
Technical approach:
- US500 created a new all-time high this week after breaching the key level at around 6765. The index showed an urgency in moving upward, creating a gap that remains unfilled. US500 is well above the diverging EMAs, indicating a strong upward momentum. However, the index is approaching the upper bound of the ascending channel, which may limit the price movement.
- If the current gap remains unfilled, the US500 may continue to move upward and test the psychological resistance at 7000.
- On the contrary, rejecting the channel's upper bound may prompt a correction and fill the gap around 6790, retesting the broken level at 6765.
Analysis by: Dat Tong, Senior Financial Markets Strategist at Exness
This is the END(ing diagonal)The ending diagonal has formed. If you check RSI you will see a double daily and fresh WEEKLY divergence. It will crash hard next week. 6480 is the first target, but it can be just a bounce area. 1.618 level from low to top of the diagonal is at 6400 level on SPX and at 6300 level on US500 - I think we can get a flash-crash into this area next week. And if this is a reversal, it can trend down to February peak and lower according to fibs.
Fib's extensionIf so, then this thing won't stop until it reaches the purple level. That's where the correction could really begin. I'm not ready to say when yet, because the angle of attack could be either gradual or exponential, depending on the economy and the political situation.

S&P 500 Consolidation Turning Bullish StructureThe S&P 500 remains in a consolidation phase, leaning toward a bullish trend as it aims for new record highs once again.
Global stocks jumped on Monday to fresh intraday records, while the U.S. dollar eased on optimism that a potential trade deal between China and the U.S. may be approaching. Investors are also awaiting a series of central bank policy meetings and key earnings reports from several mega-cap companies.
From a technical perspective, prices continue to react strongly to the upside. If this upward momentum persists, the next resistance level is seen around 6,950.10.
You may find more details in the chart.
Trade wisely best of Luck buddies,
Ps; Support with like and comments for better analysis Thanks for Supporting.

Failure to Reach 6813 Will Result In Bloodshed for SPXThis will get ugly very quick if buyers/investors can't reach 6813 quickly.
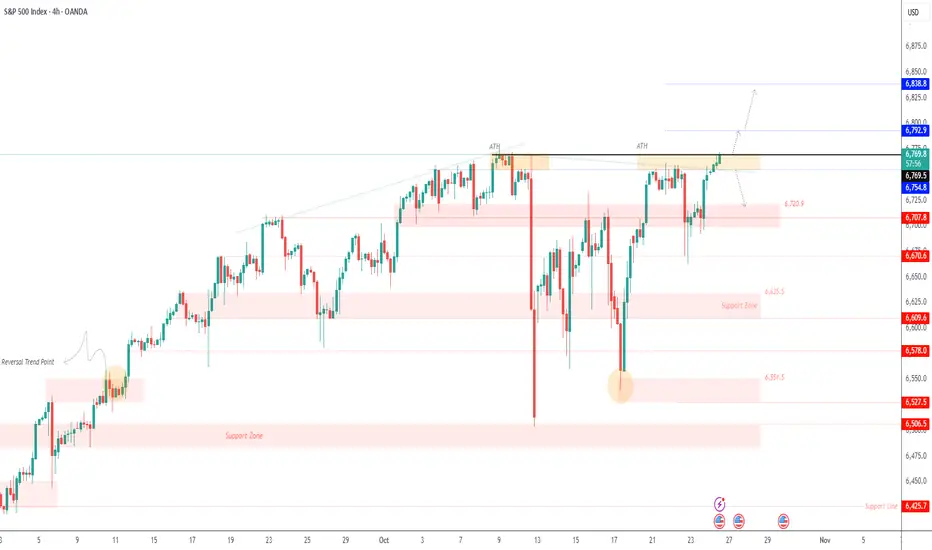
SPX500 | Futures Rise on Intel Boost Ahead of CPI DataSPX500 | Futures Rise on Intel Boost Ahead of CPI Data 📊
Wall Street futures edged higher on Friday, lifted by strong Intel earnings, as investors await a crucial U.S. inflation report (CPI) that could influence the likelihood of a December rate cut.
Technically, the SPX500 maintains a bullish structure, with potential to extend gains toward 6,792 → 6,838, especially if CPI data comes in below or in line with expectations.
However, if inflation prints higher than expected, the index could face bearish pressure toward 6,720 → 6,670.
Pivot Line: 6,770
Resistance: 6,792 – 6,838
Support: 6,720 – 6,670
SPX500 On the way to the upside! BUY NOWSPX500 is in a clear upwards channel and has broken the last bit of resistance (white line shown) - this is a clear confirmation that the next target will be the next resistance zone to the upside shown above (this is a great buy trade opportunity)
Weekend Analysis: DXY, BTC, Gold, Silver, Nas100 and SPX500In this video presentation I am expecting the dollar index to continue its uptrend on the lower time frame towards the liquidation level target of 99.500.
Bitcoin is still in a distribution range and currently correcting the sharp sell off from $126,296. I am observing an A-B-C corrective pattern potentially to targets of either $115,044 or $117,653. These are confluence of resistance level and will be expecting a sell off from these levels. If these levels gets invalidated then potentially the all time highs of $126k is in view. However that's not my expectation so a breach of the target level will invalidate the bearish analysis on Bitcoin.
I think Gold and Silver have peaked out for now and smart money is off loading to FOMO retail traders. I am expect Silver to sell off much faster than Gold.
Nas100 and SPX500 clinched to a breakout of new highs but the buying volume is fading out and seems to be a fake out. I will be watching if the breakout levels gets support or breakdown on pullback to decide a long position or short position.
This is my opinion on the market this week and I thank you for your time to visit my publications.
Have a great trading week and don't forget risk and money management is your first job as trader or investor. Cheers!!

S&P500 - best three-day gain since MayThe S&P 500 heads into today’s session on firm footing after posting its best three-day gain since May (+2.62%), buoyed by optimism around a potential Trump–Xi trade breakthrough and upbeat momentum across tech and semiconductor stocks.
Investor focus is turning to a pivotal week packed with catalysts: four major central bank meetings, a wave of big-tech earnings (starting tomorrow with Microsoft, Meta, and Alphabet), and the anticipated Trump–Xi meeting on Thursday. Market sentiment was bolstered by Trump’s comments suggesting progress toward a deal and even a possible resolution on TikTok, reviving hopes of easing US–China tensions.
The S&P 500 (+1.23%) and Nasdaq Composite (+1.86%) both hit new highs yesterday, driven by strong performance in trade-sensitive and AI-linked names. The Philadelphia Semiconductor Index (+2.74%) led gains, helped by Qualcomm’s +11% surge on new chip news and reports of a $1bn AI partnership between the US Department of Energy and AMD. Nvidia and other mega-cap tech stocks also rallied, pushing the Mag-7 index up +2.6%, its best single-day gain in five months.
On the rates side, the front end of the Treasury curve sold off (2yr +1.0bps) amid risk-on sentiment, while longer maturities rallied (10yr -2.2bps, 30yr -4.1bps), suggesting markets still expect monetary easing ahead. US equity futures are flat this morning, indicating a pause as traders await consumer confidence data and more corporate earnings before the next leg higher.
Bottom line:
Momentum in the S&P 500 remains positive, supported by AI and trade optimism, but with major catalysts still ahead this week, near-term direction will likely hinge on upcoming tech earnings and central bank guidance.
Key Support and Resistance Levels
Resistance Level 1: 6904
Resistance Level 2: 6924
Resistance Level 3: 6950
Support Level 1: 6832
Support Level 2: 6806
Support Level 3: 6784
This communication is for informational purposes only and should not be viewed as any form of recommendation as to a particular course of action or as investment advice. It is not intended as an offer or solicitation for the purchase or sale of any financial instrument or as an official confirmation of any transaction. Opinions, estimates and assumptions expressed herein are made as of the date of this communication and are subject to change without notice. This communication has been prepared based upon information, including market prices, data and other information, believed to be reliable; however, Trade Nation does not warrant its completeness or accuracy. All market prices and market data contained in or attached to this communication are indicative and subject to change without notice.

SPX - The Road to 6900 Begins “History never repeats itself. Man always does.”
A deep look into SPX History exposes the path of a market cycle and tells us the truth on where markets are headed.
Percentages don't lie.
See you guys at 6900!

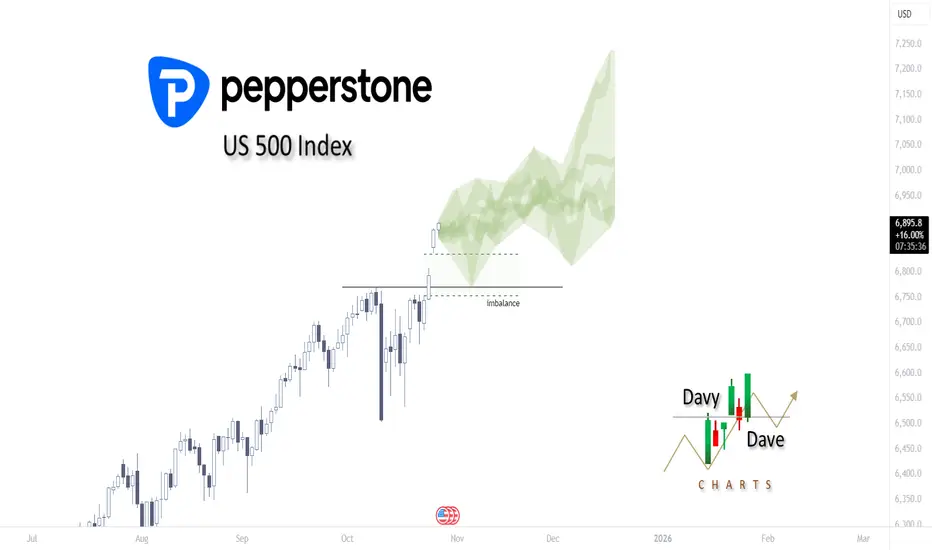
What does history say about the rest of this year?Taking a look at the US 500 Index and plotting the Late October to mid-December highs and lows on post-election year performances, the next two months are looking very bullish. PEPPERSTONE:US500 AMEX:SPY SP:SPX AMEX:VOO
SPX500 ShortElite Analysis
Short on spx500, price gave us the reversal after liquidation of asia high on 1m tf
Targeting lower liquidity pools

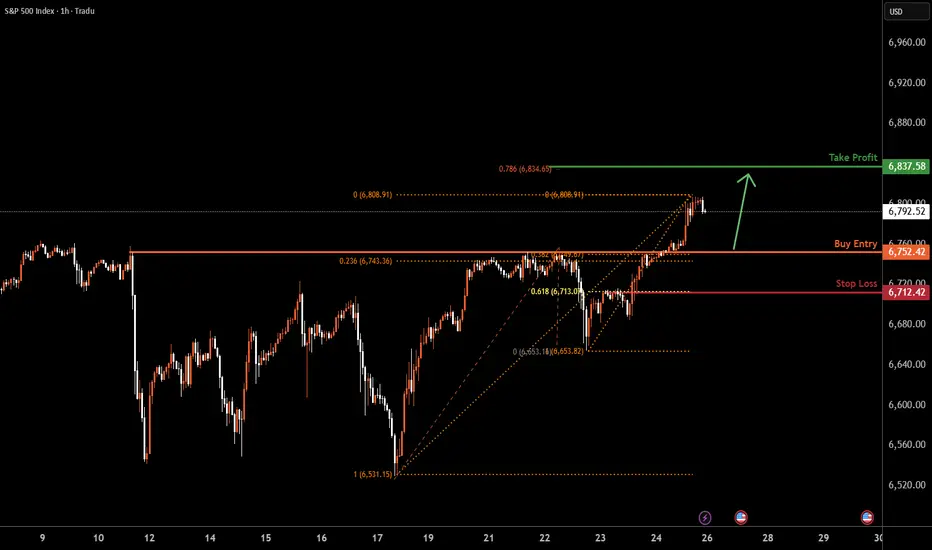
SPX500 | Price Falling Toward Key Pullback SupportS&P500 is falling towards the buy entry at 6,752.42, which is a pullback support that aligns with the 23.6% and the 38.2% Fibonacci retracement and could bounce from this level to the upside.
Stop loss is at 6,712.42, which is a pullback support that lines up with the 61.8% Fibonacci retracement.
Take profit is at 6,837.58, which aligns with the 78.6% Fibonacci projection.
Stratos Markets Limited (tradu.com ):
CFDs are complex instruments and come with a high risk of losing money rapidly due to leverage. 68% of retail investor accounts lose money when trading CFDs with this provider. You should consider whether you understand how CFDs work and whether you can afford to take the high risk of losing your money.
Stratos Europe Ltd (tradu.com ):
CFDs are complex instruments and come with a high risk of losing money rapidly due to leverage. 70% of retail investor accounts lose money when trading CFDs with this provider. You should consider whether you understand how CFDs work and whether you can afford to take the high risk of losing your money.
Up again for SPX500USDHi traders,
Last week SPX500USD went up (making a Triangle invalid), made a correction down and went up again. It looks like the coreection was a running flat.
So now price could be in the next impulsive wave 5 (red) up and next week we could see more upside for this pair.
Let's see what the market does and react.
Trade idea: Wait for the finish of this bigger correction. Trading inside a Triangle is a sure way to lose.
This shared post is only my point of view on what could be the next move in this pair based on my technical analysis.
But I react and trade on what I see in the chart, not what I've predicted or expect.
Don't be emotional, just trade your plan!
Eduwave

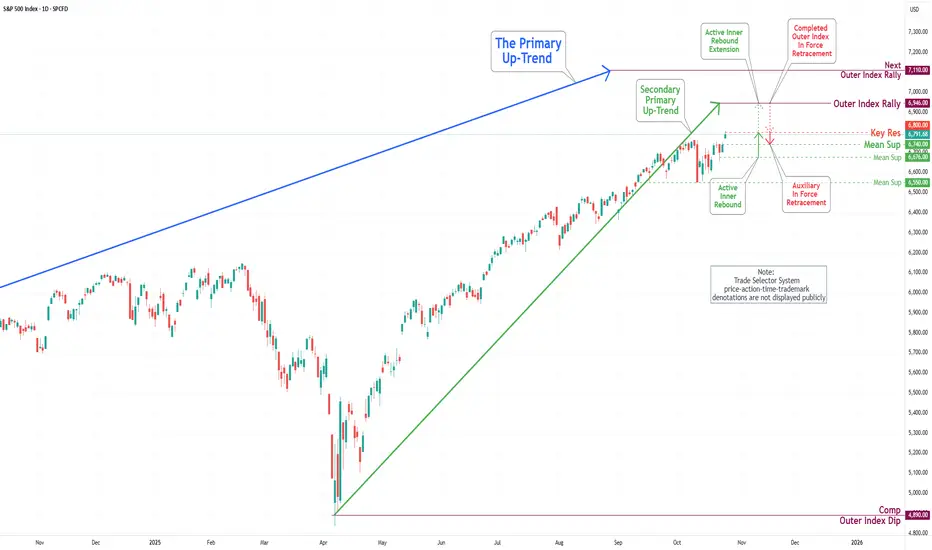
S&P 500 Daily Chart Analysis For Week of Oct 24, 2025Technical Analysis and Outlook:
The most recent trading session exhibited significant volatility in the S&P 500 Index, marked by pronounced price fluctuations between the Mean Resistance at 6671 and the Key Resistance at 6753. This range served as a crucial threshold for market participants, prompting a series of rapid buying and selling that influenced the index's overall wild movement. Ultimately, this price action culminated in a breakout above the completed Outer Index Rally at 6768.
At present, the index is situated at the newly established Key Resistance level of 6800, which lies just below the historical high of 6807. This positioning indicates the potential for further upward momentum, as the prevailing trend suggests a well-structured Active Inner Rebound extension toward the Next Outer Index Rally target of 7110.
Conversely, it is imperative to acknowledge the possibility of a sustained, steady-to-lower pullback from the Key Resistance level of 6800 to Mean Support 6740 for the Secondary Primary Up-Trend to continue on its path.
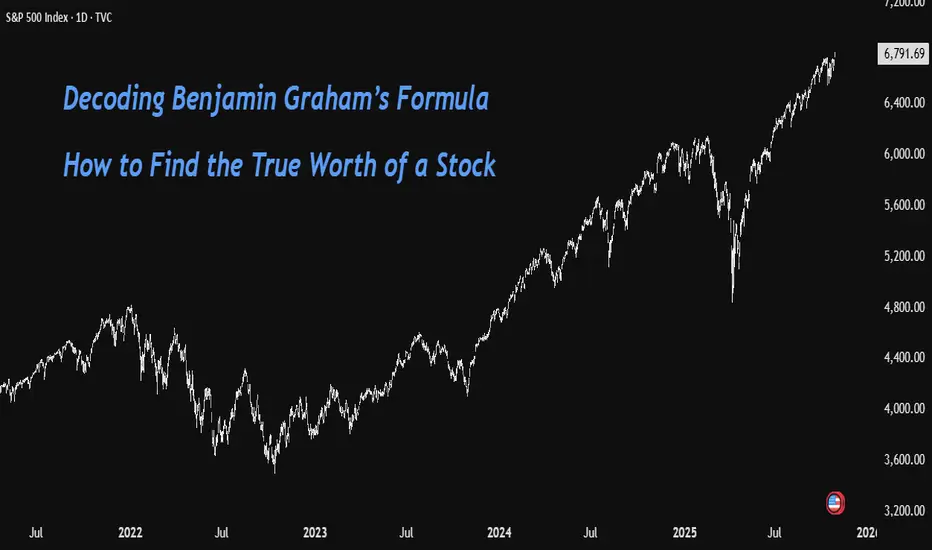
Graham's Formula for Intrinsic Value of a Stock➡ About Benjamin Graham
Benjamin Graham is widely known as the Father of Value Investing. He was a professor, economist, and mentor to great investors like Warren Buffett. Graham’s investment philosophy focused on buying stocks below their intrinsic value to ensure a margin of safety and protecting capital even when markets behave irrationally. His books The Intelligent Investor and Security Analysis remain timeless classics in the world of investing.
➡ His Formula to Calculate the Intrinsic Value of a Stock
Graham designed a simple mathematical model to estimate what a stock is truly worth- its intrinsic value.
Formula:
V=EPS×(8.5+2g)
Later, he modified it to account for changing interest rates:
V= /Y
Meaning of Each Value in the Formula
V: Intrinsic value or the fair value of the stock.
EPS: Earnings per share (trailing twelve months).
8.5: Base P/E ratio for a no-growth company.
g: Expected annual earnings growth rate (for next 7–10 years).
4.4: Average yield on high-grade corporate bonds when Graham proposed the formula.
Y: Current yield on AAA-rated corporate bonds (used to adjust for changing interest rate conditions).
➡ How to Calculate
Let' sunderstand the calculations with the help of an example of NVDA stock:
EPS= 3.5 (TTM)
Growth rate= 32.8 (next 3-5years)
Y= 4.09
All other values remain the same
V= / 4.09
V= 279
So, the intrinsic value of the stock would be around 279
Current price= 186
Difference= 67%
Hence the Formula suggests that the current price is still way below its fair value and hence buyable.
➡ Are these Too Aggressive Valuations?
Yes, it may be too optimistic. The term '2g' gives very high weightage to growth, which can inflate valuations quickly. In a world where corporate earnings growth is less predictable and global interest rates fluctuate, this approach may overvalue companies that appear to have strong growth potential on paper.
➡ Relevance in the Current Market Scenario
While Graham’s formula is historically important and a great conceptual framework for understanding valuation, it should not be used as a standalone tool today. Markets are far more complex and influenced by globalization, technology, inflation, and interest rate cycles.
A more balanced approach is to use Graham’s principles (margin of safety, valuation discipline) but rely on modern valuation models like Discounted Cash Flow (DCF) or Relative Valuation Ratios and treat the formula as a learning foundation rather than a precise valuation tool.
What do you think about this tool for calculating a stock's valuation?
Is it still relevant?
Do 🚀 comment 💬
Disclaimer: I am not a valuation analysis expert so apply your due diligence while investing. The stock example taken in this educational post is just for demonstration purpose and not a buy/sell recommendation.
SPX | Daily Analysis #7 - 27 October 2025Hello and welcome back to DP Weekly Market Review,
Past Week Overview:
The past week saw a strong inflow of volume from investors optimistic about a market rebound, following the sharp two-week decline driven by renewed U.S.–China trade tensions. The S&P 500 initially showed a K-shaped reaction, but buyers quickly stepped in, pushing prices higher. By Friday, the market not only recovered but also broke above the previous high, setting a new record.
On Sunday, Treasury Secretary Bessent announced that the U.S. and China are ready to reach a trade agreement. This news fueled bullish sentiment in the Asian session, causing a major gap-up in the markets, with the index opening around the 6,850 zone.
Week Ahead:
This week stands as one of the most critical of the quarter for global markets.
Federal Reserve Decision: All eyes are on the Fed’s rate announcement—whether they hike, cut, or hold. Every word from Chair Powell regarding “soft landing,” “inflation progress,” or “economic resilience” could move global markets sharply.
Tech Earnings Season: The “Tech Titans” — Apple, Microsoft, Meta, Amazon, and Google — report their earnings this week. These giants collectively account for around 35% of the Nasdaq’s total weight.
U.S.–China Relations: President Trump is expected to meet President Xi for the first time in his second term, with trade tensions still in the background.
1H – 4H Technical Outlook:
As shown on the chart, the market opened with a large bullish gap. Some short-term traders anticipate a pullback to fill the gap, which could push prices down toward the 6,800 area. However, a sustained move above 6,860 may signal further bullish momentum toward the upside.
Trading Strategy:
For now, patience is key — let the market reveal its reaction around key price zones before entering new positions.
Disclaimer:
This content is for informational purposes only and does not constitute financial or investment advice. © DIBAPRISM
Amir D.Kohn

S&P 500 made new all time highs of 6807- S&P 500 does not left behind, it also made new all time highs from Shocks of Tariffs to Market Recovery 📈
- The U.S. market witnessed a sharp 3% drop after Trump’s 100% tariff announcement on China, wiping off nearly $3 trillion in market cap.
- Yet, in just 15 days, the index bounced back, adding back those trillions and stabilizing near a $58 trillion market cap.
- Volatility remains high as trade tensions and election uncertainty drive investor sentiment. ⚖️

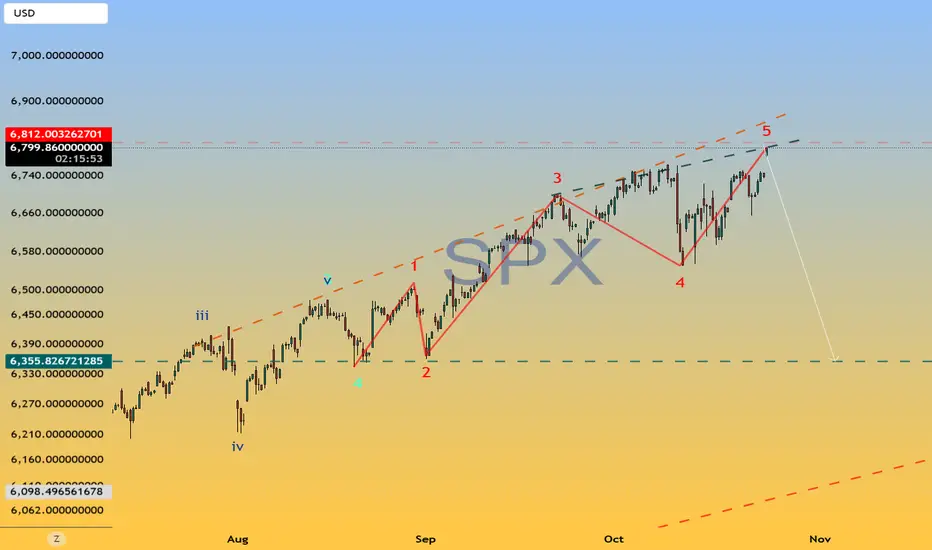
Hellena | SPX500 (4H): LONG to resistance area of 6777.Price made a sharp and strong move to the 6503 level, making wave “4” quite large, but this move did not break the structure.
I think that now the price is in the big wave "5" and middle wave "2".
I think that there will be an upward movement with the purpose to renew the maximum of the wave "3" of higher order.
Therefore, I expect the price in the resistance area of 6777.
Fundamental context
After the sharp drop, the market quickly recovered — investors are once again turning to risk assets amid growing expectations of upcoming Fed rate cuts.
Inflation data came out under control, and corporate earnings have been stronger than expected, boosting confidence in the U.S. economy.
With the dollar losing momentum and bond yields easing, the S&P 500 now has room to extend its move upward toward the resistance area near 6777.
Manage your capital correctly and competently! Only enter trades based on reliable patterns!

SPX500 Slips as Netflix Earnings Cool Wall Street OptimismWall Street Futures Struggle as Netflix Results Weigh on Sentiment
U.S. stock index futures fluctuated on Wednesday as investors moved cautiously through a heavy earnings season, with Netflix’s weaker-than-expected profits cooling risk appetite and adding pressure to market sentiment.
🕯 Technical Outlook
SPX500 has collected volume below the 6,754 pivot line, suggesting potential bearish correction ahead.
As long as the price trades below 6,754, the bias remains bearish, targeting 6,738 → 6,717 → 6,699.
Conversely, a 1H close above 6,771 would confirm a bullish continuation, paving the way toward 6,792 → 6,838.
Pivot: 6,754
Support: 6,738 – 6,717 – 6,699
Resistance: 6,771 – 6,792 – 6,838

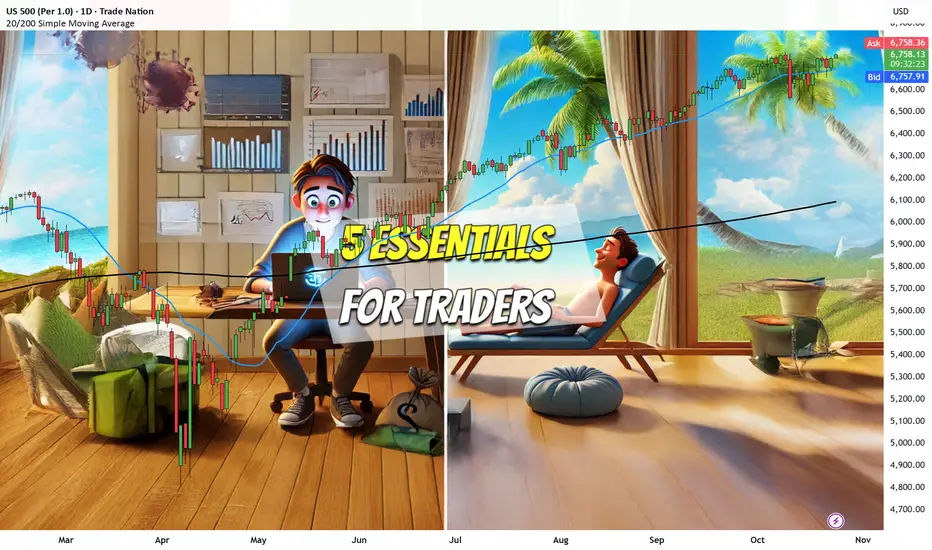
5 Essentials of Trading Success
Trading is the greatest roller coaster you’ll ever ride.
Trading has its thrills, challenges, and endless potential for growth.
But, before you hit “Buy” or “Sell,” it’s crucial to lay down a solid foundation.
Too many traders jump in without preparation, and without knowing the real life variables.
When things go great, they feel normal and you feel in charge.
When things go bad, you feel it’s the end of the world.
So you need to learn to harness each of the 5 essentials to trading success.
Essential #1: Build a Solid Foundation of Knowledge
You wouldn’t drive a car without knowing the rules of the road, right?
Trading is no different.
Before placing your first trade, you’ll need to understand the key concepts and market basics that will serve as your roadmap.
Key areas to cover include:
Market types:
Know the difference between stocks, forex, commodities, and cryptocurrencies. Know which is the best stock screener. Also you need to know which markets will work for you and your trading personality.
Trading terminology:
Terms like “bearish,” “bullish,” “short-selling,” “leverage,” and “margin” might sound like jargon now, but they’ll soon become your everyday vocabulary.
Order types:
Limit orders, market orders, stop-loss, take-profit. Each of these orders serves a specific purpose. Mastering them is essential for making controlled and effective trades.
Essential #2: Select what you want to trade first: The Art of Asset Allocation
Trading is thrilling, but let’s face it.
No one knows what the market will do tomorrow.
That’s why choosing the right mix of assets—and learning the art of asset allocation—is crucial for long-term success.
What does asset allocation mean in practice?
Diversify your portfolio: Don’t put all your eggs in one basket. Invest and trade across different asset classes to spread out risk.
It’s better to trade different portfolios with stocks, Forex, indices and even commodities.
Successful trading isn’t about picking one “winning” asset.
It’s about managing risk and creating a balanced portfolio that can weather market storms.
Diversification is KEY!
Essential #3: Risk Management: Strategies to Protect Your Capital
If you only remember one thing from this article, let it be this:
Risk management is your best friend in trading.
Not only do you learn how to be a trader, but also a risk portfolio manager.
A smart trader doesn’t only think about potential gains—they think about how to protect their capital when things don’t go as planned.
Simple, powerful ways to manage risk include:
Set stop-loss orders: Automatically sell a position when it drops to a certain price to minimize losses.
Use position sizing: Avoid putting too much of your capital into a single trade. Limit each trade to a small percentage of your total funds—usually no more than 0.5%-2%.
Apply the “2% rule”: Never risk more than 2% of your capital on a single trade. This can help prevent one loss from wiping out your progress.
Remember, every trader has losses; it’s part of the game.
But with a solid risk management strategy, those losses won’t be catastrophic.
Essential #4: Charting the Path: Introduction to Technical Analysis
Charts are a trader’s treasure map. Learn to interpret them, and you’ll have insights into market trends, price movements, and potential buy/sell signals. Technical analysis allows traders to make data-driven decisions rather than relying on gut feelings.
Key tools for technical analysis:
Candlestick patterns: These can show trends, reversals, and market sentiment. Patterns like “doji,” “hammer,” and “engulfing” candles can offer powerful insights.
Indicators: Tools like moving averages, RSI (Relative Strength Index), and MACD (Moving Average Convergence Divergence) help you assess price momentum and potential reversal points.
As you might know by now. I like to stick to three indicators: Breakout patterns, 2 Moving Averages and Trend lines.
We need to learn to simplify our strategy because we will be following it over our entire trading career.
Trendlines: Drawn on charts, trendlines reveal price direction and potential breakout or breakdown levels.
Essential #5: The Psychology of Success: Developing a Trader’s Mindset
Trading isn’t just about strategies and technical skills; it’s also a mental game.
Emotions—fear, greed, EGO, frustration — can interfere with sound decision-making.
If you can’t manage your mind, you can’t manage your portfolio.
And that’s why it’s essential to develop a mechanical, professional and calm mind when trading.
Developing a disciplined mindset is what separates successful traders from those who burn out.
Conclusion
Let’s sum up the 5 ESSENTIALS to trading success.
Essential #1: Knowledge First: Understand trading terminology, market types, and order types.
Essential #2: Asset Allocation: Diversify your portfolio based on your risk profile.
Essential #3: Risk Management: Protect your capital with stop-losses, position sizing, and the 2% rule.
Essential #4: Technical Analysis: Learn chart patterns, indicators, and trendlines to guide decisions.
Essential #5: Trader’s Mindset: Control emotions, maintain discipline, and focus on long-term success.
Trading isn’t just a skill—it’s an adventure that rewards preparation, patience, and resilience.
Keep learning, stay focused, and remember: your success is built one trade at a time.