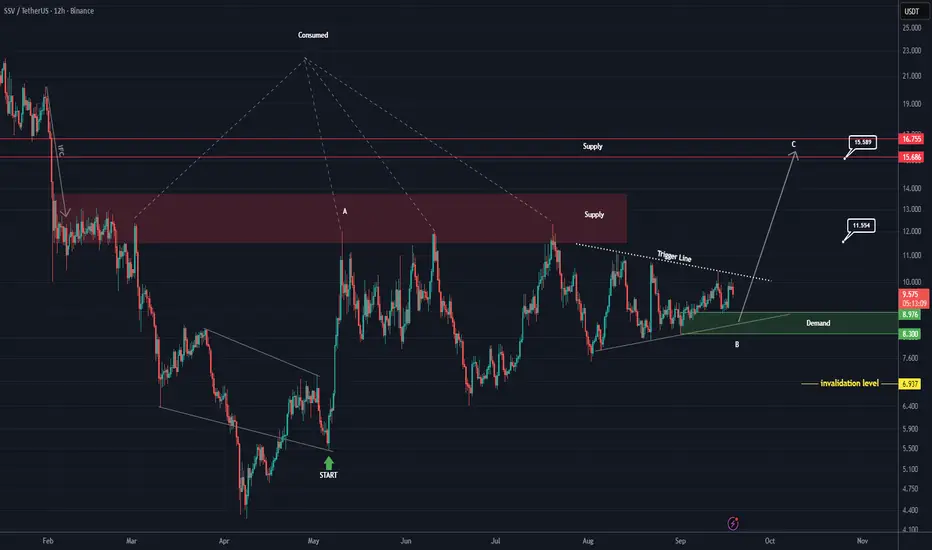
SSV Looks Bullish (12H)A supply zone has been highlighted on the chart. This supply has been consumed many times, yet no lower low has been formed. Also, from the point where we marked it on the chart, a bullish move started. After this bullish move, the price is currently forming a range. It seems that the initial move i
Related pairs
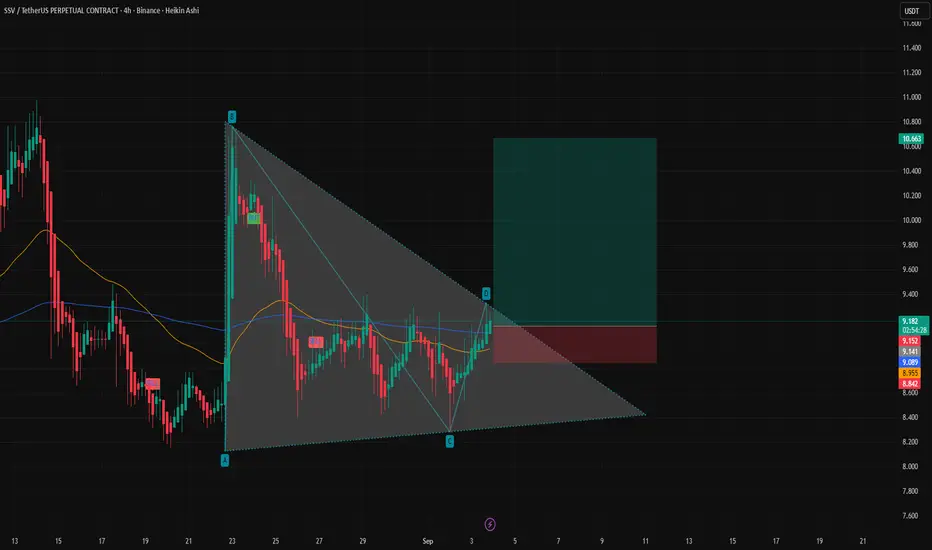
Technical Analysis (SSV/USDT – 4H)1. Pattern
The chart is showing a descending triangle / falling wedge structure (A–B–C–D).
Price has moved up strongly from point C → D, now testing the upper trendline resistance.
If breakout happens above 9.20–9.30, bullish momentum can accelerate.
2. Key Levels
Immediate Resistance: 9.20 – 9
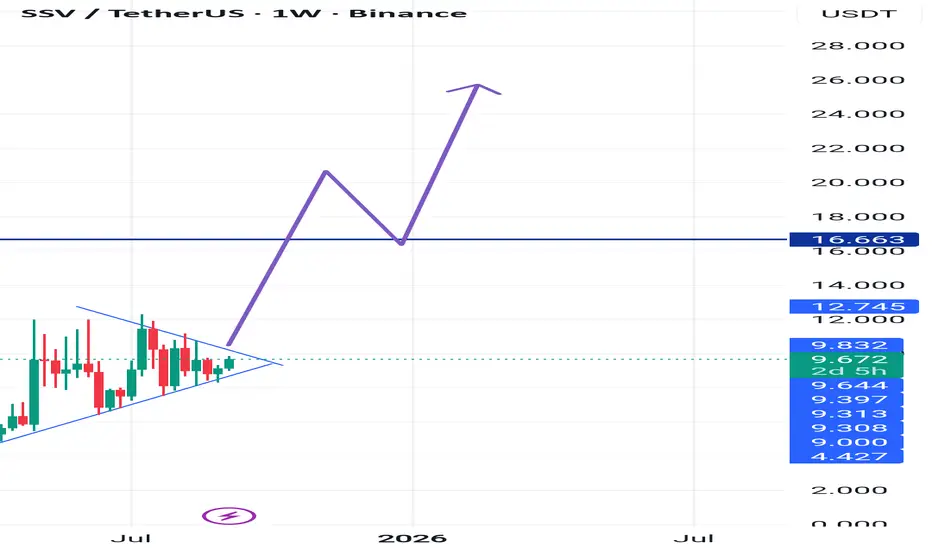
SSV continues to trade within a high timeframe equilibriumSSV continues to trade within a high timeframe equilibrium, with dynamic support and resistance levels gradually converging near the point of control. This compression has formed an apex zone where price action is coiling, setting the stage for a decisive breakout. Despite the tightening range, the
SSV (SPOT)BINANCE:SSVUSDT
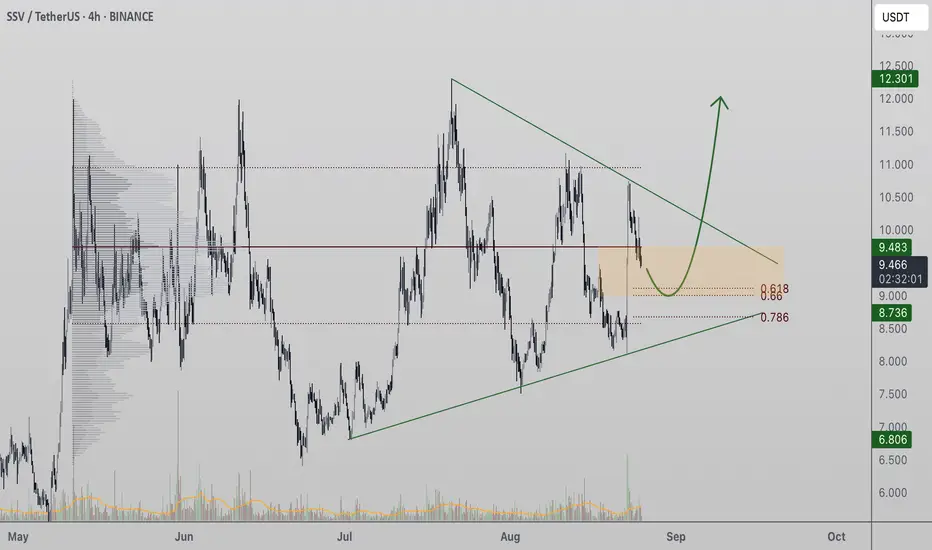
#SSV/ USDT
Entry range (8.60- 9.19)
SL 4H close below8.35
T1 11.90
T2 15.00
_______________________________________________________
Golden Advices.
********************
* collect the coin slowly in the entry range.
* Please calculate your losses before the entry.
* Do not ente

SSVUSDTBreakout the trendline and have a chance to go high and higher its your responsibility to buy or sell.

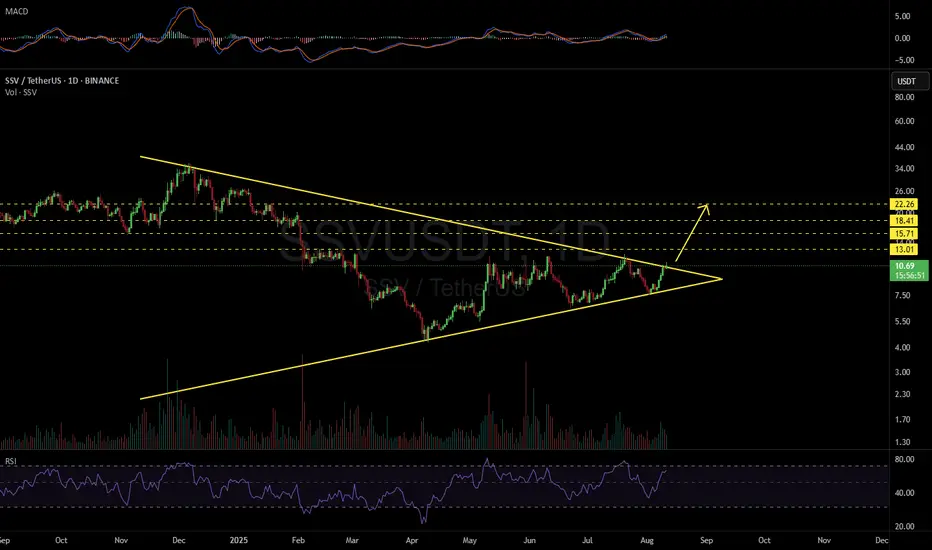
SSVUSDT 1D#SSV is on the verge of breaking out above the symmetrical triangle on the daily chart. If confirmed, the potential upside targets are:
🎯 $13.01
🎯 $15.71
🎯 $18.41
🎯 $22.26
⚠️ As always, use a tight stop-loss and apply proper risk management.
$SSV/USDT has broken out$SSV/USDT has broken out of a key ascending triangle on the daily chart, clearing resistance around $11.90 with strong momentum.
The breakout targets an 84% potential upside toward the $21+ zone.
As long as it holds above the breakout level, the trend remains bullish with further gains likely.

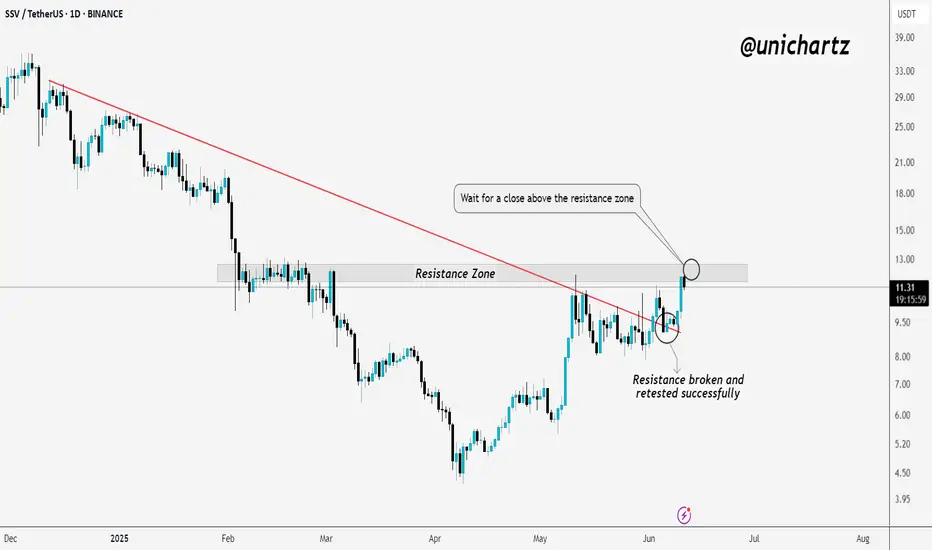
SSV | Bullish Market Structure Shift in PlayTSXV:SSV is showing strong bullish momentum. The key resistance line has been broken and successfully retested, confirming a shift in market structure.
Now, price is testing the major resistance zone. For further upside confirmation, it's important to wait for a clear daily close above this resist
SSV/USDTKey Level Zone: 8.000 - 8.700
HMT v8.1 detected. The setup looks promising, supported by a previous upward/downward trend with increasing volume and momentum, presenting an excellent reward-to-risk opportunity.
HMT (High Momentum Trending):
HMT is based on trend, momentum, volume, and market struc

See all ideas
Summarizing what the indicators are suggesting.
Oscillators
Neutral
SellBuy
Strong sellStrong buy
Strong sellSellNeutralBuyStrong buy
Oscillators
Neutral
SellBuy
Strong sellStrong buy
Strong sellSellNeutralBuyStrong buy
Summary
Neutral
SellBuy
Strong sellStrong buy
Strong sellSellNeutralBuyStrong buy
Summary
Neutral
SellBuy
Strong sellStrong buy
Strong sellSellNeutralBuyStrong buy
Summary
Neutral
SellBuy
Strong sellStrong buy
Strong sellSellNeutralBuyStrong buy
Moving Averages
Neutral
SellBuy
Strong sellStrong buy
Strong sellSellNeutralBuyStrong buy
Moving Averages
Neutral
SellBuy
Strong sellStrong buy
Strong sellSellNeutralBuyStrong buy
Displays a symbol's price movements over previous years to identify recurring trends.
Frequently Asked Questions
The current price of ssv.network / Tether SPOT (SSV) is 7.257 USDT — it has fallen −0.76% in the past 24 hours. Try placing this info into the context by checking out what coins are also gaining and losing at the moment and seeing SSV price chart.
ssv.network / Tether SPOT price has fallen by −18.52% over the last week, its month performance shows a −14.77% decrease, and as for the last year, ssv.network / Tether SPOT has decreased by −70.98%. See more dynamics on SSV price chart.
Keep track of coins' changes with our Crypto Coins Heatmap.
Keep track of coins' changes with our Crypto Coins Heatmap.
ssv.network / Tether SPOT (SSV) reached its highest price on Mar 25, 2024 — it amounted to 65.990 USDT. Find more insights on the SSV price chart.
See the list of crypto gainers and choose what best fits your strategy.
See the list of crypto gainers and choose what best fits your strategy.
ssv.network / Tether SPOT (SSV) reached the lowest price of 4.260 USDT on Apr 9, 2025. View more ssv.network / Tether SPOT dynamics on the price chart.
See the list of crypto losers to find unexpected opportunities.
See the list of crypto losers to find unexpected opportunities.
The safest choice when buying SSV is to go to a well-known crypto exchange. Some of the popular names are Binance, Coinbase, Kraken. But you'll have to find a reliable broker and create an account first. You can trade SSV right from TradingView charts — just choose a broker and connect to your account.
Crypto markets are famous for their volatility, so one should study all the available stats before adding crypto assets to their portfolio. Very often it's technical analysis that comes in handy. We prepared technical ratings for ssv.network / Tether SPOT (SSV): today its technical analysis shows the strong sell signal, and according to the 1 week rating SSV shows the sell signal. And you'd better dig deeper and study 1 month rating too — it's sell. Find inspiration in ssv.network / Tether SPOT trading ideas and keep track of what's moving crypto markets with our crypto news feed.
ssv.network / Tether SPOT (SSV) is just as reliable as any other crypto asset — this corner of the world market is highly volatile. Today, for instance, ssv.network / Tether SPOT is estimated as 0.98% volatile. The only thing it means is that you must prepare and examine all available information before making a decision. And if you're not sure about ssv.network / Tether SPOT, you can find more inspiration in our curated watchlists.
You can discuss ssv.network / Tether SPOT (SSV) with other users in our public chats, Minds or in the comments to Ideas.