Related pairs

TradeCity Pro | SUI Bears Stay in Full Control👋 Welcome to TradeCity Pro!
In this analysis, I’m going to take a look at SUI, one of the Layer 1 projects, currently ranked #26 on CoinMarketCap with a market capitalization of $3.43 billion.
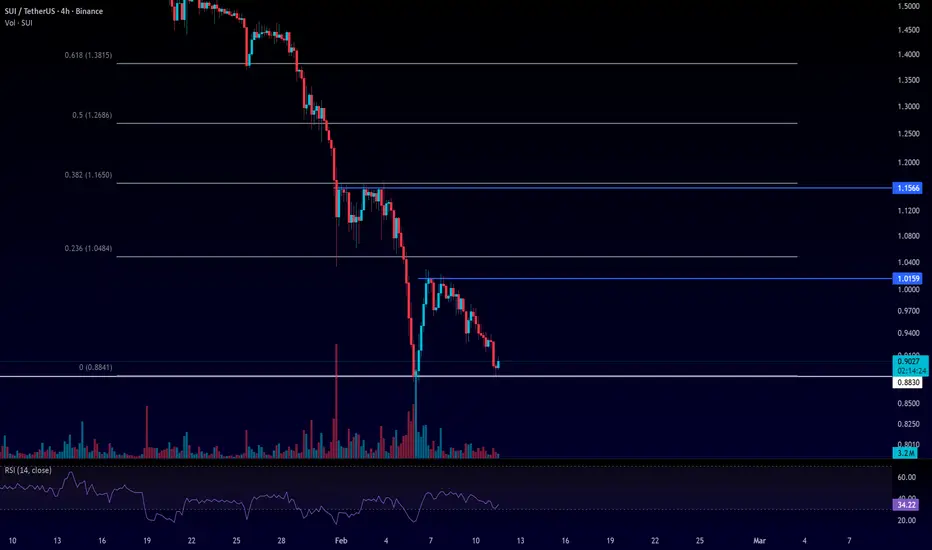
⌛️ 4-Hour Timeframe
On the 4-hour chart, this coin is in a very strong downtrend, and in its latest bearis
Sui headed towards a new all-time high?SUIUSDT just activated the late September 2024 price range, the same level that supported a 1,000%+ bullish wave. This exact level was tested on a wick only which shows buyers were present; ready to buy, ready to hold, ready to trade.
SUIUSDT is extremely bullish not based on this chart but based o

#SUI/USDT – Bullish Triangle Breakout Confirmed | Resistance#SUI
The price is moving within a descending channel on the hourly timeframe. It has reached the lower boundary and is heading towards a breakout, with a retest of the upper boundary expected.
The Relative Strength Index (RSI) is showing a downward trend, approaching the lower boundary, and an upw

Rising Channel Breakdown → Waiting for Better Buy Prices on SUISUI has been moving inside a well-defined rising channel on the higher timeframe, forming higher highs and higher lows. However, price is now trading near the lower boundary of the channel , showing signs of weak momentum and potential breakdown.
Historically, a loss of the rising channel supp

SUI wow more gain ready for it 20% gain toward 1.20$HI
after huge correction to the downside now some green candlesticks for continuing the process or reverse is logical i can see at least 20% gain toward 1.20$ for SUI

#SUI/USDT – Bullish Triangle Breakout Confirmed | Resistance#SUI
The price is moving within a descending channel on the hourly timeframe. It has reached the lower boundary and is heading towards a breakout, with a retest of the upper boundary expected.
The Relative Strength Index (RSI) is showing a downward trend, approaching the lower boundary, and an upw

Sui long to $1.0625 TodayJust opened a new long on CRYPTOCAP:SUI
🛑Sl: $1.0165
🎯Tp: $1.0625
💰1.85+RR
My DTT analysis suggest a continuation push soon.

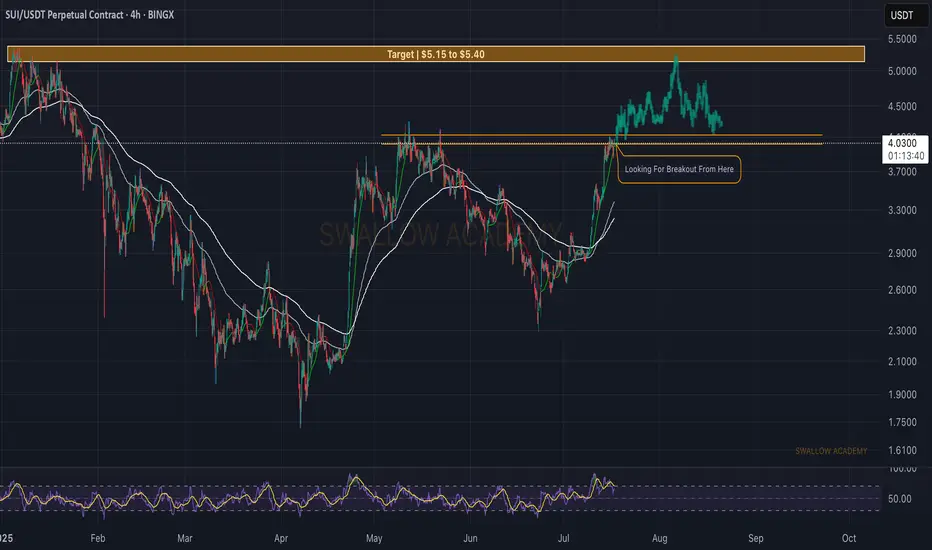
Sui (SUI): Looking For Breakout | Potential Move To $5.40!SUI is still hovering near our local resistance line, where since last time we had one breakout but failed one, which led the price back to EMAs, where we bounced off from.
We still see upside potential here so if we get another breakout attempt, most likely it will be the last one, before going f

Sui (SUI): Looking For BOS (Break of Structure) Sui coin looks strong, where we are about to get a proper BOS (Break of Structure), which then would give us an ideal opportunity for a long position up until $5.40, where our target is sitting currently.
Once there we expect to see some sort of correction or sideways movement, before next wave of
See all ideas
Summarizing what the indicators are suggesting.
Oscillators
Neutral
SellBuy
Strong sellStrong buy
Strong sellSellNeutralBuyStrong buy
Oscillators
Neutral
SellBuy
Strong sellStrong buy
Strong sellSellNeutralBuyStrong buy
Summary
Neutral
SellBuy
Strong sellStrong buy
Strong sellSellNeutralBuyStrong buy
Summary
Neutral
SellBuy
Strong sellStrong buy
Strong sellSellNeutralBuyStrong buy
Summary
Neutral
SellBuy
Strong sellStrong buy
Strong sellSellNeutralBuyStrong buy
Moving Averages
Neutral
SellBuy
Strong sellStrong buy
Strong sellSellNeutralBuyStrong buy
Moving Averages
Neutral
SellBuy
Strong sellStrong buy
Strong sellSellNeutralBuyStrong buy
Displays a symbol's price movements over previous years to identify recurring trends.
Frequently Asked Questions
The current price of SUI / TetherUS (SUI) is 0.9930 USDT — it has fallen −1.05% in the past 24 hours. Try placing this info into the context by checking out what coins are also gaining and losing at the moment and seeing SUI price chart.
SUI / TetherUS price has fallen by −0.80% over the last week, its month performance shows a −46.09% decrease, and as for the last year, SUI / TetherUS has decreased by −69.62%. See more dynamics on SUI price chart.
Keep track of coins' changes with our Crypto Coins Heatmap.
Keep track of coins' changes with our Crypto Coins Heatmap.
SUI / TetherUS (SUI) reached its highest price on Jan 6, 2025 — it amounted to 5.3687 USDT. Find more insights on the SUI price chart.
See the list of crypto gainers and choose what best fits your strategy.
See the list of crypto gainers and choose what best fits your strategy.
SUI / TetherUS (SUI) reached the lowest price of 0.1000 USDT on May 3, 2023. View more SUI / TetherUS dynamics on the price chart.
See the list of crypto losers to find unexpected opportunities.
See the list of crypto losers to find unexpected opportunities.
The safest choice when buying SUI is to go to a well-known crypto exchange. Some of the popular names are Binance, Coinbase, Kraken. But you'll have to find a reliable broker and create an account first. You can trade SUI right from TradingView charts — just choose a broker and connect to your account.
Crypto markets are famous for their volatility, so one should study all the available stats before adding crypto assets to their portfolio. Very often it's technical analysis that comes in handy. We prepared technical ratings for SUI / TetherUS (SUI): today its technical analysis shows the sell signal, and according to the 1 week rating SUI shows the sell signal. And you'd better dig deeper and study 1 month rating too — it's sell. Find inspiration in SUI / TetherUS trading ideas and keep track of what's moving crypto markets with our crypto news feed.
SUI / TetherUS (SUI) is just as reliable as any other crypto asset — this corner of the world market is highly volatile. Today, for instance, SUI / TetherUS is estimated as 0.92% volatile. The only thing it means is that you must prepare and examine all available information before making a decision. And if you're not sure about SUI / TetherUS, you can find more inspiration in our curated watchlists.
You can discuss SUI / TetherUS (SUI) with other users in our public chats, Minds or in the comments to Ideas.