SUIUSDT | Swing Buy Opportunity (Educational Idea)📌 Buy Zone (DCA Strategy)
I’m planning to accumulate SUI inside the 1.50 – 1.20 USD demand zone using a DCA structure:
Entry 1: 1.50
Entry 2: 1.40
Entry 3: 1.30
(DCA helps average the entry during volatility inside the zone.)
⛔ Stop Loss
Weekly candle close below 1.20 USD
A confirmed weekly breakdown invalidates the bullish swing structure.
🎯 Targets (Swing Outlook)
TP1: 2.2750
TP2: 3.0000
TP3: 3.7500
TP4: 4.5000
TP5: 5.2500
These targets align with major liquidity levels and structural resistance zones on the higher timeframes.
⚙️ Trade Management
This is a swing trade, not a day trade.
Partial take-profit at each target is recommended.
Move stop-loss to breakeven after reaching TP1 (2.2750).
Strict risk management is essential due to the weekly stop-loss structure.
⚠️ Disclaimer
This plan reflects my personal analysis and execution style.
It is not financial advice, and each trader should manage risk according to their own strategy.
Trade ideas

SUI TA (Y25.P4.Video1). Complete technical approachHi Traders,
Besides being an educational piece on how I approach the charts, we will dive into what is likely to play out from an Elliott Wave perpective and using support and resistance methods to find confluence with our fibonacci approach for levels to short and long.
I promise you newbies or intermediates, master this and you will have much more success in your trading. Experience obviously takes time.
All the best,
S.SAri

$SUI - Long term AnalysisShared MSS (Bear market) confirmed when this shitcoin was around $3.20.
now this is the bigger picture for the coming months..
(Nothing Guaranteed, It's just a scenario)

LongAccording to the analysis of the waves and the help of the Gann method, it can be expected that the price will return to the green zone again.
This is my personal opinion. Please don't use it as your trading criteria. Good luck

SUI/USDT Could switch sides soon. Be readySUI/USDT on the 1H chart appears to have completed a downward correction. The price action has followed a large descending channel and what looks like a corrective structure, ending with a final five-wave move.
Key Levels
Potential Entry: Upon confirmation of the breakout above $1.62.
Target 1: $1.9 (50% of the previous down trend)
Target 2: $1.973 (61% of the previous down trend)
Target 3: $2.070 (Testing previous resistance zone)
Invalidation/Stop-Loss: A move and close below the wave (5) low around $1.50
What do you do? Look for a bullish break with high volume from the immediate small consolidation pattern, then take your longs.
Good Luck!

SUI/USDT:LIVE TRADEHello friends
First of all, I must say that risk and capital management should be observed and any decision-making is your responsibility.
Given the decline we had, we now see that buyers have entered and are one by one setting higher ceilings and floors, which will cause the price to rise to the specified targets if the specified resistance is broken.
*Trade safely with us*

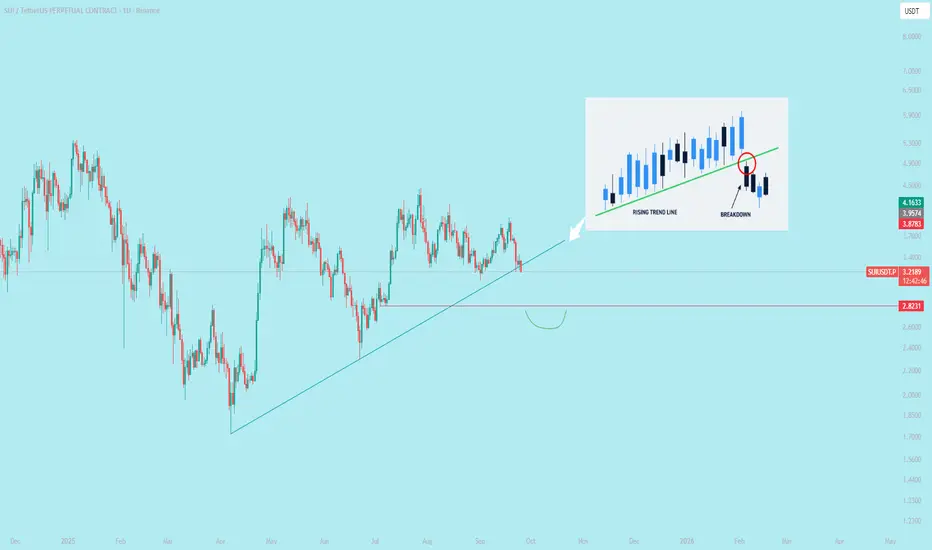
$SUI Trendline breakdownA trendline breakdown occurs when the price of an asset falls below a trendline, signaling a potential reversal or shift in market momentum. Here’s how it works, explained concisely:
1. **Trendline Definition**: A trendline is a diagonal line drawn on a price chart connecting higher lows in an uptrend or lower highs in a downtrend, indicating support or resistance levels.
2. **Breakdown Process**:
- In an **uptrend**, a trendline connects higher lows, acting as support.
- A breakdown happens when the price closes below this trendline, suggesting buyers are losing control and sellers are gaining momentum.
- The break often indicates the end of the uptrend, potentially leading to a price decline or consolidation.
3. **Confirmation**:
- A single candle closing below the trendline may not confirm a breakdown.
- Traders often wait for additional signals, like a strong bearish candle, increased selling volume, or a retest of the trendline (where price fails to reclaim it).
4. **Key Factors**:
- **Volume**: Higher volume on the breakdown strengthens its validity.
- **Timeframe**: Breakdowns on longer timeframes (e.g., daily or weekly) are more significant than on shorter ones (e.g., hourly).
- **Retest**: Price may return to test the broken trendline as resistance before continuing downward.
5. **Implications**:
- A breakdown can signal a trend reversal (from bullish to bearish) or a temporary pullback.
- Traders may use it to enter short positions, set stop-losses above the trendline, or exit long positions.
6. **False Breakdowns**:
- Sometimes, price briefly dips below the trendline but quickly recovers, known as a "fake out."
- To avoid this, traders use additional indicators like moving averages, RSI, or support levels for confirmation.
**Note**: Always combine trendline analysis with other technical indicators and risk management, as breakdowns are not foolproof signals. Market conditions and news can also impact outcomes.
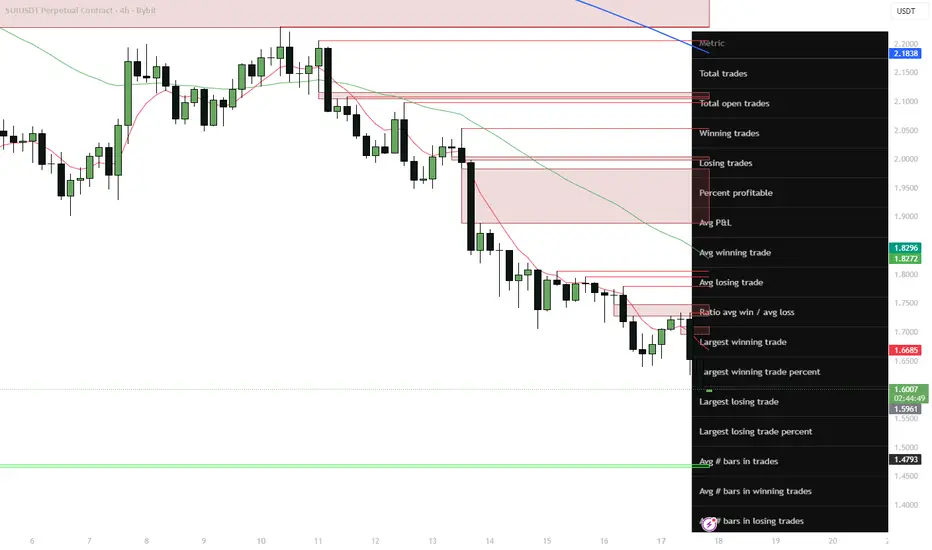
SUI 4H — Deviation long into unlock risk (mean-reversion setup)Got a fresh long signal from my 4H EMA deviation strategy on SUIUSDT (Bybit).
After a persistent downtrend from the 2.3–2.0 area, price has flushed into my lower deviation / demand zone and is now extended from the main EMAs on several timeframes.
On the chart (#4h):
– Price is trading well below the 4H and 1D EMAs, Dev% on multiple TFs shows strong extension away from the mean.
– We just printed another local low with a cluster of my multi-TF “exhaustion” signals, right on the lower ATR band.
– Above price sit the first liquidity pockets around 1.66–1.69 and then a larger supply/FVG zone near 1.75–1.83, aligned with the 4H EMA ribbon.
– I treat this move as a liquidation / unlock front-run leg inside a still-resilient higher-TF range for SUI.
Strategy stats (for this 4H deviation system)
31 trades, all longs:
– Winrate ≈ 83.9% (26W / 5L)
– Avg win ≈ +12.5%, avg loss ≈ −6.6% → avg R:R ≈ 2.37
– Avg holding time ≈ 24 bars on #4h (about 4 days)
So the system is designed to take oversold 4H swings and ride the mean-reversion back into the EMA band / supply zones over 2–5 days.
Trade plan (swing 2–5 days)
– Entry: around 1.60–1.62 (current long triggered near 1.61).
– Main target: 1.75–1.77 — first 4H supply zone and mid of the previous distribution block.
– Extended target: 1.82–1.83 — upper boundary of the 4H supply cluster and confluence with higher EMA/ATR levels.
– Invalidation: 4H close below 1.48. That break would mean the current demand zone failed and I step aside.
This gives an R:R of roughly 1:2 from entry to the extended target.
Fundamental snapshot
SUI is still holding in the upper part of its yearly range despite the recent correction. Over the last 30 days:
– TVL around ~$3.03B (≈$1.64B bridged, ~$1.39B native), with strong DEX volume (~$383.5M/day) and perps volume (~$144.3M/day).
– Narrative tailwinds: upcoming USDsui native stablecoin from Bridge (Stripe-backed), institutional rails via Crypto.com custody/liquidity, and the Mysticeti v2 core upgrade from Mysten Labs.
– Headwinds: notable November unlocks (~$146.6M pool), TVL pullback of ~15% from the October peak and sector-wide risk-off in L1/alt space.
Net read: structurally positive fundamentals and growing ecosystem, but short-term risk is higher due to unlocks and derivatives positioning — ideal conditions for sharp but tradeable mean-reversion moves.
Alternative scenario
If unlock selling and risk-off pressure continue and SUI starts closing 4H candles below 1.48, I’ll treat this as a deeper leg toward the next demand around 1.40–1.35 and will wait for a new deviation signal rather than averaging down.
Not financial advice — just a structured 4H deviation long based on my system stats and current SUI fundamentals.
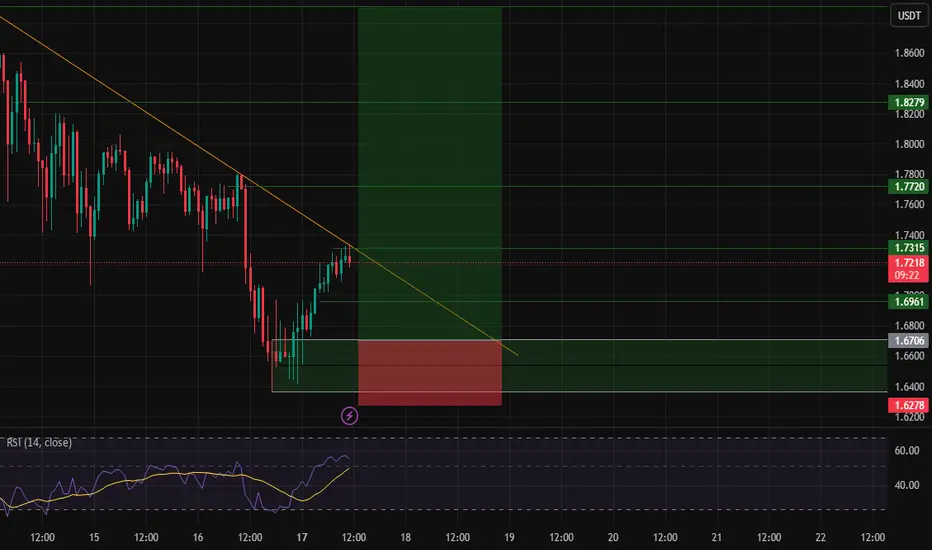
sui usdt long signal---
📢 Trade Idea: SUI/USDT
Type: Long
Entry: 1.6705
---
🎯 Take-Profit Targets (Partial Exits):
• TP1 = 1.6960
• TP2 = 1.7314
• TP3 = 1.7720
• TP4 = 1.8279
• TP5 = 1.8895
---
🛑 Stop-Loss: 1.6275
⏱ Timeframe: 15m
⚖️ R/R Ratio: 5.12
💥 Suggested Leverage: 5x – 10x
---
🧠 Technical Analysis Summary:
SUI is forming a bullish continuation pattern above the 1.65–1.67 support zone.
The price is holding above EMA20 and EMA50 on lower timeframes, showing strong upward momentum.
A breakout and successful hold above 1.69 would confirm bullish continuation toward
1.73 → 1.77 → 1.82 → 1.88.
RSI is trending upward with no bearish divergence, indicating strong buyer pressure.
---
⚙️ Trade Management Tips:
• Take partial profit at TP1, then move SL to Entry.
• Use a trailing stop from TP2 onwards.
• Avoid late entries if price closes below 1.65 on the same timeframe.
---
⚠️ Disclaimer:
This analysis is for educational purposes only and not financial advice.
Always manage your risk and trade responsibly.
---
📌 TradingView Hashtags:
#SUIUSDT #CryptoSignal #TradingViewIdeas #LongSetup
#TechnicalAnalysis #CryptoTrading #Altcoins #FuturesTrading
#SUI/USDT – Bullish Triangle Breakout Confirmed | Resistance #SUI
The price is moving in a descending channel on the 1-hour timeframe and is expected to break out and continue upwards.
We have a trend to stabilize above the 100-period moving average again.
We have a downtrend on the RSI indicator, which supports an upward move if it breaks above it.
We have a key support zone in green that pushed the price higher at 1.75.
Entry price: 1.77
First target: 1.80
Second target: 1.84
Third target: 1.88
For risk management, don't forget your stop-loss and capital management.
The stop-loss is below the support zone in green.
Upon reaching the first target, take some profit and then change your stop-loss order to an entry order.
For any questions, please comment.
Thank you.

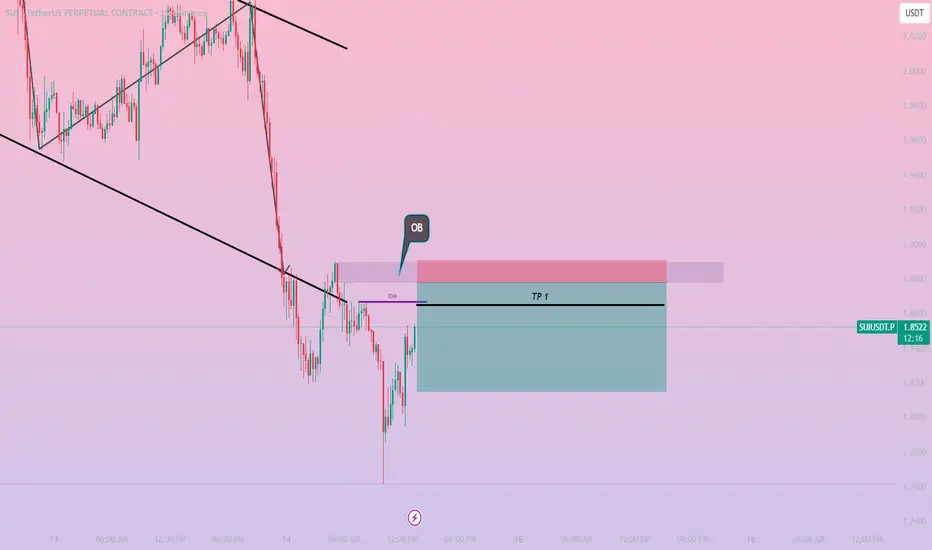
SUI/USDT – Bearish Order Block Reaction | 15m SMC AnalysisMarket Context:
Price is moving inside a clear descending structure, respecting lower highs and lower lows. The previous impulsive drop created a fresh Bearish Order Block (OB) on the 15m timeframe.
Key Points:
Price retraced back into the 15m Bearish OB zone (highlighted).
Market respected the IDM (Internal Deviation Move) indicating liquidity grab before continuation.
Structure remains bearish as long as price stays below the OB.
Reaction candle confirms sellers stepping in from premium zone.
Entry Idea:
Sell from the OB mitigation area with stop above the OB high.
Targets:
TP1: Mid-range level (marked on chart) as first liquidity zone 1:1 RR.
Further targets can be left open if trend continues lower.
SMC Reasons for Entry:
Trend alignment (Bearish)
Premium pricing (retracement to OB)
IDM confirmation
Liquidity sweep before continuation
Bias: ❗ Bearish continuation expected unless OB gets invalidated.
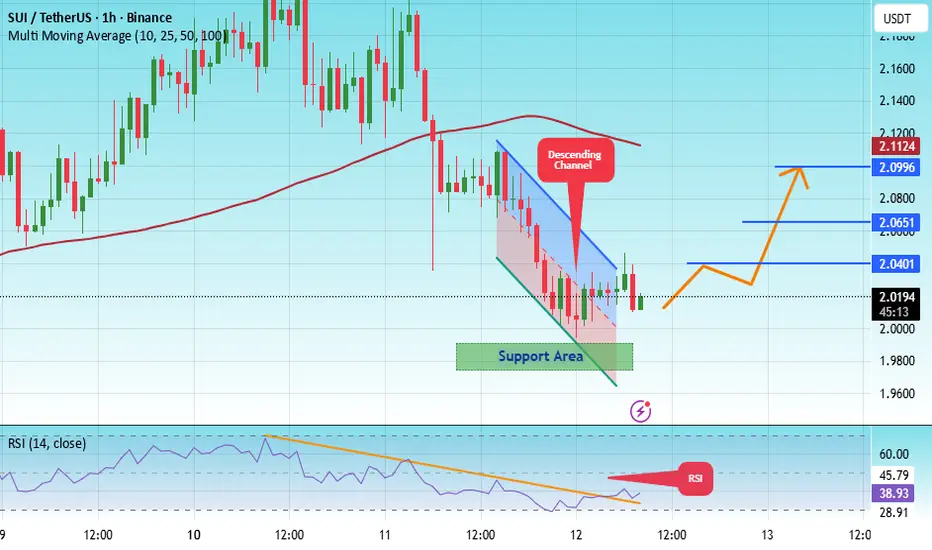
#SUI/USDT – Bullish Triangle Breakout Confirmed | Resistance Li#SUI
The price is moving within an ascending channel on the 1-hour timeframe and is adhering to it well. It is poised to break out strongly and retest the channel.
We have a downtrend line on the RSI indicator that is about to break and retest, which supports the upward move.
There is a key support zone in green at the price of 1.98, representing a strong support point.
We have a trend to stabilize above the 100-period moving average.
Entry price: 2.02
First target: 2.04
Second target: 2.06
Third target: 2.02
Don't forget a simple money management tip:
Place your stop-loss order below the support zone in green.
Once you reach the first target, save some money and then change your stop-loss order to an entry order.
For any questions, please leave a comment.
Thank you.
SUI USDT LONG SIGNAL---
📢 Signal Alert
🔹 Pair: SUI / USDT
📈 Trade Type: Long
💰 Entry Zone: 2.0737 – 2.0310
🎯 Take-Profit Targets (Partial Management):
▫️ TP1 = 2.1080
▫️ TP2 = 2.1790
▫️ TP3 = 2.2180
▫️ TP4 = 2.3188
🛑 Stop-Loss: 1.9970
📊 Timeframe: 15m
⚖️ Risk/Reward Ratio: 3.24
📌 Suggested Leverage: 5x – 10x
⚠️ Capital management is mandatory.
💬 Please review the chart before entering the trade.
---
🧠 Technical Overview:
SUI is forming a bullish structure above the 2.00 key support, showing strength with higher lows and growing volume.
A breakout above 2.10 can confirm momentum toward the 2.17–2.21 zone.
RSI on the 15m chart is rising from mid-levels, and price is holding above EMA20 — both indicating bullish continuation potential.
---
⚙️ Trade Management Tips:
Take partial profit at TP1 and move SL to entry.
Trail stop-loss for TP2–TP4.
Avoid holding if candle closes below 1.9970.
---
⚠️ Disclaimer:
This signal is for educational purposes only and not financial advice.
Always perform your own analysis and apply strict risk management.
---

SUI 2-day death crossA 2 day death cross prints on the above 2 day chart of SUI. That is when the 2-day 50 SMA crosses down the 2-day 200 SMA (red). Sounds bearish doesn’t it?
The truth, when looking left, was far different. Price action climbed an astonishing 900% on the 2 day death cross print.
Is history repeating?
Maybe. There’s two questions that first must be positively answered before a repeat of history:
1. The trend, is higher highs higher lows printing?
2. Support and resistance, which is it?
Both questions are negatively answered at this moment. A long position is irrational until that changes.
Moving averages do not predict the future
Too easily traders see moving averages as a forecast of things to come. It feels dumb for saying this: " A moving average is the average value for a set of values over a given period of time ". You’d be surprised how many people do not realise that. Moving averages are telling you something of the past and nothing about the future. Only questions 1 and 2 can do that.
What can be expected?
It is clear an upward move in price action can be expected on the death cross print. At least until market structure. This would be a 50% gain from price action today. After that, questions 1 and 2 must become positive, just as before in late 2024.
Conclusions
The so-called death cross, a term that sounds far more apocalyptic than it deserves, has once again provoked hysteria in the usual corners of the market. Every time two moving averages intersect, a small army of self-anointed prophets appear, clutching at trend lines as though they were holy scripture. But, as ever, the data mocks the drama. The last time this same formation appeared, SUI didn’t die, it rose ninefold. That’s not a harbinger of doom; it’s a reminder that the market, unlike superstition, doesn’t care for human expectations.
Until higher highs and higher lows reassert themselves, until resistance becomes support, the idea of a renewed uptrend remains aspirational rather than empirical. To treat a moving average as predictive is to confuse the rearview mirror for the road ahead. It tells us what has been, not what will be. Yet traders persist in treating it as gospel, and then curse the market for their misplaced faith when the price does not comply.
A short term rally is likely to occur, as it often does when hysteria meets technical imbalance. But without confirmation of structure, such rallies are little more than reprieves, merciful pauses in an otherwise indifferent process of price discovery.
Ww
Disclaimer
=======================================================
This isn’t financial advice. If you’re making trades because a bloke on the internet wrote “death cross” in bold letters, you deserve every emotional rollercoaster that follows. I don’t care if you’re bullish, bearish, or just bored, or if you lose money, that’s not a “market manipulation conspiracy,” that’s just you being wrong.
Do your own research, manage your own risk, and please, for everyone’s sake, stop treating moving averages like they’re tarot cards.

SUI USDT LONG SIGNAL---
📢 Signal Alert
🔹 Pair: SUI / USDT
📈 Trade Type: Long
💰 Entry Zone: 2.0737 – 2.0310
🎯 Take-Profit Targets (Partial Management):
▫️ TP1 = 2.1080
▫️ TP2 = 2.1790
▫️ TP3 = 2.2180
▫️ TP4 = 2.3188
🛑 Stop-Loss: 1.9970
📊 Timeframe: 15m
⚖️ Risk/Reward Ratio: 3.24
📌 Suggested Leverage: 5x – 10x
⚠️ Capital management is mandatory.
💬 Please review the chart before entering the trade.
---
🧠 Technical Overview:
SUI is forming a bullish structure above the 2.00 key support, showing strength with higher lows and growing volume.
A breakout above 2.10 can confirm momentum toward the 2.17–2.21 zone.
RSI on the 15m chart is rising from mid-levels, and price is holding above EMA20 — both indicating bullish continuation potential.
---
⚙️ Trade Management Tips:
Take partial profit at TP1 and move SL to entry.
Trail stop-loss for TP2–TP4.
Avoid holding if candle closes below 1.9970.
---
⚠️ Disclaimer:
This signal is for educational purposes only and not financial advice.
Always perform your own analysis and apply strict risk management.
---

#SUI/USDT The Interesting part of the market#SUI
The price is moving in a descending channel on the 1-hour timeframe and is expected to break out and continue upwards.
We have a trend to stabilize above the 100-period moving average again.
We have a downtrend on the RSI indicator, which supports an upward move if it breaks above it.
We have a key support zone in green that pushed the price up to 1.93.
Entry price: 1.96
First target: 1.97
Second target: 2.02
Third target: 2.04
For risk management, don't forget your stop-loss and capital management.
The stop-loss is below the support zone in green.
Upon reaching the first target, take some profit and then change your stop-loss order to an entry order.
For any questions, please comment.
Thank you.

SUI USDT LONG SIGNAL---
📢 Signal Alert
🔹 Pair: SUI / USDT
📈 Trade Type: Long
💰 Entry Point: 2.1340
🎯 Take-Profit Targets (with partial exits):
TP1 = 2.1870
TP2 = 2.2259
TP3 = 2.2730
TP4 = 2.3170
🛑 Stop-Loss: 2.0900
📊 Timeframe: 15 Minutes
⚖️ Risk/Reward Ratio: 4.84
📌 Suggested Leverage: 5x – 10x
⚠️ Capital management is mandatory.
💬 Please review the chart carefully before entering the trade.
---
🧠 Technical Analysis Overview:
SUI is currently forming a bullish structure after a short consolidation phase. The price has bounced from the local support zone (around 2.09–2.13), showing renewed buy pressure and volume confirmation.
🔸 Key Notes:
Momentum indicators are turning upward, signaling early strength.
A breakout above 2.18 could confirm bullish continuation toward TP3–TP4.
Maintain tight stop management; move SL to entry after TP1 hit.
---
⚙️ Trade Management Tip:
Once TP1 is reached, secure partial profits and move Stop-Loss to breakeven.
Let remaining positions run toward higher targets.
---
⚠️ Disclaimer:
This signal is for educational and analysis purposes only.
Always perform your own research and apply strict risk management.
---

SUI Approaching Major Support – Long Spot OpportunitySUI has entered a key support zone between $1.82 – $1.96, a level that has historically shown strong demand. Price is consolidating near the upper end of this zone, which could indicate potential accumulation. If this level holds, it presents a solid opportunity for a long spot entry.
🔹 Entry Zone: $1.82 – $1.96
🔹 Stop Loss: Below $1.75
🔹 Take Profit Targets:
• TP1: $2.40 – $2.80
• TP2: $3.10 – $3.55
This setup offers a favorable risk-to-reward ratio, especially if volume and market momentum align with the bounce. Watch for bullish confirmation signals—such as strong candle closes or rising volume—within the support zone before entering. Always respect the stop loss to protect capital.

SUIUSDT 3D#SUI has formed a descending triangle pattern on the 3-day timeframe chart and is currently trading near the triangle support zone. In case of a bounce, the potential targets are:
🎯 $2.5133
🎯 $3.0057
If a breakout occurs above the triangle resistance, the next targets are:
🎯 $3.4037
🎯 $3.8017
🎯 $4.3683
🎯 $5.0900
⚠️ Always remember to use a tight stop-loss and maintain proper risk management.

SUIUSDTPrice reacted from the 1.8200 dollar support and entered a short-term correction but remains within the main descending channel. The bearish momentum is still dominant, and unless a candle closes above 2.2900 dollar, the price may retest lower zones near 1.5400 dollar. Fibonacci levels define the key horizontal supports and resistances in this setup.
BINANCE:SUIUSDT

SUI/USDT – Bearish Breakdown Ahead?📉 SUI/USDT – Bearish Breakdown Ahead?
SUI has broken below a key rising wedge structure on the 4H chart — a classic bearish continuation pattern.
The price is showing strong downside momentum, and further declines look likely.
After a possible short-term correction, a continuation toward the lower target zones remains probable.
Key Targets:
🎯 1.4910
🎯 1.0778
🎯 0.6202
You may find more details in the chart!
Thank you and Good Luck!
❤️PS: Please support with a like or comment if you find this analysis useful for your trading day❤️

SUI (Y23.P2.E1). Wave 3 to 4 in progressHi traders,
I do see a good opportunity to find a shorting position in the coming days or week\s.
This is a grind line for wave 4 and as soon a it breaks this prevailing support TL, its time to short.
The BAR strategy.
All the best,
S.SAri
