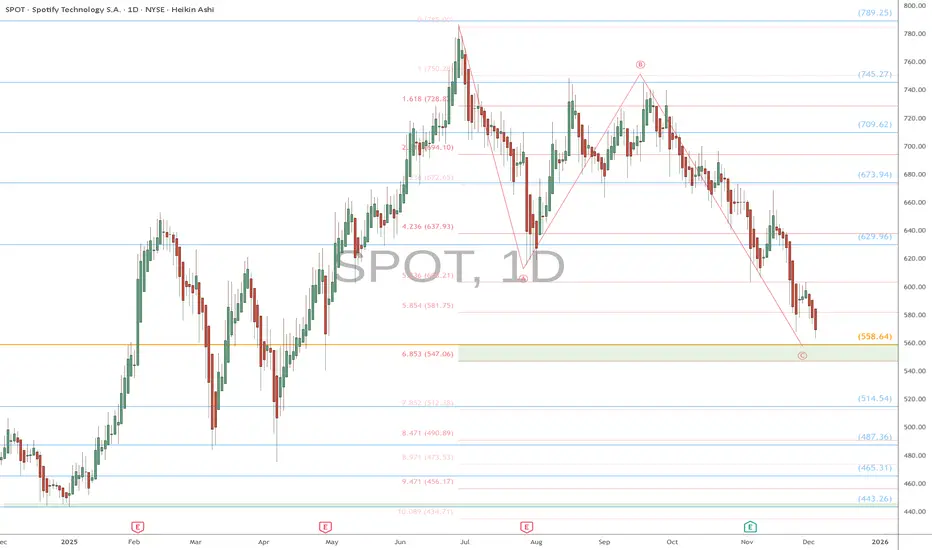
SPOT watch $547-558: Key support zone may end the ABC correctionSPOT correcting from its ATH several months ago.
About to test a key support zone at $547.06-558.64
Look for some consolidation there and then launch.
Spotify Technology SA
No trades
Key facts today
Next report date
—
Report period
—
EPS estimate
—
Revenue estimate
—
6.55 EUR
1.19 B EUR
16.38 B EUR
149.74 M
About Spotify Technology S.A.
Sector
Industry
CEO
Daniel Ek
Website
Headquarters
Luxembourg
Founded
2006
ISIN
LU1778762911
FIGI
BBG00KBGHTZ7
Spotify Technology SA engages in the provision of digital music services. It operates through the Premium and Ad-Supported segments. The Premium segment provides subscribers with online and offline streaming access of music and podcasts on computers, tablets, and mobile devices. The Ad-Supported segment offers users with limited on-demand online access of music and unlimited online access of podcasts on computers, tablets, and mobile and smart devices. The company was founded by Daniel Ek and Martin Lorentzon on December 27, 2006 and is headquartered in Luxembourg.
Related stocks
Spotify: A strong price appreciation you can't afford to ignoreHello,
Spotify Technology SA has matured into the world’s dominant digital music platform, giving users instant access to a vast universe of music, podcasts, and increasingly, audiobooks. Its business runs through two engines: Premium subscriptions and an Ad-Supported tier. Premium subscribers enjo


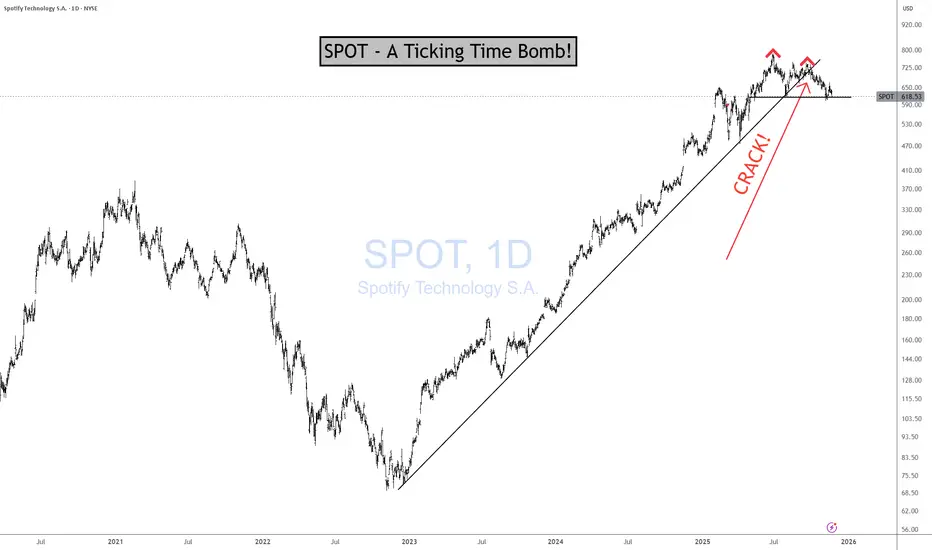
SPOT - A Ticking Time Bomb!SPOT Earnings Yield of 1.3% according to current data — meaning you’re getting about 1.3 cents of profit per dollar invested. LOL!
Better you give me your hard-earned money and I'll give you 2% instead of 1.3%. I like to splurge! :)
The Structural Constraint
Spotify cannot scale margins the way N
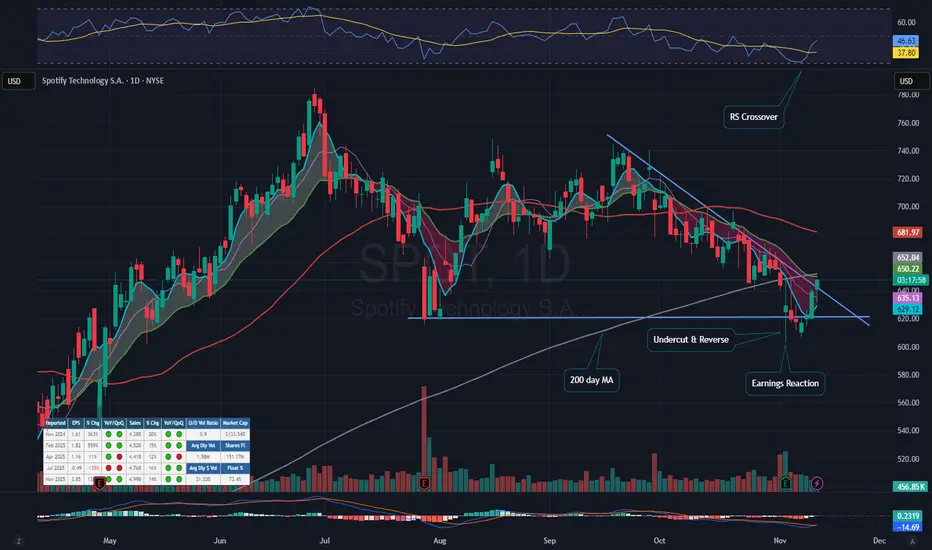
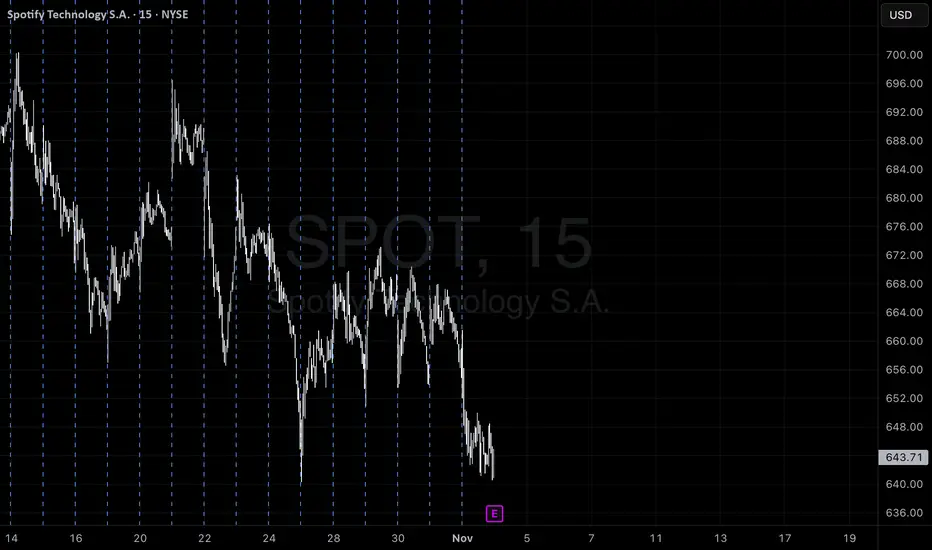
$SPOT Earnings Report and Technical Analysis OverviewSPOT Delayed Earnings Move
Earnings Report Summary
On the morning of November 4, 2025, Spotify Technology S.A. (SPOT) announced its earnings results for the third quarter, surpassing market expectations. The company reported earnings of $3.83 per share, notably higher than the consensus estimate
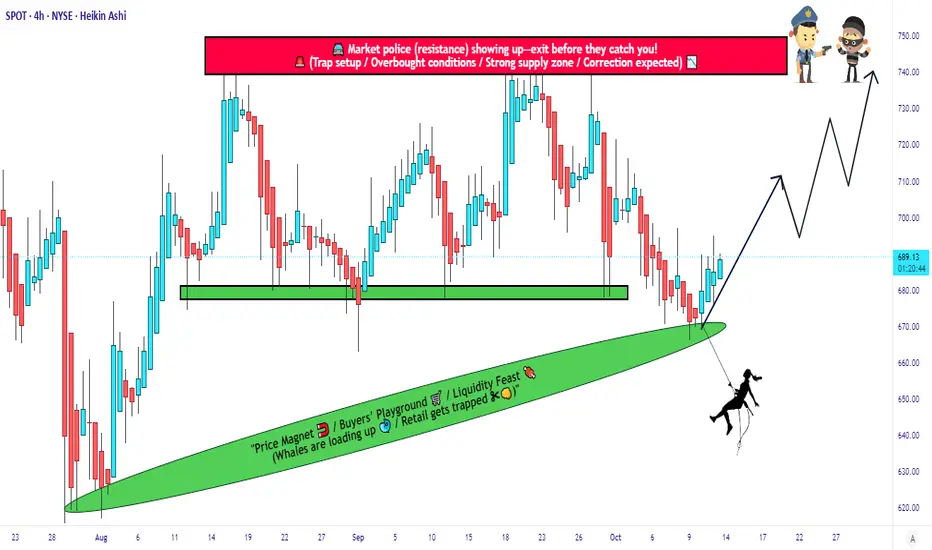
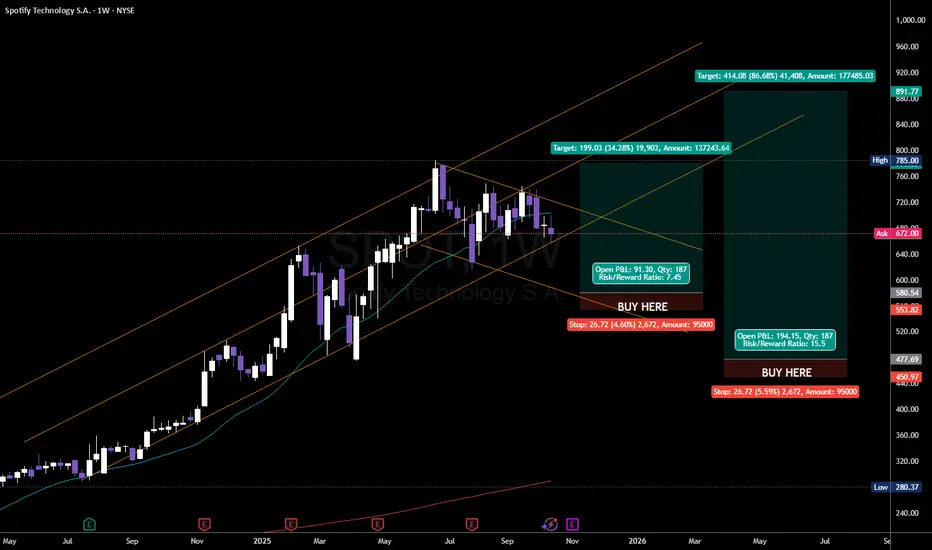
SPOT Price Action | Strong Support, Tight Stop, Open Target!🎧 SPOT | Thief Trader Profit Playbook 💰
“When Music Meets Money — Spotify’s Chart Is About to Drop Beats & Gains!” 🎵📈
🧭 Plan:
Bullish Bias — Thief-style layered accumulation for a smart entry!
We’re eyeing SPOT (Spotify Technology S.A.) for a potential swing/day trade move north.
🎯 Entry (Layering
SPOT QuantSignals V3 Earnings 2025-11-03SPOT QuantSignals V3 Earnings 2025-11-03
SPOT Earnings Signal | 2025-11-03
• Direction: BUY PUTS | Confidence: 60%
• Entry Plan: Pre Earnings Close | Expiry 2025-11-07
• Strike Focus: $572.50
• Entry Range: $5.50
• Target 1: $11.00
• Stop Loss: $3.30
• Implied Move: $63.73 (9.9%)
• 24h Move: -2.99%
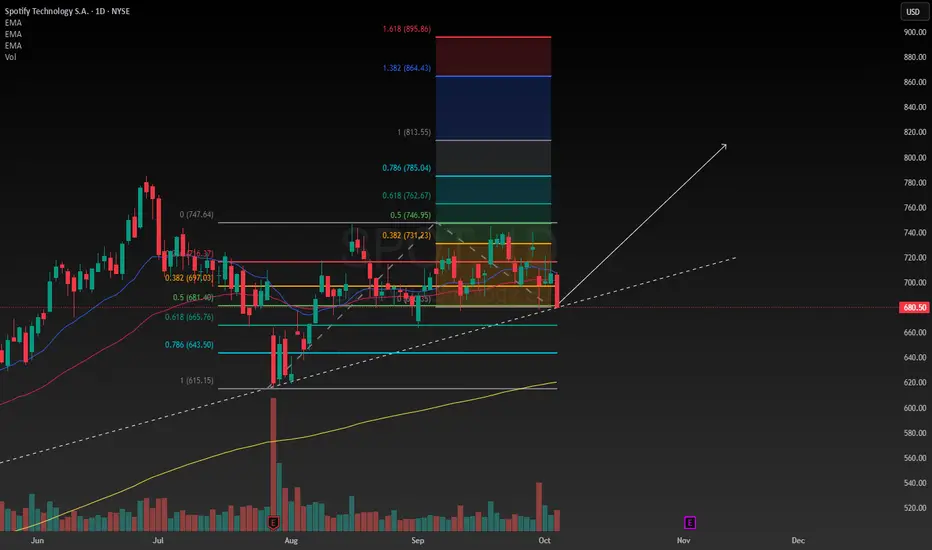
top in on SPOTWE HAVEN'T Seen any major correction since 2022 with a run of over 800% a correction wouldn't be surprising . ABC correction looks to be in play to invalidate i would like to see a bounce to 730.00 otherwise we should expect a 22% correction also we are starting to break a significant trend line.

Leading Audio Streaming Innovator Capturing Global Market: BUYBuy Reason: Spotify’s leadership in audio streaming combined with diverse content offerings and expanding user base drives growth potential. Its investments in podcasting and AI-driven personalization offer future revenue streams and competitive edge.
Why I like Spotify stockI'm going to explain the reason I believe Spotify is a good investment, there's a few reasons. I'm basically using Spotify as a defensive anchor in my portfolio. First I'm going to explain the fundamentals, and the formula for this never changes. The discounted cash flow model, is a mathematical for
See all ideas
Summarizing what the indicators are suggesting.
Neutral
SellBuy
Strong sellStrong buy
Strong sellSellNeutralBuyStrong buy
Neutral
SellBuy
Strong sellStrong buy
Strong sellSellNeutralBuyStrong buy
Neutral
SellBuy
Strong sellStrong buy
Strong sellSellNeutralBuyStrong buy
An aggregate view of professional's ratings.
Neutral
SellBuy
Strong sellStrong buy
Strong sellSellNeutralBuyStrong buy
Neutral
SellBuy
Strong sellStrong buy
Strong sellSellNeutralBuyStrong buy
Neutral
SellBuy
Strong sellStrong buy
Strong sellSellNeutralBuyStrong buy
Displays a symbol's price movements over previous years to identify recurring trends.
Curated watchlists where 639 is featured.


Frequently Asked Questions
The current price of 639 is 505.20 EUR — it has increased by 2.82% in the past 24 hours. Watch Spotify Technology SA stock price performance more closely on the chart.
Depending on the exchange, the stock ticker may vary. For instance, on SWB exchange Spotify Technology SA stocks are traded under the ticker 639.
639 stock has risen by 2.25% compared to the previous week, the month change is a −5.92% fall, over the last year Spotify Technology SA has showed a 11.12% increase.
We've gathered analysts' opinions on Spotify Technology SA future price: according to them, 639 price has a max estimate of 783.15 EUR and a min estimate of 456.84 EUR. Watch 639 chart and read a more detailed Spotify Technology SA stock forecast: see what analysts think of Spotify Technology SA and suggest that you do with its stocks.
639 stock is 2.74% volatile and has beta coefficient of 1.23. Track Spotify Technology SA stock price on the chart and check out the list of the most volatile stocks — is Spotify Technology SA there?
Today Spotify Technology SA has the market capitalization of 104.42 B, it has decreased by −0.88% over the last week.
Yes, you can track Spotify Technology SA financials in yearly and quarterly reports right on TradingView.
Spotify Technology SA is going to release the next earnings report on Feb 10, 2026. Keep track of upcoming events with our Earnings Calendar.
639 earnings for the last quarter are 3.28 EUR per share, whereas the estimation was 1.96 EUR resulting in a 67.74% surprise. The estimated earnings for the next quarter are 2.67 EUR per share. See more details about Spotify Technology SA earnings.
Spotify Technology SA revenue for the last quarter amounts to 4.27 B EUR, despite the estimated figure of 4.23 B EUR. In the next quarter, revenue is expected to reach 4.52 B EUR.
639 net income for the last quarter is 895.25 M EUR, while the quarter before that showed −82.81 M EUR of net income which accounts for 1.18 K% change. Track more Spotify Technology SA financial stats to get the full picture.
No, 639 doesn't pay any dividends to its shareholders. But don't worry, we've prepared a list of high-dividend stocks for you.
EBITDA measures a company's operating performance, its growth signifies an improvement in the efficiency of a company. Spotify Technology SA EBITDA is 1.96 B EUR, and current EBITDA margin is 9.76%. See more stats in Spotify Technology SA financial statements.
Like other stocks, 639 shares are traded on stock exchanges, e.g. Nasdaq, Nyse, Euronext, and the easiest way to buy them is through an online stock broker. To do this, you need to open an account and follow a broker's procedures, then start trading. You can trade Spotify Technology SA stock right from TradingView charts — choose your broker and connect to your account.
Investing in stocks requires a comprehensive research: you should carefully study all the available data, e.g. company's financials, related news, and its technical analysis. So Spotify Technology SA technincal analysis shows the sell today, and its 1 week rating is neutral. Since market conditions are prone to changes, it's worth looking a bit further into the future — according to the 1 month rating Spotify Technology SA stock shows the neutral signal. See more of Spotify Technology SA technicals for a more comprehensive analysis.
If you're still not sure, try looking for inspiration in our curated watchlists.
If you're still not sure, try looking for inspiration in our curated watchlists.