Alphabet - This rally will soon be over!🪦Alphabet ( NASDAQ:GOOG ) will end its rally soon:
🔎Analysis summary:
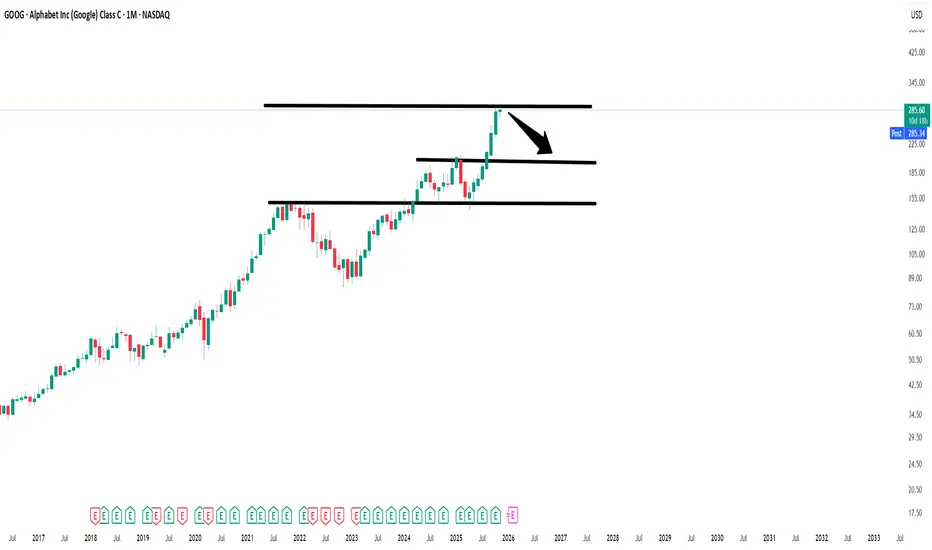
Starting back in 2025, Alphabet created a major bullish break and retest. Following this behavior, we witnessed an expected strong rally of about +120%. But with the current retest of the upper resistance trendline, Alphabet will soon create a healthy retracement.
📝Levels to watch:
$300
SwingTraderPhil
SwingTrading.Simplified. | Investing.Simplified. | #LONGTERMVISION
Trade ideas

GOOG - From Erections Come CorrectionsAnytime you get an erection, move like this on a chart, rest assured, a correction is right around the corner.
Buffet's purchase of 1% of his cash holdings does not justify hundreds of billions in market capitalization gains.
GOOG has now exploded 53% since Sept. if you were long. GREAT! Take your profits and run! If you are chasing, you will ultimately get burned.
Remember, no matter where the price goes, you are always 100% from ZERO!
I will be the first to tell you that the most & easiest profits are always made at the tops of markets. When everyone and their grandmother is bullish! Therein is the problem! TOP!
GTFO and STFO!
THANK YOU for getting me to 5,000 followers! 🙏🔥
Let’s keep climbing.
If you enjoy the work:
👉 Boost
👉 Follow
👉 Drop a solid comment
Let’s push it to 6,000 and keep building a community grounded in truth, not hype.

Google at record highs but Wave 3 cluster/RSI screams pullback!Alphabet is leading the Magnificent Seven, hitting record highs near $330, while most AI and growth stocks, including Nvidia, have stalled. Since launching Gemini 3 in mid-November and with news of a $4.9 billion Berkshire stake, Alphabet has rallied more than 135% off its April low, outperforming all Big Tech peers in 2025.
But Alphabet is at the 161.8% Fibonacci extension of its long-term move and long-to-medium-term move, which matches a textbook Elliott Wave 3 cluster completion. RSI is at an extreme 83 on the weekly, hinting a Wave 4 pullback to $288 could be next, even as the macro backdrop (Gemini 3 AI buzz, Fed rate cut hopes, and demand for Google’s AI chips from Meta) stays strong. Ultimately, a final Wave 5 could extend up to $380-$400.
Key drivers:
Gemini 3 launch positions Alphabet as an AI leader, topping major multimodal benchmarks.
$4.9B Berkshire stake signals major institutional confidence.
Meta seeks Google’s TPU chips, boosting Alphabet’s AI hardware story while pressuring Nvidia.
Fed rate cut odds above 80% further support growth stocks.
Elliott Wave/technical structure aligns with a potential $288 pullback before any push to $380.
Will Alphabet finally pause after eight explosive months, or does the rally have further to run?
Let us know your view and Elliott Wave count in the comments, and follow for more big-picture, technical-plus-macro trade ideas!
This content is not directed to residents of the EU or UK. Any opinions, news, research, analyses, prices or other information contained on this website is provided as general market commentary and does not constitute investment advice. ThinkMarkets will not accept liability for any loss or damage including, without limitation, to any loss of profit which may arise directly or indirectly from use of or reliance on such information.

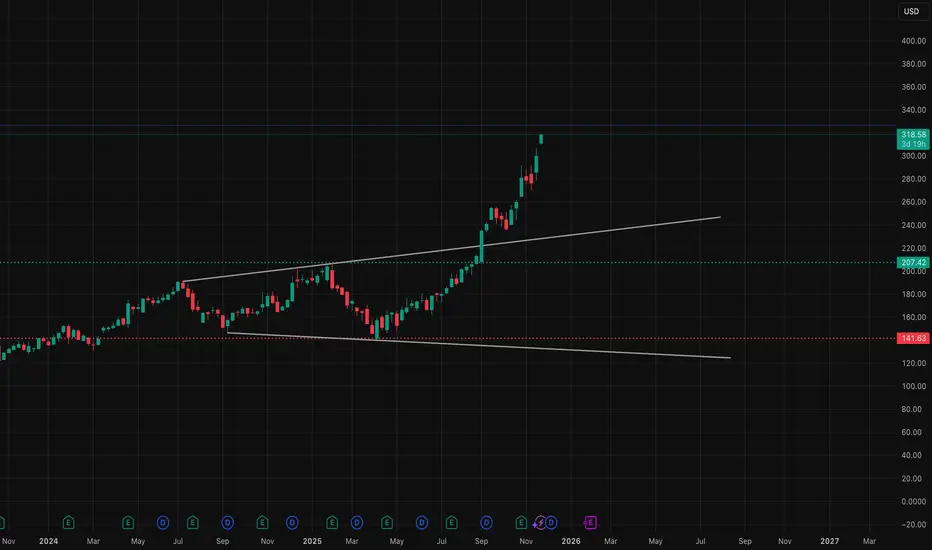
Google - A major correction starts now!🚽Google ( NASDAQ:GOOGL ) is now creating a top:
🔎Analysis summary:
Over the course of the past couple of months, we witnessed a major rally on Google of about +100%. This rally was totally expected, following the underlying bullish rising channel. But with the current retest of the trendline, Google is heading for a major correction.
📝Levels to watch:
$300 and $200
SwingTraderPhil
SwingTrading.Simplified. | Investing.Simplified. | #LONGTERMVISION

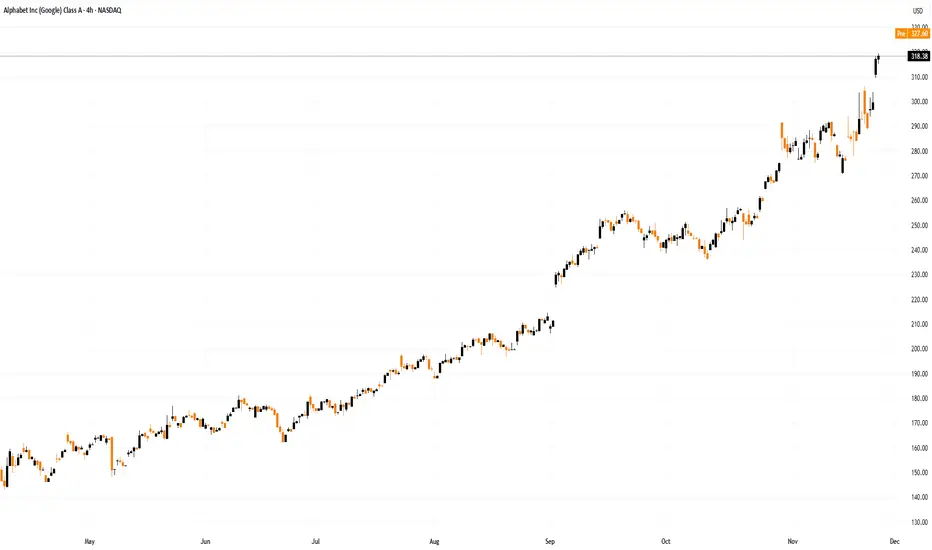
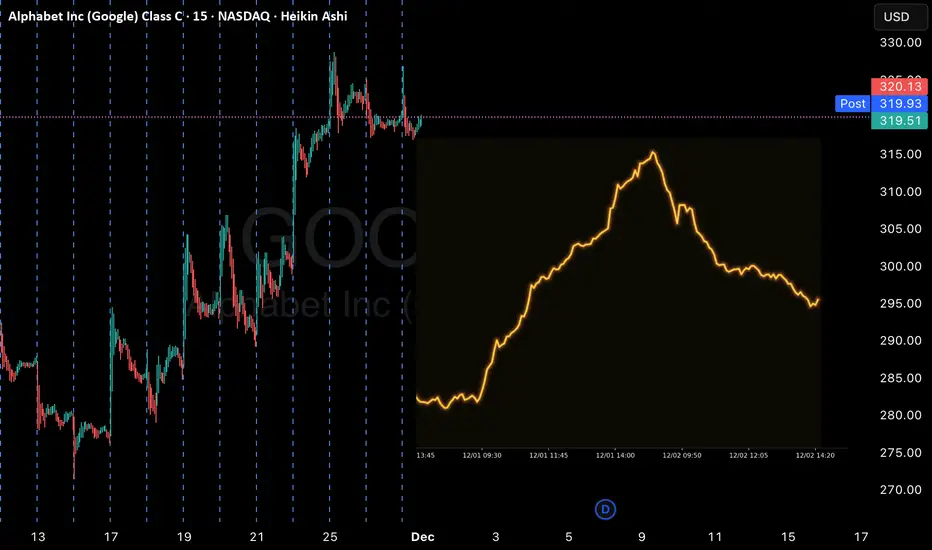
Alphabet (GOOGL) Shares Close Above $300 for the First TimeAlphabet (GOOGL) Shares Close Above $300 for the First Time
Charts show that Alphabet (GOOGL) shares have reached a record high, closing around $318. In doing so:
→ the price has surpassed the psychological $300 mark;
→ the stock has gained roughly 70% since the start of the year;
→ Larry Page has become the world’s second-richest person, after Elon Musk.
Why Have Alphabet Shares Risen?
The surge is explained by several factors, the most significant being news of strong performance in tests of the AI model Gemini, upgraded to version 3.0. In many benchmarks, it outperformed ChatGPT.
The rise in GOOGL’s share price seems to signal a shift in leadership in the “best AI” race — which could translate into higher sales of paid Gemini versions and increased revenue for Alphabet, which already exceeds analyst expectations, as confirmed by the report released in late October.
Technical Analysis of GOOGL Shares
Price movements have formed an ascending channel (shown in blue), originating in the summer of this year. Along the way, the price recently encountered resistance around:
→ $290: acting as a barrier following the earnings release;
→ $300: a psychological hurdle, as investors were hesitant to pay over three hundred dollars per share.
These levels had kept the price in the lower half of the channel. Now, with GOOGL’s fundamentals strengthened, the stock has reached the channel’s median — typically a point where supply and demand balance. It is reasonable to assume that:
→ the bullish momentum may begin to ease;
→ in the event of a correction, the $290–300 zone may shift roles to act as support, reinforced by the channel’s lower boundary.
This article represents the opinion of the Companies operating under the FXOpen brand only. It is not to be construed as an offer, solicitation, or recommendation with respect to products and services provided by the Companies operating under the FXOpen brand, nor is it to be considered financial advice.
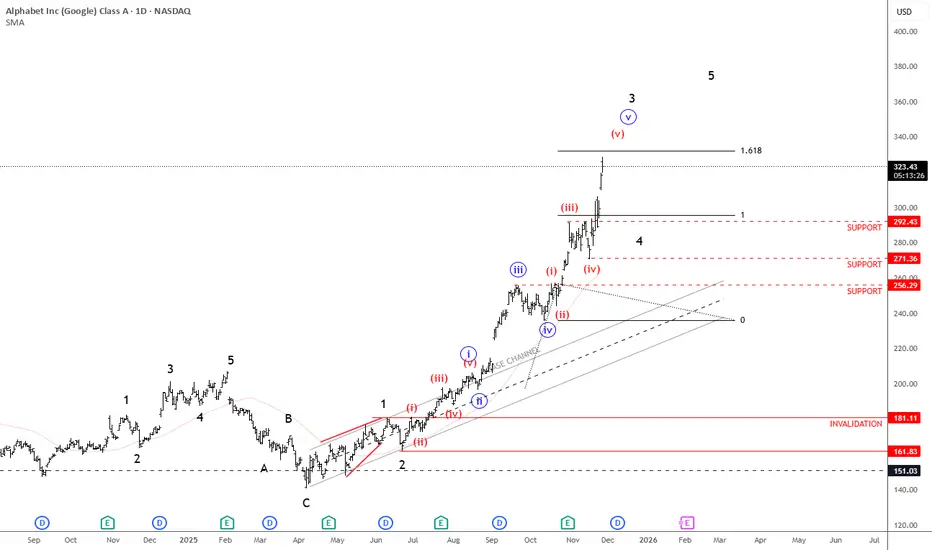
Google Is In Strong Bullish Trend; Unfolding A Five-Wave ImpulseAlphabet (Google) is a huge tech company best known for its search engine, but it also makes things like Android, YouTube, Gmail, and cloud services. Google is pushing hard into AI and cloud computing. They’re rebuilding search with AI, making stronger chips, and growing Google Cloud fast. They’re also investing in long-term tech like self-driving cars and quantum computing.
Google is in a very strong uptrend as expected, but we can now count five waves up within the black wave three cycle from around 160. Ideally, the next pullback would be wave four, stabilizing near the previous fourth-wave area around 292–271. And once or if we see that kind of correction, that's when new buying opportunities could appear, but for now, it’s better to stay cautious since we may already be in the later stages of this cycle.
Highlights:
Trend: Strong uptrend, but nearing late stages of wave three
Potential: Pullback in wave four before continuation higher
Support: 292–271 zone
Invalidation: Below 200
Note: watch for a correction before new long setups
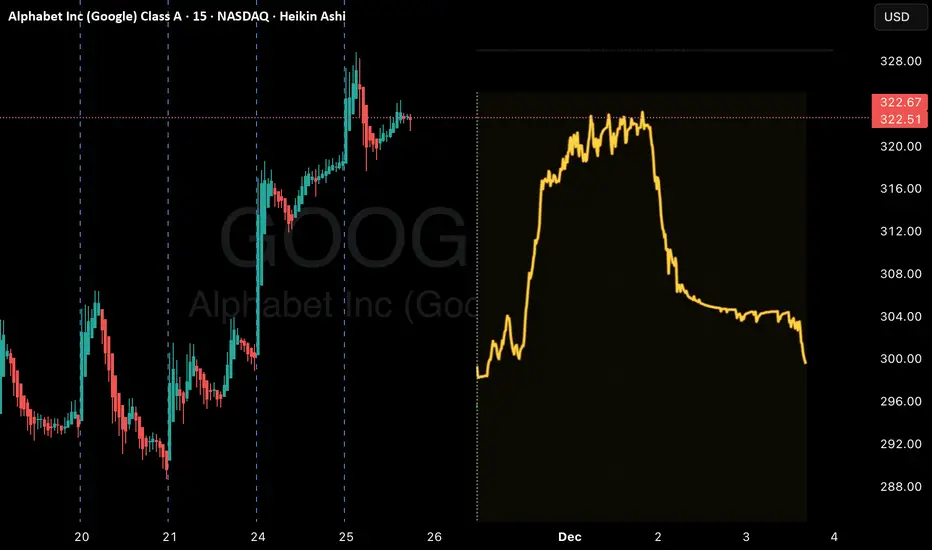
GOOGL watch $313-316: Major Resistance zone could mark a TOPGOOGL has been flying high on the success of Gemini.
Just hit a major resistance zone at $313.21-316.33
Looking for a Dip-to-Fib like $294.08 or below to buy.

Alphabet Momentum Surges as Berkshire’s Bet $5 billion stakeAlphabet Inc. (NASDAQ: NASDAQ:GOOG ) closed at $299.65 on Friday and briefly pushed above $302 in after-hours trading, extending its strong 2025 rally. The momentum accelerated after Berkshire Hathaway revealed a new $5 billion stake, making Alphabet one of its largest U.S. holdings. The move reinforces investor conviction in Alphabet’s long-term AI roadmap, especially as capital expenditures surge.
Alphabet’s Q3 earnings on Oct. 29 highlighted the company’s powerful growth engine. Revenue rose 16% year over year to $102.3 billion, while net income increased 33% to $35 billion. EPS jumped 35% to $2.87 as operating efficiency improved across Google Services and Cloud.
Google Cloud delivered another breakthrough quarter, generating 34% growth and $15.2 billion in revenue. The segment continues to benefit from rising AI workloads and enterprise adoption. YouTube and Search also outperformed, driving strong ad-based revenue expansion.
Capital expenditures remain a key theme. Alphabet raised its 2025 CAPEX outlook twice, now guiding for $91–$93 billion, driven by AI chips, new data centers, and expanded compute clusters. Despite heavy investment, free cash flow remains exceptionally strong at $73.6B over the last 12 months.
Berkshire’s Vote of Confidence
Berkshire’s acquisition of 17.9 million GOOG shares signals deep belief in Alphabet’s AI dominance and multi-segment strength. With nearly $100B in cash and consistent double-digit revenue growth, Alphabet remains one of the most financially resilient companies in big tech.
Technical Outlook
NASDAQ:GOOG has been strongly bullish since the April low at $140. The stock also broke through an ascending-trendline resistance in August and continues to climb toward new all-time highs. As long as price stays above this breakout zone, bullish continuation remains likely.

GOOGL Breaking Out Again? Key Levels This WeekWeekly timeframe:
GOOGL is in one of the strongest momentum runs in the market right now. Price just pushed above the previous weekly resistance around 315 and is now trading in open space with very little historical supply until the 325–330 zone. The weekly structure is still a clean higher-high, higher-low sequence with strong trend continuation. As long as price holds above 295, this weekly bullish trend remains intact. The only concern here is the speed of the move — this candle is extended and approaching the upper channel line, which often leads to a short-term pullback before continuation.
Daily timeframe:
The daily chart shows a clear breakout from the rising channel after a BOS move and retest. Buyers defended the 300 area multiple times, creating a strong demand zone below. Current price is sitting inside a small supply zone around 320–327, which has potential to reject short-term, especially after a fast run. If buyers maintain control above 310, continuation toward 330 is likely. A rejection back under 310 opens the door toward 300–295 demand for a healthier pullback.
1-hour timeframe:
Short-term momentum still favors upside, but price looks stretched. The last push created a BOS into supply, and volume is slowing. If 315 holds as intraday support, we could see another attempt toward 325–330. If 315 fails, watch 310 first, then 305 for deeper retracement levels.
GEX sentiment:
Options positioning is supporting the bullish scenario. The highest positive GEX levels sit around 320–330, acting as a magnet. Below, the strongest put support sits near 295. This creates a favored range between 310 and 325 for the short term. As long as price stays above 310, market makers have incentive to keep price elevated.
My thoughts:
GOOGL remains one of the cleanest trending names right now. The weekly structure suggests continuation, but the lower timeframes show exhaustion. Best opportunities likely come from pullbacks rather than chasing highs. Watching for either a breakout retest above 320 or a dip toward 310 for a higher low setup.
Conclusion:
Bullish overall trend
Upside target 325–330
Support zone 310–305
Major support 295
Disclaimer:
This analysis is for educational purposes only and does not constitute financial advice. Always do your own research and manage your risk before trading.
GOOGL skyrocketed with the launch of Gemini 3
The new LLM model, Gemini 3, unveiled last week, has garnered positive reviews. Salesforce founder Benioff, who used ChatGPT daily for three years, stated that after using Gemini 3 for about two hours, he has no intention of returning to ChatGPT. Google's share of the AI market has significantly increased, rising from 23.4% before the launch of Gemini to 30.1% afterward.
Altman is also wary of Gemini. Referring to Google's recent AI achievements, he acknowledged that the internal atmosphere at his company might be uneasy for some time and that Google could present a temporary economic headwind to the firm.
GOOGL maintains its steep uptrend, approaching the ascending channel’s upper bound and the resistance at 320.00. Diverging bullish EMAs point to a potential uptrend extension.
If GOOGL breaches above the channel's upper bound and 320.00, the price may advance toward the new high and psychological resistance at 330.00.
Conversely, if GOOGL fails to close above 320.00, the price may temporarily retreat toward the following support at 300.00.

Alphabet (NASDAQ: $GOOGL) Stock: 2025 Continues BullishAlphabet’s stock continues its remarkable performance in 2025, surging nearly 70% year-to-date as strong fundamentals and aggressive AI expansion fuel investor confidence. Much of the momentum comes from Alphabet’s rapidly growing cloud division and the continued rollout of Gemini, its advanced AI model powering enterprise workloads, search upgrades, and next-generation productivity tools. This expansion has pushed Alphabet’s market valuation close to $4 trillion, establishing it as one of the fastest-growing mega-caps this year.
Another major catalyst is Google’s deepening presence in India’s digital infrastructure. The Adani Group recently announced a $5 billion co-investment with Google to build a large-scale data center aimed at supporting India’s rising cloud, AI, and storage needs. This move comes shortly after Google committed $15 billion to an AI-focused data center cluster in Andhra Pradesh. Together, these investments reinforce Alphabet’s expanding footprint across one of the world’s fastest-growing markets and strengthen long-term revenue prospects.
From a technical standpoint, GOOGL remains strongly bullish after breaking above a long-held ascending trendline that acted as multi-year resistance. The breakout triggered a sharp rally, pushing the stock to the current price around $320. Momentum indicators show extreme strength, with the MACD at record highs and RSI firmly overbought—signals that suggest the uptrend remains intact but may face volatility.
The next psychological resistance sits at $350, a level traders will watch closely. On the downside, immediate support lies at $291, followed by a stronger structural zone at $255. As long as price stays above the former trendline and these supports, the broader bullish structure remains dominant.

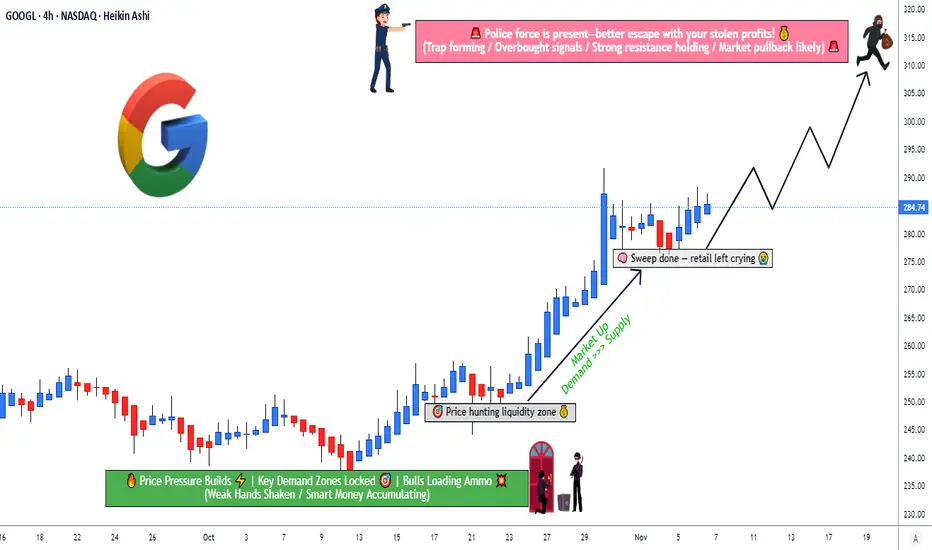
Can GOOGL Sustain Its Bullish Run Before 320 Resistance Hits?🎯 GOOGL HEIST: Operation Alphabet Escape Plan 💰
Alphabet Inc. (NASDAQ) - Swing Trade | Multi-Layer Entry Strategy
📊 THE SETUP
Sentiment: 🟢 BULLISH | Timeframe: Swing Trade | Risk Level: Medium
🎲 ENTRY STRATEGY: "THIEF LAYERING"
Strategic multi-level buy accumulation using limit orders
Layer-by-Layer Approach:
🔵 Layer 1: $270.00 (Initial entry - 30% position)
🔵 Layer 2: $275.00 (Support zone - 35% position)
🔵 Layer 3: $280.00 (Strength builder - 35% position)
Why This Works? Multiple entries reduce average cost basis and allow maximum capital efficiency. If price rejects higher, you've got fills at lower zones. If it pumps, you're already in! 💡
🛑 STOP LOSS PROTECTION
Hard Stop: 🚨 $265.00 (Below support structure)
This represents a 1.9% risk from Layer 1 entry — disciplined risk management at its finest.
⚠️ Risk Acknowledgment: Your stop loss, your rules. We're traders, not financial advisors. Adjust based on YOUR risk tolerance and account size. This is educational strategy sharing, not personalized financial advice.
🎖️ PROFIT TARGETS & ESCAPE ROUTES
Primary Target: 📈 $310.00
Strong resistance zone forming
Overbought conditions developing
Action: Take 50-60% profits here
Secondary Target: 🏆 $320.00
Police barricade zone (extreme resistance)
High trap probability at this level
Action: Scale out remaining 40-50% OR tighten stops to breakeven
Exit Philosophy: Greed kills traders. Take profits systematically. The best trade is one where you sleep well at night. 😴
⚠️ Profit Note: Your targets, your timing. Scale exits based on market conditions, volume confirmation, and YOUR comfort level.
🔗 RELATED PAIRS TO MONITOR (Correlation Watch)
🔵 NASDAQ:MSFT 📱 — High Correlation (Tech Sector) | If MSFT breaks down, GOOGL faces sector headwinds. Watch for divergence signals here first.
🔵 NASDAQ:QQQ 🔺 — 0.85+ Correlation (Nasdaq-100) | QQQ weakness = potential GOOGL pullback signal. This is your sector health check before entry.
🔵 AMEX:IWM 📊 — Inverse Correlation (Rotation Risk) | Russell 2000 strength = growth money leaving mega-caps. If small-caps pump, tech might cool off.
🔵 NASDAQ:TLT 💳 — Interest Rate Proxy | Rising bonds = tech pressure; falling bonds = tech friendly. Fed policy flows directly through here.
🔵 TVC:VIX 😰 — Volatility Index | VIX spike = risk-off, potential GOOGL liquidation. Above 20 = reduce position exposure.
Key Insight: Watch QQQ and MSFT first. They're your canary in the coal mine. If sector is weak, reconsider your entry conviction. 🚨
💎 STRATEGY SUMMARY
✅ Bullish bias with disciplined multi-entry accumulation
✅ Defined risk with hard stop at $265
✅ Staged profit-taking to lock gains systematically
✅ Correlation awareness prevents surprise sector rotations
🎬 FINAL THOUGHTS
Remember: This is the Thief Strategy™ — a fun, educational framework for swing trading, NOT financial advice. Trade at your own risk. Position sizing, stop losses, and profit targets should reflect YOUR unique situation, risk tolerance, and account size.
The heist only works if you ESCAPE with profits. Don't get caught holding the bag! 💼🚪
✨ If you find value in my analysis, a 👍 and 🚀 boost is much appreciated — it helps me share more setups with the community!
#GOOGL #AlphabetInc #SwingTrade #TechAnalysis #TradingStrategy #NASDAQ #TradingIdeas #MultiLayers #RiskManagement #Bullish #ThiefStrategy #TradingCommunity #TradingView #Technical #StockMarket
GOOG Weekly CALL Alert — Early-Week Momentum Play ActivatedGOOG QuantSignals V3 — Weekly Signal (2025-11-28)
Expiry: 2025-12-05 (7 Days)
Instrument: GOOG
Current Price: $319.97
Direction: CALL (LONG)
Confidence: 60% (Medium)
Risk Level: ⚠️ MODERATE
📈 Signal Details
Strike Focus: $320.00 (ATM, 0.513 Delta)
Entry Range: $5.60 – $5.70 (mid $5.65)
Target 1: $9.04 (+60%)
Target 2: $12.43 (+120%)
Stop Loss: $2.83 (-50%)
Position Size: 2% of portfolio
🧠 Katy AI Analysis
Predicted Move: $319.97 → $333.48 (+4.22%) by Dec 1 afternoon
Trend: Bullish momentum building despite initial NEUTRAL label
Sustained Levels: Above $325 through Dec 2
Time Series: Clear gradual upward trajectory
AI Confidence: 60%
📊 Technical & Market Context
Weekly Momentum: +0.33% (Neutral)
Weekly Range Position: 90.2% high
VWAP: $321.97 (resistance)
Support: $315.17 (stop loss)
Resistance: $325 – $330 zone
MACD: Bullish confirmation
News Sentiment: Mixed tech headlines, AI bubble concerns, potential oversold bounce
Options Flow: Neutral PCR 1.00; unusual activity at $175 put is protective hedging
Gamma Risk: Low
⚡ Trade Setup & Strategy
Why This Trade: Katy AI reveals bullish momentum not captured in NEUTRAL summary
Timing Advantage: Entry near weekly high → early-week upside capture
Risk Mitigation: Tight 50% stop, balanced delta selection reduces gamma risk
GOOGL Long Alert: Katy AI Projects Upward Push AheadGOOGL QuantSignals Katy 1M Prediction 2025-11-25
Direction: LONG
Entry Price: ~$322.51
Target: ~$323.93
Stop Loss: ~$317.67
Confidence: ~55%
Trend: Neutral-to-slightly bullish
Volatility Estimate: ~24.1%
📊 TradingView Insights & Technical Context
According to recent Trade Ideas on TradingView:
GOOGL broke above a long-term ascending trendline resistance, which signals structural bullishness.
TradingView
+1
Some analysts highlight key resistance zones around $313–316 (or higher depending on update) and support around the $300 mark.
TradingView
+1
On the chart: price is in a consolidation/accumulation phase after previous strong trends. Some analyses suggest this phase precedes the next leg higher if key levels hold.
TradingView
+1
Fundamental driver: The company continues investing heavily in AI, cloud, infrastructure which supports the bullish narrative. (Though this is general market commentary, not specific to the trade setup).
⚠️ Risks & Considerations
Trend is labelled “Neutral” in your summary, so upside is modest. The target (~$323.93) is only ~0.5% above the entry — means limited upside relative to potential risk.
The quoted volatility (~24.1%) suggests the stock could move significantly, both up and down, so managing stop-loss is key.
Market technicals hint at major resistance zones; if the stock fails to clear them the upside could stall.
Even strong fundamentals don’t guarantee short-term movement especially when the trend is neutral or the trade horizon is short.
🧭 Why the Title Works
“Long Alert” is appropriate given the bullish bias, albeit moderate.
“Katy AI Projects Upward Push Ahead” links the trade to your AI-driven signal model (Katy AI) which adds thematic weight.
How to Use Simple Moving Averages (SMA) to Predict Price TargetsIn this video, you’ll learn exactly how to use the Simple Moving Average (SMA) to find both short-term and long-term price targets.
I explain which SMA settings work best, how to spot trend direction, and most importantly:
When you should take a trade and when you should stay OUT of the market to avoid losses.
What You’ll Learn:
How the Simple Moving Average works (SMA 9, 21, 50)
How to use SMA for short-term and long-term price targets
Best SMA crossover strategies
When to enter a trade using SMA
When to stop trading / avoid traps
How institutions use SMA to set levels
Tips to improve your accuracy and timing

Got Microcaps?Sure the market is whipsawing up and down, the VIX is comparatively high, and the Head and Shoulders pattern on Bitcoin and SPY looms large. But... have you checked out IWC, the ETF that tracks an index of microcap stocks? They have performed in line with other indexes, but today this ETF is up two and a half percent, while QQQ and SPY are plodding higher at less than one percent.
Looking for setups on small caps and micro caps might be a worthwhile addition to your trading tactics from now until the end of the year.
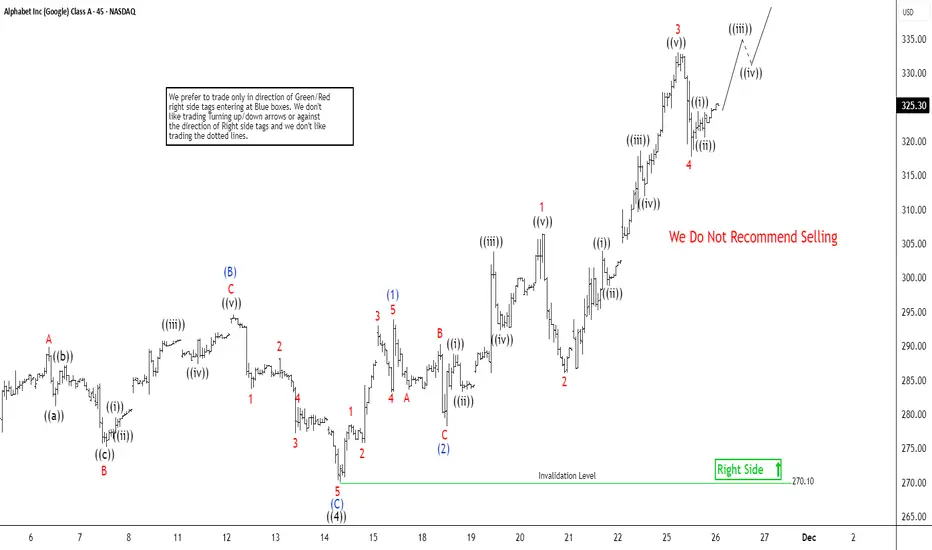
Google Stock (GOOGL) Approaches Historic Peak, $336 in SightThe short-term Elliott Wave view in Google (GOOGL) indicates that the stock is progressing within the final wave ((5)) of the impulsive rally that began from the April 2025 low. Wave ((4)) of this sequence concluded at $270.1, as reflected in the 45-minute chart. Following that completion, the stock resumed its advance toward new all-time highs, unfolding wave ((5)) as a five-wave impulse of lesser degree. From the termination of wave ((4)), wave (1) reached $293.95, while the corrective pullback in wave (2) settled at $278.2. The structure then nested higher into wave (3), reinforcing the bullish momentum.
From wave (2), wave 1 advanced to $306.42, followed by a modest dip in wave 2 that ended at $286.05. The third wave extended strongly, culminating at $332.98, before a corrective decline in wave 4 brought prices down to $317.65. The expectation now is for the stock to extend higher once more, completing wave 5 and thereby finalizing wave (3) of the larger degree. Afterward, a corrective phase in wave (4) should emerge, setting the stage for another rally in wave (5). This final advance would complete wave ((5)) and the broader cycle from the April 2025 low.
In the near term, as long as the pivotal support at $270.1 remains intact, dips are anticipated to find support within the typical three, seven, or eleven swing corrective structures. This suggests that the broader outlook continues to favor further upside, with each corrective phase offering opportunities for continuation of the bullish trend.
W. BUFFETT GOES 'GOOGLE'. DOES IT WORTH TO FOLLOW HIM AT PEAKSWarren Buffett has recently led Berkshire Hathaway to buy around $5 billion in Alphabet stock NASDAQ:GOOGL during the third quarter of 2025, making Alphabet one of Berkshire’s top ten holdings and sparking renewed interest in whether following Buffett’s move makes sense at today’s stock highs.
Technical Analysis
Alphabet is currently in a well-defined uptrend, with its price above short-term moving averages and an RSI near 60, indicating bullish momentum but no overbought signals.
Price action shows consolidation near highs (around $283–$290), pointing to the potential for a breakout, particularly with increasing volume on up days, which is a sign of institutional accumulation.
Critical technical levels: $260 (major support), $283–$290 (resistance zone). If the stock holds above $260 (Q3 2025 peaks), the underlying trend appears robust, but any reversal signals near resistance should be watched closely.
Momentum indicators (RSI, MACD) and stable volume profile suggest sustained optimism but prudent risk management is advised in case sentiment shifts.
Fundamental Analysis
Alphabet boasts strong recent earnings, with robust year-over-year growth in revenue and profit, especially from AI and Cloud businesses. Analyst consensus remains bullish, supported by upward revisions in price targets.
Valuation: Currently trading at roughly $284 per share, Alphabet’s price-to-earnings (P/E) ratio sits around 28, which is relatively attractive for a company growing earnings per share (EPS) at over 17% per year and maintaining high margins (ROE 32%, ROA 23%).
Intrinsic value estimates (base case) place fair value closer to $180, suggesting the stock is technically overvalued on traditional models, though AI/cloud potential and ecosystem advantages could justify a premium.
Key strengths: Dominant data ecosystem (Search, Android, Chrome, Gmail), world-leading AI research (DeepMind, Gemini), and a healthy balance sheet (minimal debt, strong free cash flow).
Risks: Heavy reliance on ad revenue, potential regulatory headwinds (especially in the EU), and risk of AI-driven disruption to legacy business lines.
Does It Worth to Follow Buffett at the Google' Peak?
Buffett’s purchase signals confidence in Alphabet’s long-term moat and ability to transition to AI-driven growth, despite current valuations appearing rich by historical standards.
Technically, the uptrend has not shown signs of exhaustion, and volume patterns indicate continued market accumulation. But buying near technical resistance always carries risk of short-term pullback.
Fundamentally, Alphabet’s growth engines, profitability, and fortress balance sheet remain appealing. However, potential macroeconomic and regulatory shocks are real, and intrinsic valuations suggest caution for value-focused investors.
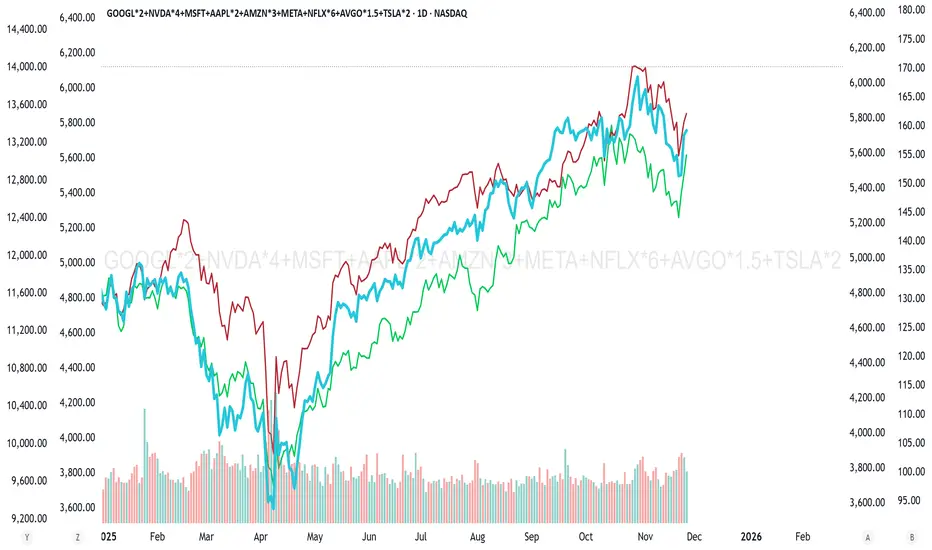
Beta-relative testing
We have examined Google stock in AU measure (one stock value in grams of gold). The graph below indicates on major long term upside trend, with a possible nearly 60% further upward potential is such measurement.
We have also tested Google stock in a measure of Nasdaq-100 (in example below NASDAQ:QQQ has been used; both - Google stock and QQQ - were used in 'total return' format).
Well, right now we can consider that multi-year 'flat regime' finally goes to breakthrough.
In conclusion, following Buffett now is technically supported by trend and recent accumulation, and fundamentally underpinned by growth, but it means accepting a premium and faithfully betting that Alphabet’s evolving AI/assets will deliver above-model returns over time.

Google Stock (NASDAQ: $GOOGL) Rises on Nano Banana Pro UpdateGoogle parent Alphabet (NASDAQ: NASDAQ:GOOGL ) introduced Nano Banana Pro, an upgraded version of its AI image-editing and generation platform powered by Gemini 3 Pro. The update improves text legibility inside AI-created images—one of the most persistent challenges for image models—and integrates deeper reasoning features from Gemini 3, enabling more consistent output and broader creative control.
The tool will also be available across Google Search’s AI Mode, the Gemini API, Google Ads, and Flow, the company’s filmmaking platform. Free-tier Gemini users will receive limited access quotas, a move designed to increase usage while showcasing the improved capabilities.
The launch comes just days after Google unveiled Gemini 3, a major release aimed at closing competitive gaps with OpenAI. According to The Wall Street Journal, the earlier launch of Nano Banana in August significantly accelerated user growth and retention, making this enhanced version a strategic release. While ChatGPT still leads in usage, Google’s rapid iteration suggests a strong push toward regaining market share across creative and enterprise AI applications.
Technical Analysis:
Alphabet shares have been bullish overall, recently breaking above a long-respected trendline to the upside. This breakout confirms ongoing upward momentum supported by improving AI fundamentals, rising cloud demand, and investor optimism around new product rollouts.
The stock did pull back on Friday following the Nano Banana Pro announcement, but the technical structure remains intact. The trendline breakout continues to act as a strong foundational level, and buyers may re-enter if price revisits that zone. A sustained hold above recent highs opens room toward the next major target region, while failure to reclaim momentum could trigger a short-term retest before continuation.
Overall, Google’s AI expansion supports the broader bullish bias, with fundamentals and technicals aligning for potential upside continuation.

GooglGoogl finished with a weekly bearish engulfing
It's first since March 2025
Currently 25% extended from its weekly 20sma .. last 3 times googl extended past its 20sma over 16% a draw down occurs
Completely detached from its monthly Bollingerband; This a huge red flag! You don't chase longs up here
But remember you have to trade the time frame you analyze . Since this is over bought on the monthly and I don't think this continues into Dec , your shorts should have 45-60 days minimum on the expiration.
I'm expecting a pullback to 240-255 within the next 30-45 days
For entry purposes, you would look for an entry near 290.. be willing to add short up into 300 with a stop loss above 300.
First target would be 270 and then 250 below it

Even The Most Accomplished Make Mistakes $Goog [Berkshire]Berkshire Hathaway made an entrance into the Mag 7 (Excluding Apple) with its purchase of Alphabet / Google I believe that this was a mistake solely based on the fact that the majority of the tech industry is extremely overvalued. While Googles Valuation at least in my opinion is justified considering how strong Its business model is with its High Margin Reoccurring Subscription models (Google Cloud),(YouTube Premium),(Google Workshop),(Google Play) to name a few and how Dominate it is in Ads with YouTube / Chrome. It also Dominates Web Search let alone the majority of people saying they will "Google something" it sounds stupid but its a good mental metric on how people think of search. Google has built Search / web ecosystem to complement each other and force you to use there services in one way or another you are using there web ecosystem everyday from Google maps, to Google Docs or Gmail, they made you dependent on there services, Especially the younger generation (GenZ) is growing very dependent on Google Maps which may be free but shows you the grip they have on peoples web use. The Primary issue I have with Berkshire Hathaway entering at these prices is generally the markets are indiscriminate if the mag 7 or tech industry has a red day no matter how strong Google may be that will bring them down too.
-----------------------
My Personal Thesis on Google:
I am very bullish on several areas of Alphabet Including but not limited to Google Cloud, YouTube, Its subscription Services, Its high Margin software business model. Most Importantly to me is There Robotics Section Deepmind and Gemini Robotics. Robotics is underappreciated and my personal belief is that it is the Next AI like boom but we are very early to this. Robotics has use cases in every industry from Solving lack of labor issues and an aging workforce / population especially in western countries Robots can easily pick up this slack and they will greatly benefit from Artificial intelligence Google / Alphabet has the money and cashflow to heavily invest in this area maybe not creating the physical humanoid robots but they can definitely excel in the software section of it. Segments like Waymo are also interesting and bullish. Google is also massively profitable has very little debt, and an extremely solid balance sheet.
-----------------------
Risks:
I Believe the biggest Risk for Alphabet once again is that The American Tech Sector is extremely Overvalued, I Also See moderate amount of risk being that Google is such a monopoly that leaves it open for Antitrust Suits.
-----------------------
Business Model:
Google Is Vertically Integrated its Business was closely tied to the AI Boom being one of the Big 3 with its AI spending. People Disregard its extremely impressive moat it possesses having one of the strongest moats in tech let alone in the history of business.
-----------------------
Fundamentals:
Cash: US$98.50b
Debt: US$26.60b
Equity: US$386.87b
Total Liabilities: US$149.60b
Total assets: US$536.47b
Net Margins: 32.23%
-----------------------
Metrics:
Return On Equity: 32.1%
Return On Assets: 22.5%
Return On Capital Employed: 28.8%
-----------------------
Valuation:
Price to Sales: 8.9x
Price To Earnings: 27.7x
Price To Book: 8.9x
-----------------------
Disclaimer: I am not Initiating buy, Sell or Hold Opinions. I Only make these posts for Conversation. I am not a financial Expert or an Analyst.
GOOGL Momentum Play: QuantSignals V3 Sees DownsideGOOGL | QuantSignals Katy 1M Prediction (2025-11-21)
Current Price: $295.97
Predicted Close: $293.39 (-0.87%)
30-min Target: $291.79 (-1.41%)
Trend: Bearish
Confidence: 65.8%
Volatility: 32.1%
Trade Signal
Direction: SHORT (PUT)
Entry: $295.97
Target: $293.90
Stop Loss: $300.41
Expected Move: -0.87%
Summary: 1 trade signal generated from 1 successful analysis.
Alphabet (GOOG) Set For Correction -RSI Shows Bearish DivergenceThis daily chart highlights an upside impulse in the making
Price action fits neatly within the orange uptrend
The major portion of the move appears complete with waves 1-3 finished as shown by the white labels
RSI displays strong bearish divergence against the higher highs on the chart
The large wave ((4)) is expected to unfold next
The downside target zone is shown by the pink box between 245 and 208 representing the 38.2-61.8% Fibonacci retracement of wave ((3))
The bottom of the smaller wave 4 sits within this zone at 237 and price often retests that level
And yes wave ((4)) could break down the uptrend
After that the final wave ((5)) should at least retest the wave ((3)) peak at 304
Good Luck!
