Amd - Higher and higher this stock goes!🎁Amd ( NASDAQ:AMD ) still remains totally bullish:
🔎Analysis summary:
Amd just remains one of the most bullish stocks at the moment. And while the recent correction of -30% was totally expected, this stock is already back at support. Either here or at the next support lower Amd will create a bullish reversal and head for new highs.
📝Levels to watch:
$200 and $175
SwingTraderPhil
SwingTrading.Simplified. | Investing.Simplified. | #LONGTERMVISION
Advanced Micro Devices, Inc.
No trades
What traders are saying

AMD Will this Double Top start the new Bear Cycle?Advanced Micro Devices (AMD) has been practically consolidating since its October 27 2025 High between the Resistance it created and the 1D MA100 (black trend-line) that served as Support in November - January, holding firmly.
Two weeks ago the resulting 1D MA100 rebound got rejected on that Resistance, making so far a technical Double Top, prolonging the ranged trading. Such consolidation is typically price behavior on market Tops. Technically it is similar to the way the previous Bullish Legs of AMD's 6-year Channel Up.
Well it appears we are at the end / Top of the 2025 Bullish Leg as it has already approached the Channel's top (Higher Highs trend-line). At the same time, the 1W RSI got rejected on its own 6-year Resistance, which has marked the Channel's two Tops. Based on he 1W RSI analogy, we may be currently where the red arrows point on the 2024 and 2022 Bearish Legs.
Even though the Bullish Leg could technically extend as high as the 1.236 Fibonacci extension (like the previous did), the focus of a long-term investor should be to buy (much) lower, preferably as close to the 1M MA100 (red trend-line) as possible, in stead of chasing what could be the last days of this rally.
The last two Higher Lows of the Channel Up (and Bearish Leg bottoms) have been priced just above the 0.786 Fibonacci retracement level, so we are more than fair calling a $115.00 Target just under the 0.618 Fib based on the current trajectory of the 1M MA100.
Notice also that both previous Bearish Legs got confirmed after the price broke and closed a 1W candle below the 1D MA100. If you want to wait, use that when it happens, as a Sell Signal confirmation.
---
** Please LIKE 👍, FOLLOW ✅, SHARE 🙌 and COMMENT ✍ if you enjoy this idea! Also share your ideas and charts in the comments section below! This is best way to keep it relevant, support us, keep the content here free and allow the idea to reach as many people as possible. **
---
💸💸💸💸💸💸
👇 👇 👇 👇 👇 👇

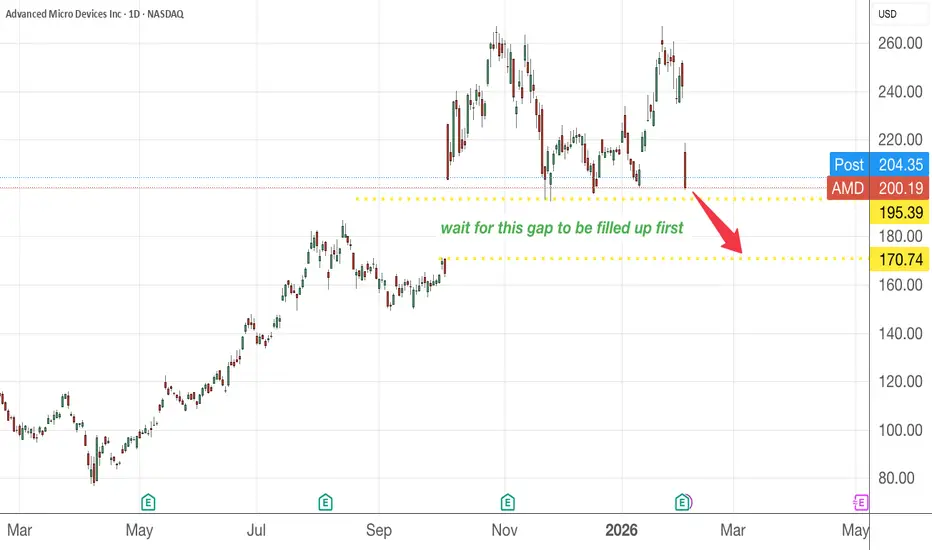
AMD is offering discount , are you buying ?I will take a bet for the gap to be filled up before buying more. The current Tech sector sells off may be an opportunity for us to bring along great companies like this to slide further, meaning more discount coming your way....
Please DYODD
AMD Shares Drop As Forecast Comes Up Short of Some ExpectationsAdvanced Micro Devices (NASDAQ; NASDAQ:AMD ) reported fourth-quarter earnings that topped expectations, but the company’s first-quarter forecast fell short of what some analysts were expecting amid an AI spending boom.
The stock fell Tuesday as much as 8% in extended trading.
Here’s how the chipmaker did versus LSEG consensus estimates for the quarter ended in December:
EPS: $1.53 vs. $1.32 expected
Revenue: $10.27 billion vs. $9.67 billion expected
For the first quarter, AMD said it expects $9.8 billion in revenue, plus or minus $300 million, versus expectations of $9.38 billion. Some analysts, however, were expecting AMD to provide stronger guidance as customers continue to ramp up spending for the chips necessary to power AI models.
Net income climbed to $1.51 billion, or 92 cents per share, versus $482 million, or 29 cents per share, in the year-ago period. AMD’s overall revenue was up 34% on an annual basis.
Technically, the shares of NASDAQ:AMD have depicted a bullish flag pattern already breaking the ceiling of the flag however, shares of NASDAQ:AMD are down 8.8% in Wednesday's premarket trading with the RSI at 55, this might be a precursor to further dip coming through.
However, according to 35 analysts, the average rating for AMD stock is "Strong Buy." The 12-month stock price target is $251.91, which is an increase of 4.05% from the latest price.

AMD: 50% Decline Ahead? Massive Reversal SetupThe semiconductor giant AMD is flashing major warning signs on the higher timeframes. After a parabolic run, we are seeing a confluence of bearish technical factors that suggest the local top is officially in.
📉 The Technical Confluence
1. Global Resistance Rejection: Price has demonstrated a violent reversal from a long-standing global resistance trendline. This wasn't just a touch; it was a rejection that suggests big players are distributing their positions.
2. Bearish Double Top + RSI Divergence: We can clearly see a Double Top formation on the Daily chart, combined with the solid RSI Divergence. This structural pattern often serves as the precursor to a long-term trend reversal.
🚀 The Short-Term Gap Fill
On February 4, 2026, the price opened with a solid Gap Down. In many cases, the market likes to re-test the "scene of the crime" before the real move starts.
Near-term Outlook: We may see a relief rally to fill the gap around the $230.00 area.
The Opportunity: This $230 zone is our "Point of Interest" (POI) to look for short entries once the gap is filled and bearish price action returns.
🎯 Targets & Macro View
If the structure holds and the rejection from the gap-fill is successful, we are looking for a massive downtrend with the following targets:
Target 1: $150.00 (Closest Support area)
Target 2: $100.00 (50% retracement from current levels)
Conclusion: The risk-to-reward ratio for a short position near the gap fill is highly attractive. However, wait for the $230 re-test to ensure you aren't chasing the move.
What do you think? Is the AI/Semiconductor hype finally cooling off? Let me know in the comments! 👇

AMD — Everything Looks BadSince October 2025, AMD stock has been correcting.
Waves A and B have formed, and it appears that Wave C has begun to develop.
The correction type is flat .
Wave C is forming as a five -wave impulse.
Key targets:
218 — local correction
200 — the most likely end of the impulse, located in the 50–60% range of the larger Wave 5
189
The potential move from the current level is 15–20%.
We assume that the stock may move lower after the initial targets are reached.
---
Subscribe and leave a comment.
You’ll get new ideas faster than anyone else.
---

AMD - Perfect timing to grasp great potential ahead!AMD (Advanced Micro Devices) has shown strong potential for growth, and the recent trend analysis using the MACD (Moving Average Convergence Divergence) indicator suggests that the stock remains in a favorable position for continued upside momentum.
Technical Analysis:
The MACD is a powerful trend-following momentum indicator that helps traders identify potential buy and sell signals based on moving averages. For AMD, the MACD indicator is currently showing a bullish crossover, where the MACD line has crossed above the signal line. This suggests that the stock’s momentum is shifting positively, indicating an increasing rate of price change to the upside.
Key MACD Signals for AMD:
Bullish Crossover: The MACD line (typically the difference between the 12-day and 26-day exponential moving averages) has recently crossed above the signal line (a 9-day EMA of the MACD). This is a classic bullish signal, which often precedes further price appreciation.
Strong Momentum: The distance between the MACD line and the signal line is widening, signaling strong momentum in the upward direction. This suggests that buying interest in AMD is gaining strength, and the stock could continue to rise as long as the momentum remains intact.
Positive Histogram: The MACD histogram is currently above the zero line, reflecting that the difference between the MACD and its signal line is positive. This further validates the strength of the bullish momentum, indicating that the stock could continue to experience upward pressure.
AMD’s Fundamental Strength:
Beyond technical indicators like MACD, AMD's fundamentals also support the favorable technical outlook. The company continues to make significant strides in the semiconductor industry with its innovative product lineup, including the Ryzen processors and Radeon graphics cards. AMD has been gaining market share from competitors like Intel and Nvidia, further strengthening its long-term growth prospects.
Our conclusion for this stock.
With a favorable MACD indicator, coupled with the robust fundamentals of AMD, the stock is well-positioned for potential gains. The bullish momentum indicated by the MACD suggests that AMD could experience continued price appreciation, making it an attractive option for investors who are looking for stocks with solid upward potential.
Trade set-up
Entry: 105
Target: 135 - Our target is set up below the weak resistance which used to serve as a support line when the stock was trading at ATH levels.When we reach that key-level we would analyse the stock again to see if it has more favourable data to boost the price towards the strong resistance level of 170+ below the ATH area
Stop Loss: 70 which is an unsustained bottom, utilizing it for protection over the trade

AMD Breakdown Alert — High Volatility Favors the Bears🚀 QuantSignals Katy AI Stock Analysis
📈 AMD Analysis
Current Price: $205.22
Final Prediction: $202.14 (-1.50%)
30min Target: $196.18 (-4.41%)
Trend: BEARISH
Confidence: 60.0%
Volatility: 252.9%
🎯 TRADE SIGNAL:
Direction: PUT
Entry: $205.22
Target: $202.75
Stop Loss: $208.30
Expected Move: -1.50%
Summary: Generated 1 trade signals from 1 successful analyses out of 1 symbols.

$AMD — Post-Earnings | Decision zone, not an impulse buyAMD (Advanced Micro Devices) saw a huge earnings fade (~-17%) that just flushed out most of the recent gains. Such a move isn’t noise. It’s a repricing.
From a daily perspective:
🔹 $200 is an important support (was a respected one) 🔹 Huge rejection from the ATH (~264) 🔹 Price is below all key value areas (be careful) 🔹 Post-earnings volatility is high (emotional trap zone)
⚠️ Important: Buying because “it already fell a lot” is a common mistake. Avoid!
📌 What I’m looking for:
Price equilibrium
End of selling force
Price above VWAP (or key MA)
A higher low or trend line break Structural confirmation
🎯 Summary
❌ Existing price action is not an impulse entry.
⏳ It’s a decision zone.
✅ Predicting is a mistake. It’s about patience and reaction.
Remember, the market will always provide an opportunity — It’s when you force one that will get you in trouble.
Not financial advice. Risk management above all.

AMD’s AI Future: Innovation Meets Geopolitical RiskAdvanced Micro Devices (AMD) recently delivered a solid Q4 earnings beat, surpassing Wall Street’s revenue and profit forecasts. Demand for AI chips remains exceptionally high, particularly within the data center segment. Despite these strong results, AMD’s stock price retreated as investors demanded more specific future guidance.
Technological Dominance and Patent Power
AMD's competitive edge stems from its revolutionary "chiplet" architecture. This modular design allows the company to mix and match components for maximum efficiency. Recent patent filings reveal a strategic focus on 3D silicon stacking and heterogeneous computing. These innovations accelerate data movement between the processor and memory. Such breakthroughs allow AMD to challenge Nvidia's dominance in the high-performance computing market.
The TSMC Trap: A Geopolitical Bottleneck
AMD’s greatest strength is also its most significant vulnerability. The company relies almost exclusively on TSMC in Taiwan for its most advanced chips. A potential Chinese invasion of Taiwan would immediately sever AMD’s vital supply chain. Furthermore, a global embargo on China would block AMD from one of its largest consumer markets. This geographic concentration represents a critical risk that no amount of innovation can fully mitigate.
Strategic Leadership and Corporate Culture
Under Dr. Lisa Su, AMD has transformed into an execution powerhouse. The leadership team prioritizes long-term roadmaps over short-term marketing gimmicks. This culture of engineering excellence has successfully captured a larger share of the lucrative server market. Management consistently hits its targets, building deep trust with enterprise clients and cloud providers.
Macroeconomic Pressures and Business Agility
High interest rates and global inflation create a challenging environment for growth-oriented technology stocks. However, AMD’s "fabless" business model provides a necessary buffer. By avoiding the massive costs of owning factories, AMD maintains high profit margins. This financial flexibility allows the company to reinvest heavily in R&D during economic downturns.
Cybersecurity and Scientific Integrity
Security is now a primary differentiator in the semiconductor industry. AMD integrates "Infinity Guard" technology directly into its silicon to prevent sophisticated hardware attacks. This focus on cybersecurity attracts high-security government and corporate contracts. As science pushes toward smaller transistors, AMD’s commitment to hardware-level encryption remains a vital selling point.
The Bottom Line for Investors
AMD remains a titan of high-tech innovation and strategic growth. Its patent portfolio and AI roadmap signal long-term industry leadership. However, savvy investors must monitor the rising tensions in the Taiwan Strait. AMD’s future depends as much on global diplomacy as it does on technological genius.

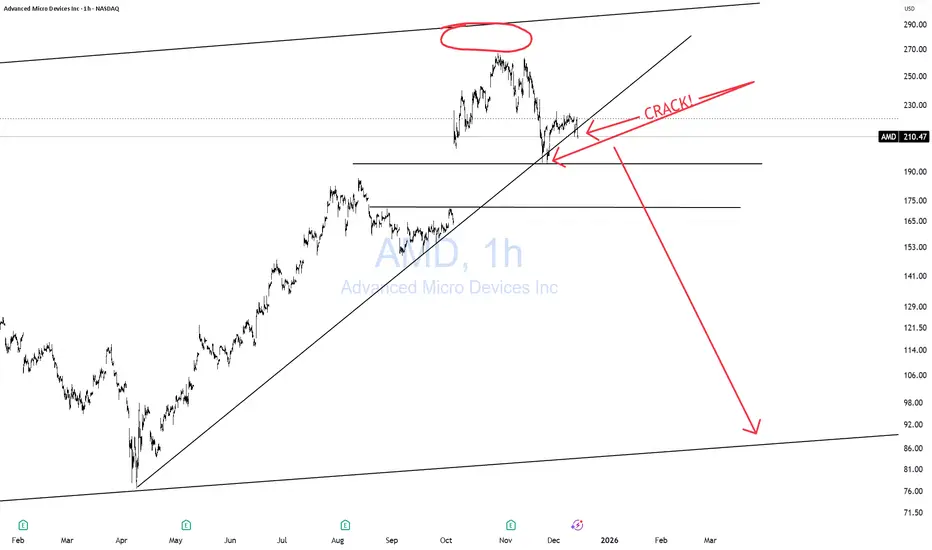
AMD CARCKSSSSAMD has multiple cracks in the uptrend
A big, subtle but powerful void in its last attempt to high the upper trendline. Which is more telling of weaness.
A BIG ARS gap below it.
AMD has already lost -22% from its all-time highs. Likely to lose a lot more.
As I have been warning (GTFO & STFO) here for a while, about the entire market.
CAUTION to the permabulls "Buy The Dip" who have no exit strategy. Remember, no matter where the price goes, it's always 100% from zero! You can't "buy the DIP" unless you "SELL the RIP! That's just simple counting. Nothing Fancy!
THANK YOU for getting me to 5,000 followers! 🙏🔥
Let’s keep climbing.
If you enjoy the work:
👉 Drop a solid comment
Let’s push it to 6,000 and keep building a community grounded in truth, not hype.
AMD Weekly — Elliott Wave Roadmap to $458Wave (2) found support at the 0.5 fib ($171.78) — textbook corrective depth. The impulsive structure from the 2022 lows remains intact.
Current read:
→ Wave (1): $267 ✓
→ Wave (2): $172 ✓ (0.5 retrace)
→ Wave (3) target: $386 (1.618 ext)
→ Wave (4) pullback: ~$340 (0.382 of W3)
→ Wave (5) terminal: $458 (2.0 ext)
Fundamental backing:
This isn't just pattern hopium. The catalyst stack is real:
MI300X AI GPU ramp — $5B+ revenue guidance, likely sandbagged
EPYC Turin (Zen 5) launching into Intel's weakest competitive position in a decade
Console refresh cycle (PS6/Xbox) = semi-custom revenue 2026-27
PC/AI PC upgrade cycle beginning
Xilinx edge AI synergies hitting stride
Invalidation: Weekly close below $172 (W2 low) kills the count.
Risk: NVDA maintaining >80% AI GPU share longer than expected. But AMD doesn't need to "win" — just needs to grow the 15-20% they're capturing.
Current pullback (-8.8% this week) is noise. Wave 2 held. Structure intact.
Targeting $386 first, then reassess for $458.
🎯 Entry zone: $230-240
🛑 Stop: $170
📈 Target 1: $386 | Target 2: $458
Chart: WaverVanir_International_LLC
#AMD #ElliottWave #Semiconductors #AI #TechnicalAnalysis

Clear double Top on AMD - Ready Buy LimitsClear double top
Gap always closes
This trade is placed to catch a falling knife
Ready buy limits at 160
TP @ 260

$AMD: completed a flatNASDAQ:AMD : completed a 3-wave flat, which is also the 31.8% retracement. This can be the entire correction, or, if the market goes south, a part of a complex correction. Either way, the next wave is up.
Holding my longs.

AMD - Hypothetical Projection if the AI bubble popsProbably it's good if the bubble pops.. We can buy our fav. stocks for a discount !!
Short around 240-250 area
Target 1 - 195
Target 2 - 165
Target 3 - 125
Stop loss - 270
- All of the VWAPs converging around 120-130 area
- 200 WMA would be around same zone
Or -
This might be too early for this trade, probably there might be another leg upto 300's to call it a top

AMD | Oversold Into Range SupportAMD sold off hard despite a top-and-bottom-line beat, as the market focused on the quality of AI upside and how quickly that turns into earnings. In this tape, expectations matter more than the headline beat.
Technical Lens: Price is drifting back towards the lower bound of the sideways consolidation (~195–200 area on this view). RSI is oversold (~29), which often makes this zone a decision point rather than a straight-line move.
Catalysts: The next re-pricing catalyst is evidence that data-centre AI GPU revenue is scaling cleanly (less one-off driven) and that margins/operating leverage improve as volumes rise. Any clear proof of larger deployments or platform wins can push forward EPS estimates higher and re-open the re-rate conversation.
Takeaway: AMD is pressing into range support with oversold momentum — the next few sessions should reveal whether this is a stabilisation zone or a range breakdown attempt.

AMD Earnings Play: Defined-Risk Upside Into a Binary EventAMD QuantSignals V4 Earning 2026-02-03
Price pre-earnings: ~$242–246 zone
Implied move: ~±8–8.5% → $20–21
Key market expectation: Move into $255–265 if bullish
Volatility: Low IV rank → premiums are not inflated
Event type: Binary (gap up or gap down, no smooth grind)
What the market is really saying
Options are pricing a big move, but
Open interest clusters at 250 and 260 → dealers expect price to gravitate there
Put/Call ratio ~1.07 → not euphoric, not fearful
This is not a “lottery” setup, it’s a range-defined bet
Strike logic (important)
Higher strikes (250/260)
Lower cost
Need a real gap to win
Higher % return, lower probability
Lower strikes (240/250 or 245/250)
More forgiving
Smaller max profit
Higher probability of partial win

AMD Showing Bearish Evening Star, A Potential Trend ReversalI posted a bearish idea last year about this stock and this was when the AI sentiment was still strong but despite of that after that major gap up, thing started to slowly change. Over the past session, I've seen this stock is started to show some selling pressures again. And there’s been real news pressure pushing the stock lower, not just noise:
I'd like to share it here:
1) Competitive Pressure From Microsoft’s AI Chip Reveal
Shares of AMD recently slid after Microsoft unveiled a new AI chip designed to reduce reliance on established chipmakers, which hit AMD’s narrative as a core supplier in AI-driven demand. This kind of development creates uncertainty around AMD’s growth trajectory in key markets like cloud/custom silicon.
2) Broader Tech Weakness After Microsoft Earnings
MSFT itself has been getting punished after earnings despite beating estimates, largely due to concerns that massive capex and cloud spending aren’t translating into huge near-term returns and that drag rippled across the tech sector. Tech stocks, including semiconductors, were among the weakest as markets digested this.
3) Mixed Sentiment + Volume Drop
Recent sessions showed AMD trading down on weaker volume, suggesting selling pressure without meaningful buyer support — a bearish backdrop that reinforces the technical pattern.
I am bearish at AMD right now and I will try to trade this as low as that $200 level.

AMD Weekly | 260 Breakout | Perfect Lesson in Support ResistanceHello TradingView Community, Hope you enjoyed your weekend. 👋
Sharing a clean and educational weekly chart study on AMD, where price action around the 260 resistance level is doing an excellent job of explaining how markets respect support and resistance over time. While this idea focuses on a potential long opportunity after a confirmed breakout, it also serves as a strong example of market structure, retests, and consolidation behavior that every trader can learn from.
This is a long-side trading idea based on the weekly chart of Advanced Micro Devices (AMD), with the primary focus on a potential breakout above the 260 resistance level. A strong weekly close and sustained price acceptance above this zone could confirm bullish continuation, supported by a classic measured move projection.
That said, even without an actual breakout, this chart itself is extremely valuable from a learning and market structure perspective. It beautifully demonstrates some of the most important and timeless principles of technical analysis-:
+How major resistance levels repeatedly act as supply zones.
+Why price often reacts sharply near key resistance.
+How a successful breakout can transform resistance into support.
+The importance of a proper retest before continuation.
+How consolidation near resistance often signals institutional participation.
The price action over multiple years clearly highlights that markets move in phases expansion, correction, consolidation, and continuation all guided by support and resistance behavior. This makes the chart useful not only for traders looking for opportunities, but also for those aiming to improve their chart reading and decision-making skills.
Key Resistance / Closing basis: 260
Directional Bias: Bullish only after a confirmed breakout
Measured Target: 325 To 330
Risk Note: Invalidation on a weekly close back below 260
Note-:In case of strong bullish continuation, the rising resistance trendline comes into focus as a secondary target area, currently placed near the 400 level, That's why rising resistance placed on provided chart
Patience and confirmation remain critical, especially on higher timeframes.
This analysis is shared for educational purposes only and should not be considered financial advice.
Regards- Amit.


AMD Is Up 100%+ Over 12 Months. What Its Chart Says NowHigh-end chip designer Advanced Micro Devices NASDAQ:AMD has risen more than 100% over the past year, outpacing the S&P 500 and setting an all-time high in October. Let's see what its chart and fundamental analysis say heading into this week's Q4 earnings report.
AMD's Fundamental Analysis
AMD will release results after the closing bell on Tuesday, with analysts expecting the firm to post $1.32 in adjusted earnings per share on roughly $9.7 billion of revenue.
That would represent 21.1% gain from the year-ago period's $1.09 of adjusted EPS, as well as better than 26% year-over-year growth from Q4 2024's approximately $7.7 billion in revenue.
But very interestingly, Wall Street doesn't seem especially certain about what they expect AMD to report.
Eighteen of the 37 sell-side analysts that I'm tracking who cover AMD have revised their earnings estimates to the upside since the quarter began, while 16 analysts have cut their forecasts. Just three have left their estimates unchanged.
AMD's Technical Analysis
So, what does AMD's chart say going into earnings? Let's have a look going back about four months and running through Monday morning (Feb. 2):
This chart shows AMD's Oct. 29 $267.08 all-time intraday high at left, and some readers might see a potential double-top pattern of bearish reversal above.
They wouldn't be wrong -- at least not yet. But what I think I see is a cup-with-handle pattern with a $267 apparent pivot. This is usually understood as a bullish set-up.
AMD has already taken back its 21-day Exponential Moving Average (or "EMA," marked with green line). It's also reclaimed its 50-day Simple Moving Average (or "SMA," denoted by a blue line). All of that tends to get swing traders and institutional investors on the same page in favor of a stock.
Now let's look at those two averages' relative positions.
The green line has recently crossed over the blue line, as the blue line was pivoting from trending lower to trending higher. This is referred to as a "mini golden cross" or "swing traders' golden cross." That's a medium-term bullish technical signal.
Also note that AMD's Relative Strength Index (or "RSI," denoted by the gray line at the chart's top) has been running strong, but just below technically overbought levels.
Meanwhile, the stock's daily Moving Average Convergence Divergence indicator (or "MACD," marked with black and gold lines and blue bars at the chart's bottom) is postured very bullishly.
For one thing, the histogram of the 9-day EMA (the blue bars) is now well above the zero-bound.
Additionally, the 12-day EMA (the black line) is running above the 26-day EMA (the gold line), with both lines above zero. That's all bullish as well.
An Options Option
Some options traders who are bullish on AMD heading into earnings but don't want to plunk down the capital for an equity stake could likely utilize a bull-call spread in this scenario. That's where you go long one call and short another at a higher strike price, but where both have the same expiration date.
Here's an example:
-- Long one AMD call with a Feb. 6 expiration (i.e., after this week's earnings report) and a $252.50 strike price. This cost about $11.75 at recent prices.
-- Short one AMD Feb. 6 call with a $267.50 strike price (i.e., close to the chart's apparent pivot). This would bring in roughly $6.15.
Net Debit: $5.60.
The trader in this example is laying out a $5.60 net debit (the maximum theoretical risk involved) to try to bring back $15.
If successful, the trade will bring in a $9.40 maximum profit at expiration ($15 minus the $5.60 net debit). This will happen if AMD closes above $267.50 at expiration.
If unsuccessful, the trade will incur a maximum theoretical loss of the $5.60 net debit. This will occur if AMD is trading at or below $252.50 at expiration.
(Moomoo Technologies Inc. Markets Commentator Stephen "Sarge" Guilfoyle was long AMD at the time of writing this column.)
This article discusses technical analysis, other approaches, including fundamental analysis, may offer very different views. The examples provided are for illustrative purposes only and are not intended to be reflective of the results you can expect to achieve. Specific security charts used are for illustrative purposes only and are not a recommendation, offer to sell, or a solicitation of an offer to buy any security. Past investment performance does not indicate or guarantee future success. Returns will vary, and all investments carry risks, including loss of principal. This content is also not a research report and is not intended to serve as the basis for any investment decision. The information contained in this article does not purport to be a complete description of the securities, markets, or developments referred to in this material. Moomoo and its affiliates make no representation or warranty as to the article's adequacy, completeness, accuracy or timeliness for any particular purpose of the above content. Furthermore, there is no guarantee that any statements, estimates, price targets, opinions or forecasts provided herein will prove to be correct.
Options trading is risky and not appropriate for everyone. Read the Options Disclosure Document ( j.moomoo.com ) before trading. Options are complex and you may quickly lose the entire investment. Customers should consider their investment objectives and risks carefully before investing in options. Because of the importance of tax considerations to all options transactions, the customer considering options should consult their tax advisor as to how taxes affect the outcome of each options strategy. Supporting documents for any claims will be furnished upon request.
Options trading subject to eligibility requirements. Strategies available will depend on options level approved.
Maximum potential loss and profit for options are calculated based on the single leg or an entire multi-leg trade remaining intact until expiration with no option contracts being exercised or assigned. These figures do not account for a portion of a multi-leg strategy being changed or removed or the trader assuming a short or long position in the underlying stock at or before expiration. Therefore, it is possible to lose more than the theoretical max loss of a strategy.
Moomoo is a financial information and trading app offered by Moomoo Technologies Inc. In the U.S., investment products and services on Moomoo are offered by Moomoo Financial Inc., Member FINRA/SIPC.
TradingView is an independent third party not affiliated with Moomoo Financial Inc., Moomoo Technologies Inc., or its affiliates. Moomoo Financial Inc. and its affiliates do not endorse, represent or warrant the completeness and accuracy of the data and information available on the TradingView platform and are not responsible for any services provided by the third-party platform.

AMD — Earnings Ahead: Pullback or Trend Continuation?Hello Everyone, Followers,
I hope all are doing well.
Today I will share some analysis same as every Sunday and first one is AMD
Let's drill down:
📊 Technical Overview
AMD remains in a broader uptrend, but price has recently pulled back sharply after rejection near the upper Fibonacci zone.
The long-term rising trendline is still intact, and price is currently reacting around the 0.382 Fib retracement, which aligns with dynamic MA support.
With earnings scheduled for February 3, volatility is expected to increase.
🔹 Key Levels
Support
236–238 → Short-term demand (We are here)
221–223 → Structure support
197.5 → Major horizontal demand (key invalidation)
Resistance / Targets
251–253 → Prior rejection zone
265–268 → 0.618 Fib resistance
284–285 → Upper Fib / previous high area
🔮 Outlook
As long as price holds above the rising trendline, the medium-term structure remains bullish, though short-term consolidation is likely ahead of earnings.
🎯 What I Expect
I expect choppy price action into earnings, with buyers defending the trendline.
Post-earnings direction will depend on whether AMD can reclaim 251+ or loses 221 support.
If you enjoy and like clean, simple analysis — follow me for more.
This is just my thinking and it is not invesment suggestion , please do not make any decision with my anaylsis.
Have a lovely Sunday to all and hopefully green trade day for next Week.
#SPX500 #NASDAQ #AMD

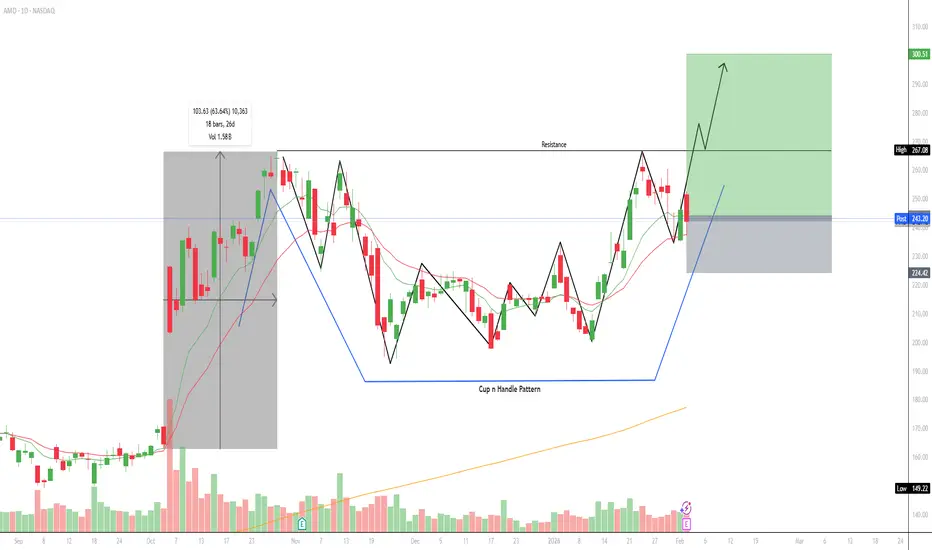
Perfect double top! - $AMDWhat's up traders!
I have something a little different today. This is a great example of a Double Top pattern. When analyzing a double top pattern you usually wait for a break of that resistance or see if price bounces of it again.
We also have another pattern as well in this chart. This pattern is called the cup and handles pattern, When seeing this pattern people usually look for price to continue to the upside.
We are currently in an uptrend and have been moving somewhat sideways after the 65% move in October.
On the daily we also have a pullback to the 10 and 20EMA which is a good sign for a continuation to the upside.
I predict price will go up and test that resistance at around $267 and then possibly struggle to get though and move sideways for a little bit, but after that i think price will skyrocket through that resistance.
After that I think price could reach $300 which would be a gain of around 12% within a few weeks. There is also good volume coming back to those EMAs.
On the 1H we also have the 200SMA coming up underneath price which could cause a little bounce reaction off it.
They have earnings tomorrow so we'll see how that goes.
What is your opinion on this setup? Let me know in the COMMENTS! And it would be super helpful if you liked and followed!
Thank you for reading!