BKE New ATH With Golden CrossAfter touching with this upper resistance level four times in the last 15 years BKE has finally broke out yesterday with volume. BKE has also formed an ascending channel over the last 4 years. Lastly the 100 day SMA crossed above the 200 day SMA.
Entering 60c 19Dec2025
Next report date
—
Report period
—
EPS estimate
—
Revenue estimate
—
3.560 EUR
188.72 M EUR
1.18 B EUR
31.24 M
About Buckle, Inc. (The)
Sector
Industry
CEO
Dennis H. Nelson
Website
Headquarters
Kearney
Founded
1948
IPO date
May 8, 1992
Identifiers
3
ISIN US1184401065
The Buckle, Inc. engages in the business of retailing medium to better-priced casual apparel, footwear, and accessories for fashion-conscious young men and women. The firm is also involved in the provision of customer services such as free hemming, free gift-packaging, easy layaways, private label credit card, and guest loyalty program. The company was founded by David Hirschfeld in 1948 and is headquartered in Kearney, NE.
Related stocks

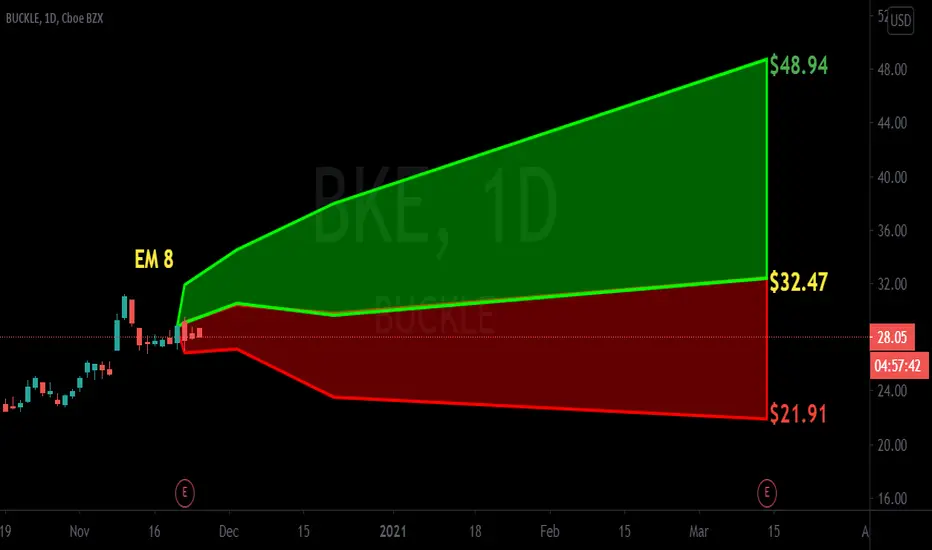
BKE on WatchLooking for a pullback to .5 fib level
Why:
High volume green days
Uptrend on daily chart
Green line is 1.618 fib on weekly daily chart.

Short squeeze mini series # 12What Is a Short Squeeze?
A short squeeze occurs when a stock or other
asset jumps sharply higher, forcing traders who
had bet that its price would fall, to buy it in
order to forestall even greater losses. Their
scramble to buy only adds to the upward
pressure on the stock's price
KEY TAKEAWAYS
*A


$BKE with a neutral outlook projected $BKE after its earning and a positive over reaction following its release, The PEAD projected a neutral outlook for the stock placing the stock in Drift B
If you would like to see the Drift for another stock please message us. Also click on the Like Button if this was useful and follow us or join
BKE CLEARED RESISTANCE UP ON STRONG VOLUMENYSE:BKE
BKE cleared resistance and heading towards next level representing roughly a 15-19% gain. Strong momentum at the moment considering they have had 5th straight month of sales increase. Interesting given COVID 13 week fiscal quarter sales ending Oct 31 2020 jumped 12%to 251M from 224.1M.

BKE: no clear direction yet, on watchGood earnings but not clear at this point. Has to hold the level above 19.60 and to hold above 200 sma
On watch as bullish scenario. If holds, it has potential to go to 24

BKE: Ascending triangle. Waiting for confirmationAscending Triangle
Waiting for confirmation after break out
Pros
R/R ratio above 8
ER = good
Descending volume during formation
High volume at breakout
Crossed 200MA (but came back)
PPS above 50MA
250RSI almost 50
ATR climbing, more volatility
Cons
200MA descending
PPS below 200MA
Gigher price rejec
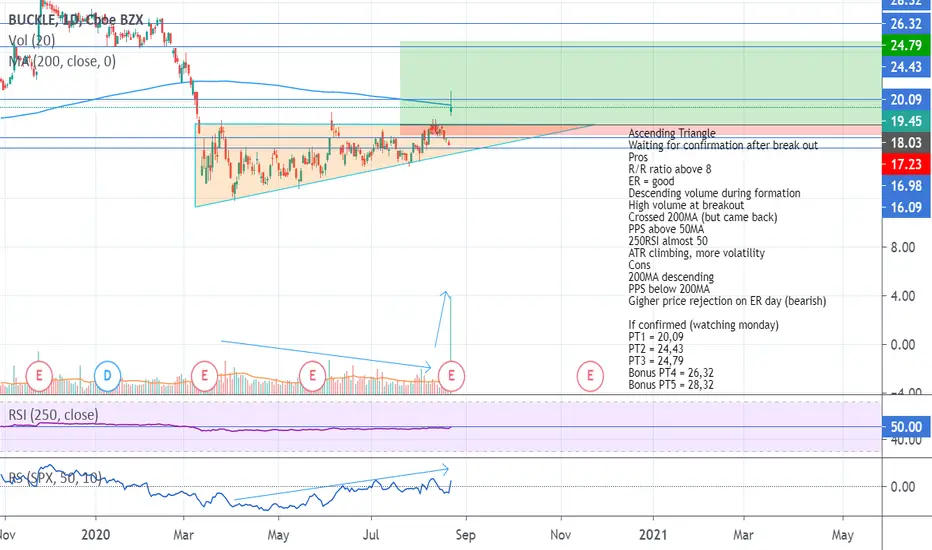
Set stop buy at 16.50Nice consolidation here with high short interest (>30%). A break above 16 might trigger a short squeeze

Buckle Up for a Wide Ride!
What I see...
+ Side way move within channel since prices hit bottom back in early April
+ Reversal candle with confirmation painted last week
+ Triple NR7 bars with descending vol., followed by a wide range bar with higher vol.
+ 10ma is crossing 50ma
+ MACD is about to turn bullish!
+ RSI is at

See all ideas
An aggregate view of professional's ratings.
Neutral
SellBuy
Strong sellStrong buy
Strong sellSellNeutralBuyStrong buy
Neutral
SellBuy
Strong sellStrong buy
Strong sellSellNeutralBuyStrong buy
Neutral
SellBuy
Strong sellStrong buy
Strong sellSellNeutralBuyStrong buy
Displays a symbol's price movements over previous years to identify recurring trends.
Frequently Asked Questions
Depending on the exchange, the stock ticker may vary. For instance, on SWB exchange Buckle, Inc. stocks are traded under the ticker BK2.
We've gathered analysts' opinions on Buckle, Inc. future price: according to them, BK2 price has a max estimate of 47.08 EUR and a min estimate of 47.08 EUR. Watch BK2 chart and read a more detailed Buckle, Inc. stock forecast: see what analysts think of Buckle, Inc. and suggest that you do with its stocks.
Yes, you can track Buckle, Inc. financials in yearly and quarterly reports right on TradingView.
Buckle, Inc. is going to release the next earnings report on Mar 13, 2026. Keep track of upcoming events with our Earnings Calendar.
BK2 earnings for the last quarter are 0.83 EUR per share, whereas the estimation was 0.83 EUR resulting in a 0.86% surprise. The estimated earnings for the next quarter are 1.27 EUR per share. See more details about Buckle, Inc. earnings.
Buckle, Inc. revenue for the last quarter amounts to 278.09 M EUR, despite the estimated figure of 278.54 M EUR. In the next quarter, revenue is expected to reach 284.67 M EUR.
BK2 net income for the last quarter is 42.21 M EUR, while the quarter before that showed 39.42 M EUR of net income which accounts for 7.07% change. Track more Buckle, Inc. financial stats to get the full picture.
Yes, BK2 dividends are paid quarterly. The last dividend per share was 2.89 EUR. As of today, Dividend Yield (TTM)% is 2.69%. Tracking Buckle, Inc. dividends might help you take more informed decisions.
Buckle, Inc. dividend yield was 2.94% in 2024, and payout ratio reached 36.03%. The year before the numbers were 3.69% and 31.80% correspondingly. See high-dividend stocks and find more opportunities for your portfolio.
As of Feb 9, 2026, the company has 8 K employees. See our rating of the largest employees — is Buckle, Inc. on this list?
EBITDA measures a company's operating performance, its growth signifies an improvement in the efficiency of a company. Buckle, Inc. EBITDA is 244.07 M EUR, and current EBITDA margin is 21.71%. See more stats in Buckle, Inc. financial statements.
Like other stocks, BK2 shares are traded on stock exchanges, e.g. Nasdaq, Nyse, Euronext, and the easiest way to buy them is through an online stock broker. To do this, you need to open an account and follow a broker's procedures, then start trading. You can trade Buckle, Inc. stock right from TradingView charts — choose your broker and connect to your account.