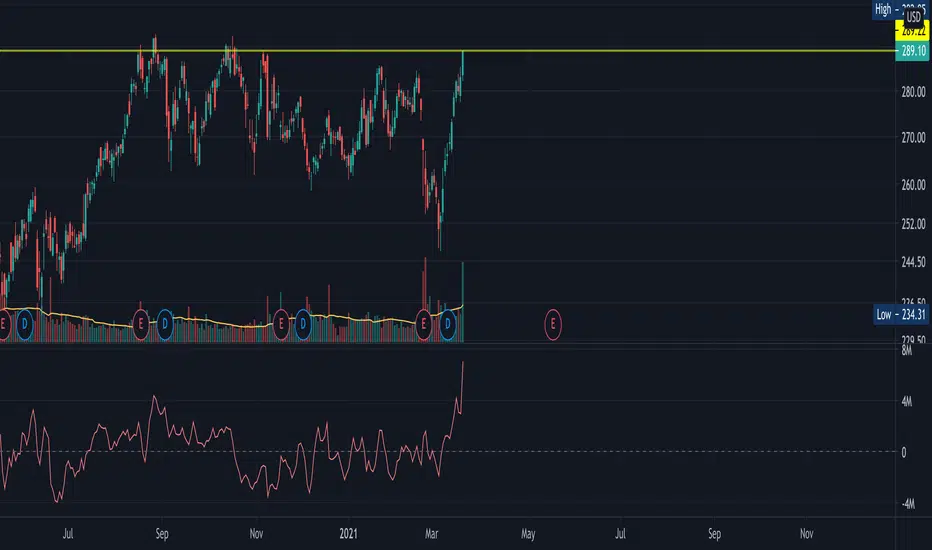
HD looking very strongHD has been flying since the low on March 5th. It looks strong enough to go for an ATH.
Home Depot, Inc.
No trades
Trade ideas
Sell HomeDepot at 295$ to 270$ price targetOpen SHORT position at HD for +10% gain of drop 295$ to 270$.
Reasons - rates US 30 T is 1.8% and ifliation risks acure, it will demolish all benefits for homebuilders and customers whom will spend thier new income for travel and leasure not for building and fixing. It will lagging 2-3 month until in will be obveous, hard to anylise particular time when banks and porfolio managers makes this clear for all, but 2-3 month not so long time to start creat position right now.
Look to my previous ideas. It's high rate analysis.
Don't buy for whole amount, just 10% is ok.
Make your own research and create own opinion.

HD (NYSE) - When it breaks, price go up
Greetings
Humbled, we would like to thanks for your support who has already liked, commented and followed us. Your support, strengthens us, to help in analyzing the market. If you have any questions, feel free to send us message (inbox).
Pra Trading :
- Please care for Money Management
- Have a good psychology
- Do not be hurry to open position and do not do nothing if u see opportunity
- Evaluate and upgrade your trading plan
Execution Strategy :
- Know what you want to buy, see the Fundamental
- Decide that you are on investing or speculating
- Consider what your strategy based on Investing/Speculating
- Make Road Map Of Your Trading Plan
- Decide
a. Entry strategy
b. Cut loss
c. Target of Profit
Post Trading :
a. Do not be sad if you loss or do not be very happy if you win
b. Just become a normal without emotion, Do not put emotion into your trading
c. Evaluate your trading
d. Keep on Learning
e. Be Humble
Idea :
HD (NYSE) - When it breaks, price go up
Note :
1. This is just a road map
2. After u know the rod map, u need to decide what is the entry strategy, and exit strategy where we do not explain here. if u will know more, let send us message
3. If your information/knowledge is intermediate, it is very dangerous to do trade.


HD to $300HD, or Home Depot, broke out of a strong channel today. This is very bullish, and by taking the mouth of the channel (the first purple rectangle) and moving it up to the breakout point we get a breakout target of somewhere between $300-$306. I personally went long here and will take profits around $299.

HD - 290 ? HD above 285.50 area with a strong break and we could be testing next strong support @ 290 range.

Great run, and now is shorting timeI have been eyeing this for days, HD has been on a mission for over a week now. Historically, each time the price level is reaching the supply zone it got a good pullback and from technicality, it needs a healthy pullback before going higher. Combined Powell to speak and quad witching Friday, I am confident to see the downside. I opened a small position 282.5P 3/26


HD - Great stock with high dividends! Buy and thank me laterWe have a clean 5 wave impulsive move from the March 2020 low to August, followed by a clean 3 waves correction .
Classic chartist among you can see a clean Bull Flag .
I will maintain my bullish outlook as long as price doesn't close below 247!
Trade it according to your own methodology.
Personaly I'm already positioned and will look to add a bit on a pullback and once price breaks above the channel.
My targets are 325 at first, followed by 380 and 500 next but it will probably take some time before reaching that level.
Anyhow, Risk/Reward is a good 1/2.5 if buying now and going for the first target only, so I see no reason not to look to buy this stock.

HD - Possible Swing OpportunityHD is currently at a strong R/S zone.
If HD can hold/break above the $269 area price, we could be looking at a $275 PT.
Things to look for other than confirming the support/resistance area:
*in no specific order*
1) breaking levels with above average volume
2) overall market index strength
3) It's currently testing the 100 EMA as well which makes watching how it reacts at these levels that much more important before jumping in.
4) if stimmy does pump market all sectors could see an increase, but it may leave Dow stocks lagging a bit
What are your thoughts on HD?
Play, or Nay?

where doers get more done...too bad this stock decided to not get more done in Q3& Q4 2020. Although $1,400 might be a sweet down payment on a set of new kitchen cabinets & appliances. The well-to-do cohort who are getting stimulus money + near-6-figure salaries are upgrading their homes; they re-financed at 2.75%, rolling in home equity and probably shorting meme stonks as we speak. Fact remains, when you remodel, it's never ending unless you sell that turd and buy a new ultra modern.
Eyeing the Aug 20 300,00 calls & picking up shares when the S&P throws a taper tantrum. HD was weak after last earnings, anticipating lackluster results next go-round as well. But cheer up buttercup. Parking lots are full at HD vs near-empty at Lowes in my town. I'm in this store quite often. I do my channel checks, that said, traffic doesn't necessarily mean business will be rip-roaring; lumber prices are a racket at the moment. HD's margins are in their kitchen & flooring departments...

HD 3/9completed a wxy correction where Y = 1.618 of W. Daily divergence on rsi + macd about to cross.
PTs on chart

HOME DEPOT LOOK FOR A NEW HIGH VERY SOON The drop in home depot now has two legs down and are equal based on a % decline .I am now net long 75% .and a positive divergence at the low on the daily rsi


HD to retrace before going down further to 240-250 levelThis is a HD's daily chart.
Had a false breakout, and it is now retracing. Price also bounce of 50MA on the Weekly chart.
Looking to short it when price reaches 270 level. It should also coincide with the 20/50 MAs. Stoch RSI should also reach overbought (80) level.
If price continues to trend higher, then it might go back to 280-285 level i.e. the high of the range or where the trend line meets.
if shorting at 270 level is successful, then target profits are 250 & 240. If not, then wait for price reversal pattern at a lower time frame. I prfer the 1H chart.
280, 285 and 290 are 3 levels to look at for price reversal pattern at 1H
But if price only reverse at 285 or 290 levels, then target profits are the low of the range i.e. 260 level.
If you manage it right, risk-to-reward should still be in your favor.
If you have any symbol that you'd like me to analyze, feel free to drop a comment.
Thanks!

HD -- I was in in it...But the market is throwing us some curve balls so we may see this trend break lower. I took my meager profits and went to cash, waiting for an all-clear. This is a waaaay over-sold stock in solid company. From the chart we can see clouds ahead, but I respect this company enough to see it break above, at some point. Just not at this exact moment.


$HD with a slight bullish outlook following its earnings #StocksThe PEAD projected a slight bullish outlook for $HD after a negative under reaction following its earnings placing the stock in drift D
If you would like to see the Drift for another stock please message us. Also click on the Like Button if this was useful and follow us or join us.

HD Channels. Bounced off a vein at 255. Bullish til 3/19 witchToo many catalysts working in HD's favor. RSI dropped extremely low today. Picked up 257.5c. Riding this out according to these channels. Should see sells / tests on each line. As the market is bullish I see no reason why HD can't break through with enough volume. Cheers.

wowbottom of a wedge
low rsi
low macd
healthy dow
what
dont listen to trading view how will Home Depot not rebound think abt it

Traditional|HD|LongLong HD
Activation of the transaction only when the blue zone is fixed/broken.
The author recommends the use of anchoring fixed the blue zone, this variation is less risky.
If there is increased volatility in the market and the price is held for more than 2-3 minutes behind the activation zone after the breakdown, then the activation of the idea occurs at the prices behind the activation zone.
The idea is to work out the resistance level .
* Possible closing of a trade before reaching the take/stop zone. The author can close the deal for subjective reasons, this does not completely cancel the idea and is not a call to the same action, you can continue working out the idea according to your data, but without the support of the author.
+ Maybe right now we will go even lower, then it's okay, the idea is not activated and simply canceled.
The "forecast" tool is used for more noticeable display of % (for the place of the usual % scale) of the price change, I do not put the date and time of the transaction, only %.
Blue zones - activation zones.
Green zones - take zones.
The red zone - stop zone.
Working out the stop when the price returns to the level after activation + fixing in the red zone.
Orange arrow - the direction of take.
Black arrow - neutral scenario without activating the trade.
The red arrow - the direction of the stop.
SUM PNL: This parameter displays the total % of all closed ideas of the "new" format (according to the author) for this sector at the time of publication of the idea. The calculation is very "clumsy" just the sum of the profits of all the ideas, based on this indicator, you can more accurately assess the risks when working with my ideas of this sector. I present you the construction of the idea, you can use it yourself as you like based on your subjective view and risks, the calculation of the PNL indicator is carried out only on transactions that the author closed on TV in manual mode or by take.
P.S Please use RM (risk management) and MM (money management) if you decide to use my ideas, there will always be unprofitable ideas, this will definitely happen, the goal of the system is that there will be more profitable ideas at a distance.

$HD - Nice flag on dailyTrying to break out of recent range on daily.
Nice flag formation.
Holding above volume shelf.
Breakout should be good for another 50 points above ATH.
