Trend Score Daily Review (9-5-25) $UNH $BX $HDHere are 10 stocks found in the trend score HTR raw data pine screener as confirmed bullish on Sep 5th 2025.
BX CDW HD INTU LEN MTCH NCLH SWK UNH WSM
Market Review: BX, CDW, HD, INTU, LEN, MTCH, NCLH, SWK, UNH, WSM
These ten companies represent a cross-section of the U.S. economy, spanning finance, technology, home improvement, consumer goods, healthcare, travel, and housing. They are all mid-to-large cap U.S. equities, most of which are components of the S&P 500. Together, they provide a pulse on key sectors influencing the broader market.
⸻
Shared Themes
1. Economic Sensitivity:
Most of these companies are tied to consumer confidence and discretionary spending. Home improvement (HD, WSM), housing (LEN), travel (NCLH), and dating apps (MTCH) tend to rise when consumers are optimistic and pull back during downturns.
2. Interest Rate Impact:
Rising interest rates weigh on housing (LEN), discretionary retail (WSM), and leverage-driven businesses like BX. A rate-cutting cycle would provide a significant boost to these sectors.
3. Seasonal Trends:
Companies like HD and WSM see strong Q4 holiday-driven revenue, while NCLH benefits from travel peaks in spring and summer. BX and UNH are more stable, less seasonal, and driven by structural demand.
⸻
Performance & Predictions
UnitedHealth Group (UNH) – Healthcare
• Recent Movement: UNH has experienced a steep decline, falling nearly 50% from mid-year highs due to rising healthcare costs and regulatory headwinds.
• Opportunity: Valuation has reset to attractive levels, and its diversified model through Optum positions it well for long-term growth. Once cost pressures stabilize, recovery potential is significant.
• Prediction: Likely to rebound over the next 12–18 months as healthcare demand remains resilient and valuation attracts institutional buyers.
⸻
Blackstone (BX) – Alternative Investments
• Recent Movement: BX has been consolidating near highs after strong gains earlier this year, reflecting investor interest in private equity and real estate despite macro uncertainty.
• Opportunity: With rate cuts on the horizon, BX could see deal-making and fundraising accelerate, boosting future earnings.
• Prediction: Moderate upside as capital markets loosen, making it a solid medium-term hold.
⸻
Home Depot (HD) – Consumer Discretionary / Housing
• Recent Movement: HD has been stable, supported by continued demand for home maintenance and upgrades, even as the housing market softens.
• Opportunity: A potential Fed rate cut cycle would revive housing activity and support HD’s growth.
• Prediction: Slow and steady performance with defensive characteristics, especially in a soft-landing economy.
⸻
Other Notable Names
• CDW (Tech Services): Benefiting from digital transformation trends, but growth may slow if corporate budgets tighten.
• LEN (Homebuilder): Highly sensitive to mortgage rates; could surge in a rate-cut environment.
• MTCH (Online Dating): Competitive pressures and slowing user growth limit upside near-term.
• NCLH (Cruises): Recovery play but exposed to consumer spending volatility.
• SWK (Tools): Struggling with margin pressure and lower construction demand.
• WSM (Retail): Strong brand but discretionary spending pullbacks weigh on growth.
⸻
Top 3 Long-Term Picks
1. UnitedHealth Group (UNH)
Deep value and strong recovery potential as healthcare remains a necessity-driven sector.
2. Blackstone (BX)
Positioned to benefit from a future rate-cut cycle and rising demand for alternative assets.
3. Home Depot (HD)
A defensive yet growth-oriented play that captures both stable home improvement demand and cyclical upside from housing recovery.
⸻
Final View
The current environment favors companies with structural demand, diversified revenue streams, and strong balance sheets.
• UNH offers a high-upside recovery story,
• BX provides exposure to institutional capital flows, and
• HD delivers steady performance with long-term housing tailwinds.
These three stand out as the most resilient and attractive investments for long-term growth.
ITU trade ideas

$INTU cross-selling strategy is not working as expected.- An integrated strategy across mailchimp <-> Quickbooks <-> Credit Karma <-> Turbotax
- It's taking longer than usual, cross-selling and networking effect between platform isn't meaningful despite lot of efforts.
- Valuation has always been rich but law of large number is coming to bite them. Earnings are expected to grow at a lower rate next year.
- Premium multiple needs to be moderated to account for slowdown in growth.
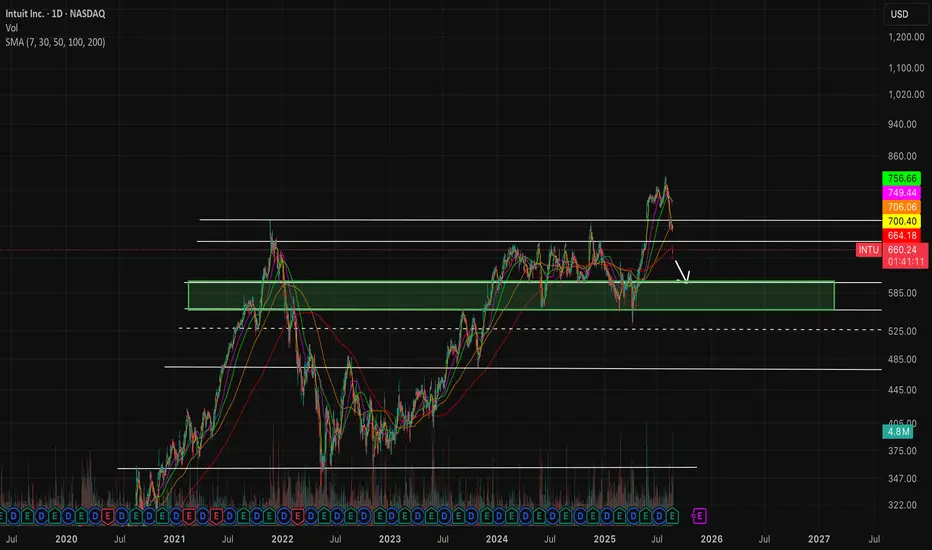
INTUIT: Strategic Opportunity After Multi-Year Resistance BreaKINTUIT: A Strategic Opportunity After Multi-Year Resistance Break
First Impressions: Standing at a Critical Decision Point
Looking at these Intuit chart, I get that familiar feeling every investor knows, am I looking at opportunity or danger?
After years of testing a massive resistance zone around $700-750, INTU finally broke through to new all-time highs earlier this year. But now, like many growth stocks in this AI-driven market, it's pulled back to test that same resistance level that held it captive for years.
This is the kind of moment that separates patient investors from those who chase momentum. The stock has dropped about 15% from its recent highs around $790, and my gut reaction? This looks like a textbook retest of broken resistance turning into support, exactly what Chart Patterns teaches us to watch for.
Pattern Recognition: The Power of Multi-Year Resistance Breakouts
What immediately catches my eye is the multi-year resistance zone highlighted in white on the first chart. This isn't just any resistance level, it's been tested multiple times over several years , making it incredibly significant . When such major resistance finally breaks, the psychology shifts dramatically.
The pattern here follows a classic sequence:
Years of consolidation below the $700-750 resistance
Clean breakout to new highs around $790
Pullback to retest the broken resistance as new support
Strong buying interest emerging right at the support level (notice that green hammer candle!!). This kind of candle is what you must be looking for in this job.
This reminds me of a castle wall that finally gets breache, once you're through, that same wall becomes your fortress wall protecting you from attacks. The statistics support this view, resistance-turned-support levels have high reliability when they hold on retests. And furthermore, you can do a large profit by risking a bit, in this case you could earn a 20% by risking a 4%.
If we look the historical chart, it provides even more context with its long-term ascending trendline spanning over a decade. This shows Intuit's incredible 22% annualized return track record, which aligns perfectly with the company's fundamental strengths in financial software and recent AI innovations.
Analyst & Fundamental Context: The Numbers Tell a Bullish Story
This is where the Chart Patterns setup gets even more compelling . Wall Street analysts are remarkably bullish on INTU, with a consensus "Buy" rating and an average price target of $797-835. That's roughly 20-25% upside from current levels around $662.
Yes, that's exactly what technical analysis is telling us. A 20% bull run is more than posible here.
The fundamental backdrop couldn't be stronger:
Q2 2025 earnings crushed expectations with EPS of $3.32 vs. $2.58 expected
Revenue grew 17% year-over-year to $4 billion
Global Business Solutions segment up 19%, driven by AI-powered QuickBooks innovations
Credit Karma revenue surged 36%
What's fascinating is how the technical pullback contradicts the fundamental strength, classic market behavior where short-term fear creates long-term opportunity.
The company is executing flawlessly on its AI strategy with "Intuit Assist," yet the stock trades like there's fundamental weakness.
Investment Idea: A High-Probability Risk/Reward Setup
The Idea Setup:
Entry: Buy at market open around current levels ($662-665)
Stop Loss: Just below the support hammer candle at approximately $635 (4% risk). This is a very tight Stop Loss, but should be enough. If the price falls below the minimum price done Friday, I would prefer to invest in another stock.
Target: 20% return to $795-800 zone (no need to see new all time highs)
Risk/Reward Ratio: 5:1 (exceptional)
The Psychology Behind This Trade:
Think of this like buying a house in a great neighborhood that just got rezoned for higher value. The multi-year resistance breakout "rezoned" INTU to a higher valuation tier. Now we're getting a chance to buy at the old ceiling, which has become the new floor.
The green hammer candle that formed right at support tells a powerful story, institutional buyers stepped in aggressively the moment price touched this critical level. This suggests smart money recognizes the value at these levels.
Risk Management Strategy:
With only 4% downside risk to our stop loss, this setup offers asymmetric risk/reward. If the support fails, INTU would likely enter a more complex sideways range, but the long-term uptrend remains intact with that ascending trendline providing ultimate support. Remember, I'm trading to win in the upcoming weeks, not for the long run.
Timeline Expectations:
I expect this trade to play out over 2-6 weeks. We don't need new highs to make excellent money, just a return to the $795-800 consolidation zone where the stock can build a platform for its next move higher. The 20% target represents the distance back to where institutional resistance likely turns into support.
This is the kind of setup where patience meets opportunity. The market has given us a gift, the chance to buy a fundamentally strong, AI-powered growth story at a technical support level that has years of significance behind it. Sometimes the best investments are the ones that feel slightly uncomfortable in the moment but make perfect sense when you look at the bigger picture.

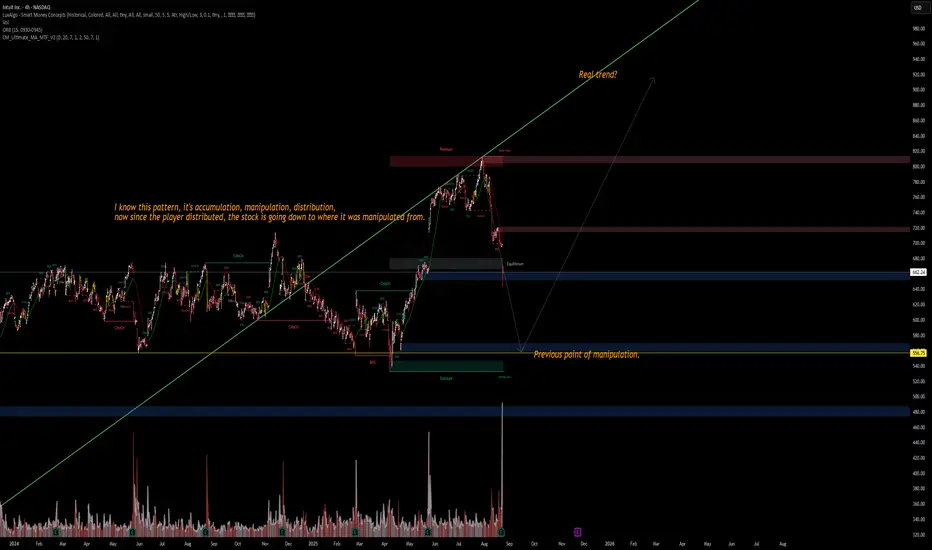
INTU – Market Structure Breakdown📉 INTU – Market Structure Breakdown
I recognize this setup:
Accumulation ➝ Manipulation ➝ Distribution.
After distribution at the premium zone, price is now breaking down toward the previous point of manipulation.
🔹 Current price: ~662
🔹 Potential downside target: 556–560 zone (previous manipulation base)
🔹 If broken further → risk of deeper move into 480–500 discount range
Key Observations:
Multiple Change of Character (ChoCH) and Break of Structure (BOS) signals confirming distribution.
Volume spikes align with manipulation phases.
Real trend may resume only after price returns to equilibrium zones.
⚠️ Watch for liquidity grabs around 600–610 before continuation lower.
👉 My bias: Short-term bearish, targeting 560, with a potential trend resumption later.
#INTU #Trading #SmartMoney #Stocks
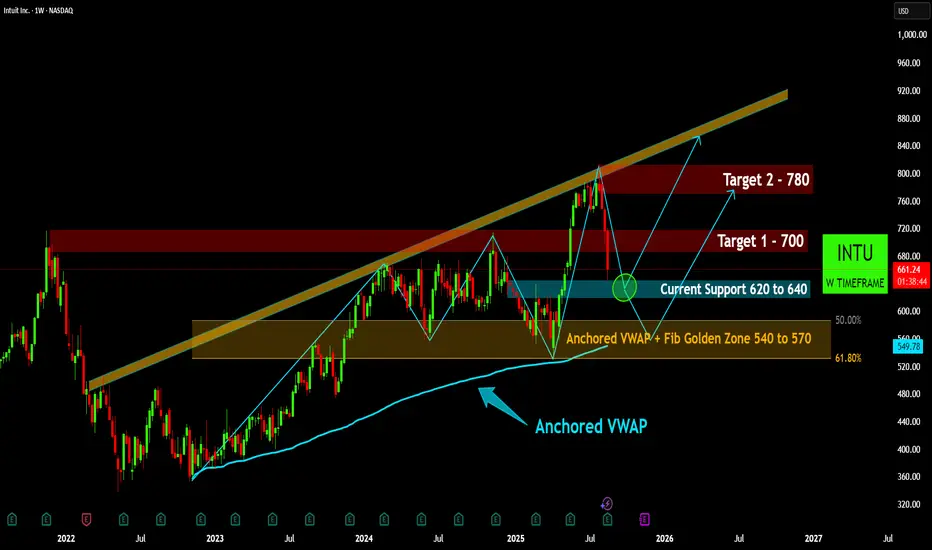
INTU Weekly: Testing Critical Support within Long-Term UptrendINTU Weekly: Testing Critical Support within Long-Term Uptrend
INTU demonstrates a robust long-term bullish trend, consistently trading within an upward-sloping channel on the weekly timeframe since early 2023.
Following a recent peak, the stock is currently testing the "Current Support" zone between
620-640, an important area for potential bounce and trend continuation.
Should the immediate support fail, a more significant and robust support confluence lies within the "Fib Golden Zone" (540-570), reinforced by the long-term Anchored VWAP.
If current support holds, initial upside targets are identified at $700 (Target 1) and $780 (Target 2), with the potential to eventually re-test the upper boundary of the long-term channel.
A dive into INTU (Intuit Inc.) seasonality and fractal analysisinto <> intu .... haha. me funny dude...
Here you can see my prjection for the price upmove.
It is based on seasonality which should give us some positive boost with high propability for the rest of the year.
In addition I how to have identified 2 fractals correctly which support the idea of an upmove from at least 15%.
Upmove going to start now or after closing the gap (see chart)
Feel free to contact me, to like/support the idea or discuss in the comments.
Cheers!
*this is not a trade call and no financial advice in any way. just for educational purpose...
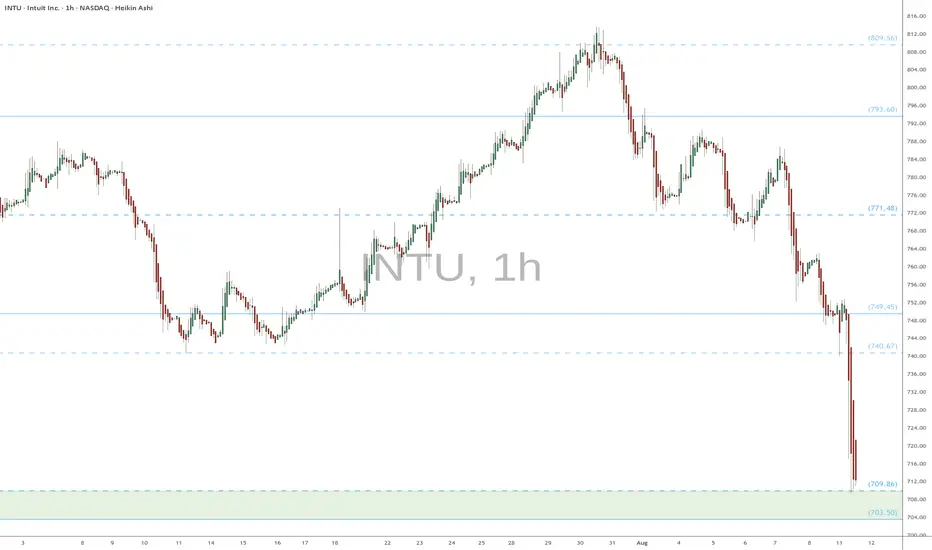
INTU watch $703-709: Support zone may hold for retrace EndPoint INTU has been retracing from its run to new All Time Highs.
It just just hit a dual fib support zone at $703.50-709.86
Looking for a stall here into accumulation before lift off.
.
Previous analysis that caught a HUGE BREAKOUT to record highs:
Hit the BOOST and FOLLOW for more such PRECISE and TIMELY charts.
============================================================
.
Juggernaut to ATH PT : $750-850- Absolute juggernaut of a company. Top tier management and solid execution lately deserves premium valuation.
- NASDAQ:INTU is moving up market i.e targeting on mid markets as compared to just focussing on SMBs ( Small & Medium Sized Businesses )
- Company has a MOAT all those FUD regarding simplification of tax laws/rules was overblown.
- Company should do well irrespective of the MACRO. Even, if US enters recession, People gotta file taxes and do accounting. Some segments will show weakness in case of recession like Mailchimp and Credit Karma. But TurboTax and Quickbooks are all weather products.
- Final take: NASDAQ:INTU should break to all time highs if the upcoming quarter impresses.
- PT: 750-850

INTU watch $607-610: Double Golden zone and Major Milestone INTU recovering nicely and is pretty much tariff-proof.
Currently testing a Double Golden zone $ 606.75-610.16
This if often a major milestone in the lifetime of any asset.

$INTU with a bullish outlook following its earnings #StocksThe PEAD projected a bullish outlook for NASDAQ:INTU after a positive under reaction following its earnings release placing the stock in drift A with an expected accuracy of 71.43%.

Beat and Raise?Intuit has been a monster over the last few years raising prices continuously to folks for a product that is amazingly stick, If they beat and raise firmly believe they will clip an ATH of 750 plus in short order.. down side is probably 620 range in short order if other side wins.

Intuit Inc. (NASDAQ: INTU) Surges 8% on Strong Earnings BeatIntuit Inc. (NASDAQ: INTU), a leading provider of financial management, compliance, and marketing solutions, saw its stock surge 8% in premarket trading following an impressive earnings beat. The company’s strong financial performance, coupled with increasing demand for its AI-driven financial services software, has positioned NASDAQ:INTU for a potential breakout.
AI Expansion and Tax Season Demand
Intuit, the maker of TurboTax, QuickBooks, and Credit Karma, has been capitalizing on the growing demand for AI-powered financial solutions. The ongoing tax season in the U.S. has further boosted demand for its software, with the bulk of tax filings expected in Q3.
In its latest earnings report, Intuit exceeded Wall Street expectations, reporting second-quarter revenue of $3.96 billion, surpassing the estimated $3.83 billion. Adjusted earnings per share (EPS) came in at $3.32, significantly outperforming estimates of $2.58. However, while Intuit’s Q3 revenue forecast of $7.55 billion–$7.60 billion surpassed the analyst consensus of $7.51 billion, its adjusted profit per share projection of $10.89–$10.95 fell short of the expected $11.48.
Despite workforce reductions in 2024, Intuit rapidly filled vacant positions, underscoring its operational efficiency and ability to scale talent acquisition. The company's AI-powered assistant, Intuit Assist, launched in November 2024 for QuickBooks, is further streamlining tax and financial management tasks, enhancing productivity for small businesses and individuals alike.
Technical Outlook
As of the time of writing, NASDAQ:INTU has surged 8% in premarket trading, forming a bullish engulfing pattern. The stock had previously closed down 2.2% in the last session, trading below key moving averages (MA). However, this premarket jump places NASDAQ:INTU on the cusp of a breakout.
Key technical indicators suggest room for further upside:
- Relative Strength Index (RSI): Currently at 54, indicating ample room for continued bullish momentum before entering overbought territory.
- Fibonacci Retracement Support: The 38.2% Fibonacci retracement level is acting as a key support zone, potentially providing a cushion against pullbacks.
- Breakout Potential: A decisive move above the 1-month high could push the stock toward the 38.2% Fibonacci extension zone, paving the way for new resistance levels and a sustained bullish run.

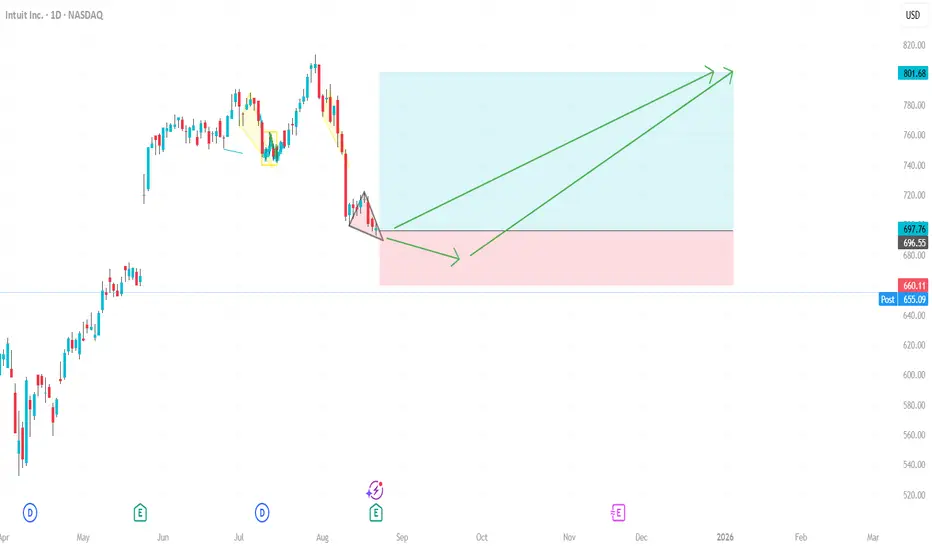
$INTU calls for retest, B+ setupNASDAQ:INTU — looking really good here, green close on the daily and a green closing candle on the weekly.. I see a retest of $600 coming I think before earnings next week 2/25 I think it is. I like calls for this. Very nice setup.

INTUIT could recover for circa 3-5% upsideShort & Medium-Term Outlook
Trend Analysis:
• Short-Term (Current Price Action):
• The stock has recently found support around the $600-$610 range and is attempting a bounce.
• The green arrow and projection indicate a potential upward move of circa 5% to $638, which aligns with the next resistance level based on recent price action.
• The moving averages (short-term and medium-term EMAs) show a downward trend, but the current price is attempting to reclaim the shorter EMA.
• Momentum indicators suggest a potential short-term reversal.
Trade Setup:
Short-Term Targets:
• Upside Target: $638 (potential 5.07% move)
• Downside Risk: $600 support zone
• Trade Probability: Moderate, with an entry bias confirmed by improving momentum indicators.
Medium-Term Targets:
• Upside Resistance: $660-$675 if bullish momentum continues beyond $638.
• Downside Support: $580 (next major support if current bounce fails).
Lets keep an eye on this
• Short-Term (Next 15-21 Days):
• Expect a potential bounce towards $638 if bullish momentum holds, with a cautious outlook due to moderate trend strength.
• A break below $600 invalidates the bullish scenario.
• Medium-Term (2-3 Months):
• A sustained move above $638 could push the stock towards $660-$675.
• Failure to hold current levels may see a retest of lower support near $580.

Potential INTU Stock Movement: Watch for a Breakout ConfirmationI anticipate that NASDAQ:INTU (Intuit) may exhibit a bullish move if it re-enters the ascending channel (black) and successfully retests it. This could pave the way for a rise toward the midline of the channel.
The key condition? Holding above the red range (horizontal support zone). Any break below this range, especially with increased volume, could invalidate the setup.
For confirmation, it's crucial to monitor price action closely, including candlestick patterns and volume behavior during key levels. If these align, the stock could be gearing up for significant upward momentum.
#INTU
#StockAnalysis
#TechnicalAnalysis
#StockMarket
#TradingView
#SwingTrading

1/2/24 - $intu - need low $500s or else gl sidelines 4 me1/2/25 :: VROCKSTAR :: NASDAQ:INTU
need low $500s or else gl sidelines 4 me
- will keep it short and sweet like my post in may '24
- good name. think they will continue to lead their tax and biz planning niche
- but at >30x PE and growing mid teens at best, i simply have to ask "is that the best (you) or i could do?"
- i mean NVDA is similarly trading w/ better ebitda mgns and valued similarly on PE but growing at 40+% -> THAT's the benchmark. and it's the question i posed as my look ahead about "why NASDAQ:AAPL when you could pay the same and own NASDAQ:NVDA with 3-4x the growth and not have to deal with a cracked out consumer"
- i reviewed this one tn as someone recommended the long NASDAQ:INTU and short NYSE:CRM pair. i "like" the idea of pair trades, but probably more on a professional level as i used to carry more positions and manage risk differently.
- i genuinely don't think NASDAQ:INTU OR NYSE:CRM are shorts - but i think they're probably mediocre growers? (index trackers) at best, maybe that's 10-15% and "cool". but again.... you could do better. and if it's a 1-2% position only... why the distraction to my PnL
- so where do i become more interested? probably in the mid 20s PE which would be about 20% lower. chances are, however, *if* we got there... i'd probably want to own some higher quality names that are maybe off 5-15% and not the 20% dip in stuff like NASDAQ:INTU or $crm.
- but alas, quarterly reports can offer weird dips as we've learned. mkt is acting a lil cray these days. so. this is just a note to myself (and to anyone who cares) that i'm just not going to trade this unless we at least get below $550, but realistically i'm probably not a buyer until $500... and if we get there, maybe something's straight broken.
- i'm watching, things can change
- if u own it and like it and see it differently - always like to hear the alternative. i'm rooting for you, really.
V

INTU DISTRIBUTIONI clearly missed my entry point but I am posting this idea for visualization. I am seeing this curve or basing possibly coming into fruition. Key point was the flooring being created across the weeks/months near the 610 - 600 range but also the pivot or peak formation between 700 - 710 range giving indication of a possible backside of the distribution curve the failure following at the 680 level added context/confirmation. The 1D & 1H shows the MA (s) being to our backside which turns this trade/setup to something worth watching. We will see how it goes.

The PEAD projected a bullish outlook for $DIS after a positive uThe PEAD projected a bullish outlook for NASDAQ:INTU after a negative under reaction following its earnings release placing the stock in drift D with an expected accuracy of 75%.

ARE YOU INTUIT?! Trade setup!ARE YOU $INTUIT ?! Trade setup!
1️⃣ MY #HIGHFIVESETUP trading strategy
2️⃣ Ascending Triangle Pattern
3️⃣ My plan for this trade
Short🎯 $703
Med. 🎯 $870
Long 🎯 $1070
Chart 3/5 dropping
Do you like this trade setup?
NFA AMEX:SPY #tradingstrategy
NASDAQ:INTU

INTU - 9 months HEAD & SHOULDERS══════════════════════════════
Since 2014, my markets approach is to spot
trading opportunities based solely on the
development of
CLASSICAL CHART PATTERNS
🤝Let’s learn and grow together 🤝
══════════════════════════════
Hello Traders ✌
After a careful consideration I came to the conclusion that:
- it is crucial to be quick in alerting you with all the opportunities I spot and often I don't post a good pattern because I don't have the opportunity to write down a proper didactical comment;
- since my parameters to identify a Classical Pattern and its scenario are very well defined, many of my comments were and would be redundant;
- the information that I think is important is very simple and can easily be understood just by looking at charts;
For these reasons and hoping to give you a better help, I decided to write comments only when something very specific or interesting shows up, otherwise all the information is shown on the chart.
Thank you all for your support
🔎🔎🔎 ALWAYS REMEMBER
"A pattern IS NOT a Pattern until the breakout is completed. Before that moment it is just a bunch of colorful candlesticks on a chart of your watchlist"
═════════════════════════════
⚠ DISCLAIMER ⚠
Breakout Area, Target, Levels, each line drawn on this chart and any other content represent just The Art Of Charting’s personal opinion and it is posted purely for educational purposes. Therefore it must not be taken as a direct or indirect investing recommendations or advices. Entry Point, Initial Stop Loss and Targets depend on your personal and unique Trading Plan Tactics and Money Management rules, Any action taken upon these information is at your own risk.
═════════════════════════════

INTUINTU stock – You want it quickly, the price is about to explode. The time for the move has come.
Entry: $611 - $651
Stop Loss: Close below $590
Target 1: $729
Target 2: $931

INTU Range low to highBullish on INTU at range lows. Price trading inside of May range. Targeting 50% of 8/19 week's range.

Intuit Inc. ($INTU) Announced its Fiscal 2025 Revenue ForecastIntuit Inc. (NASDAQ: NASDAQ:INTU ), the financial software powerhouse behind popular products like TurboTax, QuickBooks, and Credit Karma, is betting big on artificial intelligence (AI) to drive its future growth. The company recently announced its fiscal 2025 revenue forecast, projecting earnings slightly above Wall Street expectations, buoyed by increased demand for its AI-powered financial management tools. This optimistic outlook comes despite a rocky start to the year, highlighted by significant workforce restructuring and fluctuating investor confidence.
AI-Powered Growth Amidst Market Challenges
Intuit’s forecast of $18.16 billion to $18.35 billion in revenue for fiscal 2025 suggests confidence in its AI-driven offerings. These tools, which include personalized financial recommendations and task automation, have seen growing adoption among consumers and businesses alike. The company’s CEO, Sasan Goodarzi, highlighted this momentum, particularly in products like QuickBooks Online and QuickBooks Advanced, which have been central to their growth strategy.
However, not all news has been rosy. Despite an initial surge in after-hours trading following the announcement, Intuit's stock took a sharp turn, closing down 0.78% on Thursday. Investors were spooked by a lower-than-expected first-quarter revenue growth forecast, which the company attributed to its transition of QuickBooks desktop products to a recurring subscription model. This change is expected to dampen first-quarter revenue by approximately $160 million.
Strategic Restructuring and Workforce Changes
Intuit’s push towards AI innovation has not come without costs. In July, the company announced a 10% reduction in its workforce, translating to roughly 1,800 employees. This move was part of a broader restructuring effort aimed at streamlining operations and refocusing resources on high-growth areas, particularly AI.
Interestingly, even as it trimmed its workforce, Intuit has been on a hiring spree, adding nearly 1,000 new employees focused on AI. This dual approach underscores the company’s commitment to staying at the forefront of technological innovation while maintaining operational efficiency.
Strong Financial Performance Despite Market Volatility
Despite the recent market volatility, Intuit’s financial performance has remained strong. For the fourth quarter of 2024, the company reported revenue of $3.18 billion, beating analysts’ estimates. Excluding certain items, Intuit earned $1.99 per share, surpassing the expected $1.84 per share. For the full fiscal year, Intuit’s revenue grew by 13% to $16.3 billion, with the Small Business and Self-Employed Group leading the charge with a 19% increase in revenue.
The company also announced a new $3 billion share repurchase authorization, signaling confidence in its long-term growth prospects. This buyback, coupled with the company’s strong cash flow, provides a solid foundation for future growth, even as it navigates the challenges posed by its ongoing transformation.
Technical Outlook
Intuit (NASDAQ: NASDAQ:INTU ) stock has experienced a decline of 0.80% in Friday's premarket trading. However, there is a glimmer of hope suggested by the Relative Strength Index (RSI) currently at 60, indicating a potential favorable trend reversal despite the aforementioned decrease in Friday's market trading.
Looking Ahead: Navigating a Complex Future
As Intuit (NASDAQ: NASDAQ:INTU ) continues to innovate and expand its AI-driven offerings, the company faces a complex future. The transition to a subscription-based model for QuickBooks and the broader adoption of AI tools will be critical to sustaining its growth. While short-term challenges, such as the anticipated dip in first-quarter revenue, may cause fluctuations in its stock price, Intuit’s long-term outlook remains promising.
With its strong financial foundation, strategic focus on AI, and ongoing efforts to optimize its operations, Intuit is well-positioned to capitalize on the growing demand for digital financial management tools. Investors and market watchers will be closely monitoring how the company navigates the evolving landscape, balancing short-term pressures with its long-term vision.
In conclusion, Intuit’s fiscal 2025 forecast reflects both the opportunities and challenges ahead. As the company doubles down on AI and adapts to market demands, it will need to maintain its focus on innovation and operational efficiency to achieve sustained growth and deliver value to its shareholders.
