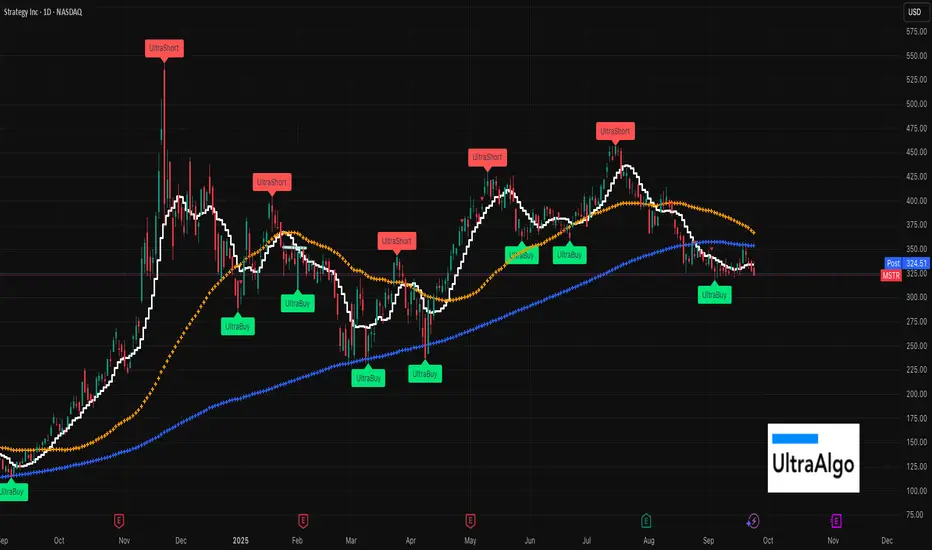
Put sale on MSTR againMSTR is at the 50 ema on a weekly. 3 bear candles in a row. Nice pull back. BITCOIN has made all time highs and this hasn't even REMOTELY caught up yet. So you can use some of the premium to buy a few shares as well. :)
Trade ideas

MSTR US🌎MicroStrategy pioneered the use of Bitcoin as a corporate reserve asset. This strategy transformed MSTR from a traditional technology company into a unique hybrid: a provider of analytics solutions and a publicly traded instrument for indirect exposure to Bitcoin.
As of September 2025, the company's reserves totaled 636,505 BTC, equivalent to approximately $70 billion and representing approximately 2.6% of the total Bitcoin supply globally. This makes it the largest corporate holder of Bitcoin.
To accumulate this amount, the company employed an aggressive financial strategy, including issuing convertible debt and, more recently, issuing preferred shares.
mNAV Premium. One of the most important metrics for MSTR's valuation is mNAV (Multiple on Net Asset Value). It is calculated as the ratio of a company's market capitalization to the dollar value of Bitcoin on its balance sheet. A high mNAV means the market values the company significantly above the value of its Bitcoin reserves, allowing it to attract cheap capital for further acquisitions.
Operating revenue remains relatively stable at approximately $463 million.
Gross margin over the past 12 months has remained at approximately 70%.
Net income is highly volatile due to adjustments for Bitcoin price fluctuations. In 2023, the company reported a net income of $429.1 million, but for 2024, it recorded a loss of -$1.17 billion.
OCF -$53.7 million
Debt 8.16 B
cash 0.05 B
Debt can be repaid by selling a portion of the Bitcoin held on the balance sheet.
MSTR Headed to Balance Sheet Insolvency?If my wave forecast is correct and BTC trades down toward $23K (ie. 80% log retracement level of the 2023-2025 bull run), MicroStrategy (Strategy) becomes balance sheet insolvent: liabilities (convertible debt + preferreds like STRK/STRF/STRD/STRC) would exceed assets.
That doesn’t mean automatic bankruptcy. Their convertibles only cost ~$35M/yr in interest, and even with ~$550–$680M/yr on ~$6.43B at 8–10% in preferred dividends layered on top, they can still cover fixed obligations short-term by liquidating BTC or issuing more equity. That keeps them out of Chapter 11 in the near term.
But the trade-off is ugly:
Massive dilution from issuing stock at distressed prices, or
Selling BTC at $23K just to stay afloat.
The real problem is the refinancing wall starting late 2027. With equity wiped on paper and ~$1.1B coming due by early 2028, any refinancing deal will be extremely punitive, handing creditors cheap equity or forcing fire-sale BTC disposals.
Market pricing implication:
Equity = option value only.
Common stock would likely collapse into deeply distressed single digits (<$10), well below NAV, because shareholders sit behind $8.2B in converts and $6.4B+ in high-yield preferreds.
So even if BTC really does retrace all the way to $23k, MSTR doesn’t go to $0 right away, but the stock trades like a distressed, over-leveraged call option on Bitcoin, with survival depending entirely on a rebound before maturities hit.
BTC Forecast:

Microstrategy Is Still Pointing Higher For The Final 5th WaveMicrostrategy is a US business intelligence and software company, but it has become best known for its aggressive Bitcoin strategy. Under co-founder Michael Saylor, the company shifted from focusing mainly on software to also using Bitcoin as its primary treasury reserve asset.
Since 2020, MicroStrategy has been steadily buying Bitcoin, often using debt or equity raises to finance purchases. Their strategy is based on the belief that Bitcoin is superior to holding cash, as it can act as a long-term store of value against inflation and currency debasement.
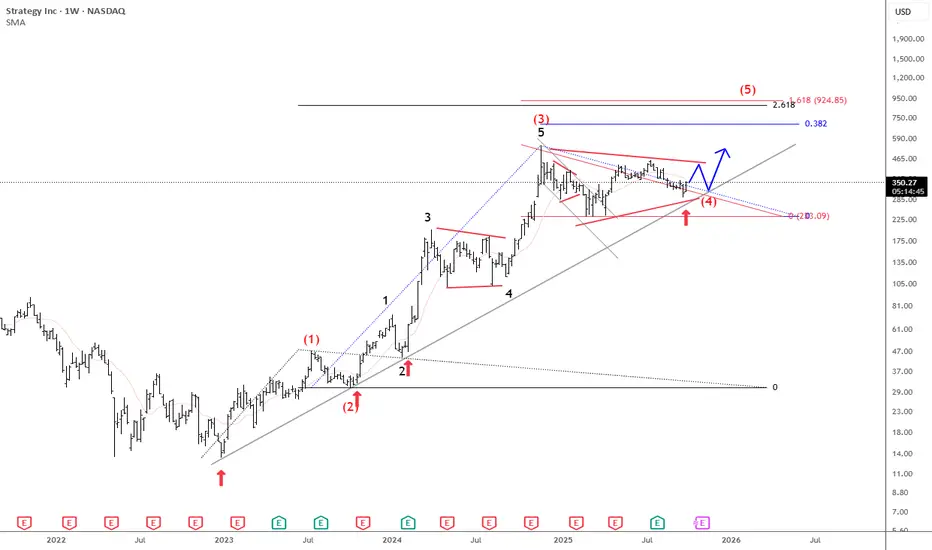
From an Elliott wave perspective, we see Microstrategy nicely holding above trendline connected from the 2022 lows, so it's still unfolding a five-wave bullish impulse. Currently, it's consolidating within a bullish triangle pattern in wave (4), and once it's fully finished, we can expect another and maybe final push to the upside for wave (5) this year before a higher degree correction and bear market shows up next year.
We also want to mention that even Bitcoin can be finishing a 3-year bullish cycle, which can end this year, but there's still some space for more gains along with the Microstrategy to complete the 5th wave of an impulse.
What's the fate of MSTR? MSTR is showing a sign for a long opportunity. However, there hasn't been a confirmation yet.
The stock is in oversold region and price has respected both bullish trendline and support level. Once there's a breakout of the bearish trendline and green bar is formed on the awesome oscillator, then you can take a long position. This is a confirmation that the stock is ready to create a new higher price.

MSTR Riding Momentum – Can $345 Gamma Resistance Break? (Oct 2)Intraday (15-Min Chart)
MicroStrategy surged strongly, climbing into the $338–$343 zone before consolidating along the rising channel. On the 15-min chart, price is tracking its upper trendline with MACD momentum turning positive again, while Stoch RSI is extended but still supportive.
* Immediate resistance: $343.5–$345 (channel top).
* Support levels: $333 first, then $322.2 as structural support.
* Upside trigger: Break above $345 unlocks potential toward 352–356 intraday.
* Downside risk: Failure to hold $333 could trigger a pullback to $322 or even $315.9.
Bias intraday: bullish above 333, but watch for exhaustion if price stalls under 345.
Options / GEX (1-Hour Chart)
Gamma exposure highlights where MSTR could face resistance and support.
* Call walls: Major resistance aligns at 345, marking the highest positive GEX level. Above this, dealers may unwind hedges, opening the door for a squeeze toward 356–360.
* Put walls: Anchored around 310 and 300, which provide the nearest downside protection zones.
* Sentiment: Options activity shows only ~26% calls, signaling less speculative bullishness compared to high-volume tech names.
This suggests that while MSTR is pushing into resistance, a breakout above 345 could accelerate quickly due to thin liquidity and strong dealer positioning.
My Thoughts
For Oct 2, MSTR looks constructive within its channel. I’d lean bullish above $333, targeting 345 breakout and a move toward 352+. For options traders, a 340/355 call spread offers defined risk into gamma resistance. Conversely, if weakness emerges under $333, put spreads toward 322–310 provide downside coverage.
Bias: Bullish momentum remains, but $345 is the key inflection — breakout or rejection decides the next leg.
Disclaimer: This analysis is for educational purposes only and does not constitute financial advice. Always do your own research and manage risk before trading.

MSTR is still in a downward channelWhile it looks promising that MSTR is making some small gains, it's still in a very real downward channel. These type of gains are typically very short lived as many in this space are short term / profit takers. Technicals and soon UltraShort signals are confirm this, but would not bet the fam on any of this f&ckery!
MSTR Is A BuyHello,
It may drop again to $270 level before a big rally.
Targets:
1) $400
2) $543 ATH
3) $600

$MSTR 6th Consecutive Week BELOW 50WMAStill kinda shocked at how terrible the NASDAQ:MSTR chart is.
Working on its 6th consecutive week below the 50WMA.
What a complete disaster @saylor
If PA doesn't start showing some real strength here off the .236 Fib then down to ~$235 she blow 🌬️

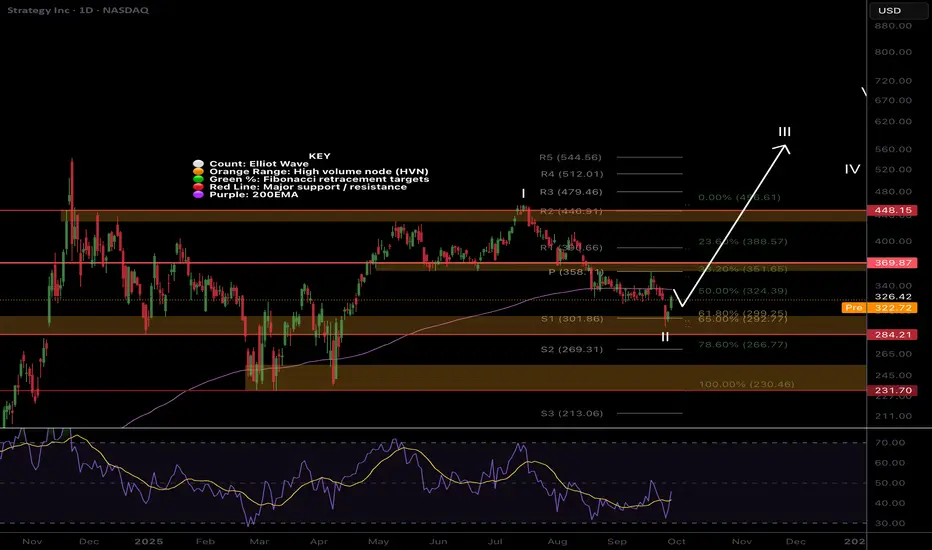
MSTR Wave II bottom?NASDAQ:MSTR is finally catching a bid from the triple support zone of the Fibonacci golden pocket, S1 pivot and High Volume Node.
It must overcome the daily 200EMA to add confidence to a reversal and wave II bottom being in.
Daily RSI has printed bullish divergence from oversold. Vanguard disclosed massive MSTR holdings ad the sentiment is awful online adding confluence to a bottom soon.
Wave III target is the R5 daily pivot $544, losing the support zone has a downside target of $232
Safe trading
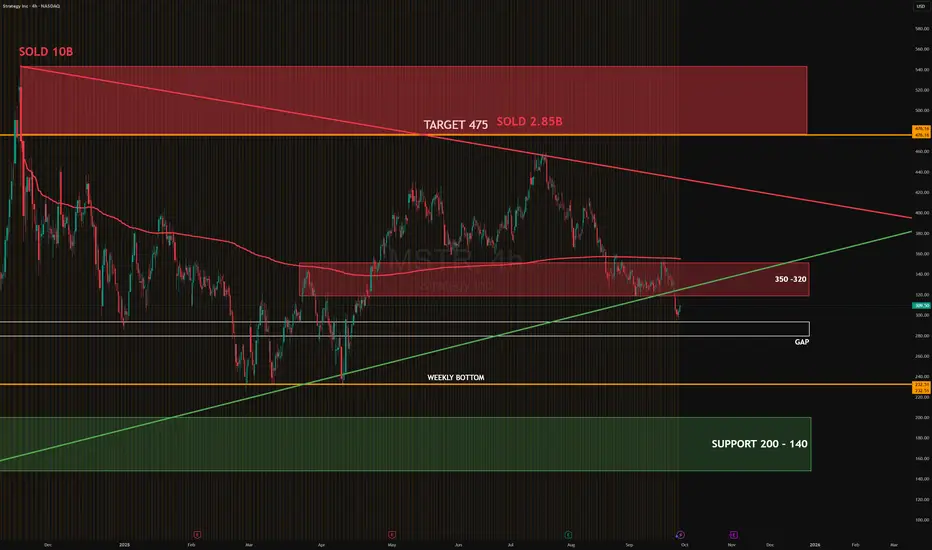
MSTR CORRECTION OCT 2025Price action in MSTR shows rejection from the 350–320 supply zone, with institutional selling pressure still present. The breakdown opens risk of gap filling below 300, with a weekly bottom as the next reference. Heavy absorption could only resume if the price reclaims 320.
# Upside target: 350–320 if reclaimed
# Downside target: 280 gap zone, extended to 200–140 support
#MSTR #globaltrade #investment #investing #stockmarket #wealth #realestate #markets #economy #finance #money #forex #trading #price #business #currency #blockchain #crypto #cryptocurrency #airdrop #btc #ethereum #ico #altcoin #cryptonews #Bitcoin #ipo
MSTR Buying OpportunityCurrent Technical Picture:
MSTR has experienced significant volatility, forming a bull flag the volume price support at the $300 USD support is strong so we can expect a floor around this levels!
Support Factors:
The stock appears to be finding some support around current levels after a recent decline.
Risk Considerations:
The stock has shown high volatility historically, as evidenced by the large price swings visible on the chart
Recent price action shows both significant upward and downward movements
The complexity of overlays suggests this is a actively traded, volatile security

MSTR (possible short)Alot going on here, but its jus because I have been charting this out since around March.
BTC has a bearish setup where we could possibly see 92.5Kish.
Looking at MSTR which is a huge follower, we broke below the 200 on the daily.
My reasoning for possible short entry (red dot).
1. Trend Based Fib (3-point in green): shows we could bounce here, but extend down toe the $200 level.
2. We could bounce here because we are re-testing the monthly IB that we broke out, we are at the 50% quadrant of that IB.
3. However, we are currently trading within the 3M quarterly candle, and the HTF breakout we had was never re-tested. Sweeping this 3M candle, would put us in a good spot for long term growth.
4. Short entry would be red dot, with covering at the last high on daily ($358ish).

MSTR back to ATH?1. MSTR has been trading in a long-term upward channel, respecting both support and resistance lines.
2. The current pullback seems to be a consolidation phase within this bullish structure.
3. Price recently touched the lower boundary of the channel, suggesting strong technical support.
4. Historically, each bounce from this area has led to significant upward moves.
5. Leading analysts like Tom Lee expect Bitcoin to surge in Q4 and potentially reach $200K per coin, a quarter that has historically been very strong for crypto.
6. The correlation between MSTR and Bitcoin remains very strong, amplifying upside potential.
7. As long as Bitcoin continues its bullish trend, MSTR is positioned to benefit disproportionately.
8. The recent descending wedge on the chart is typically a bullish reversal pattern.
9. A breakout above this wedge could trigger a strong rally back toward previous highs.
10. Given the technical setup and Bitcoin’s momentum, MSTR has a realistic path to a new ATH and potentially beyond.
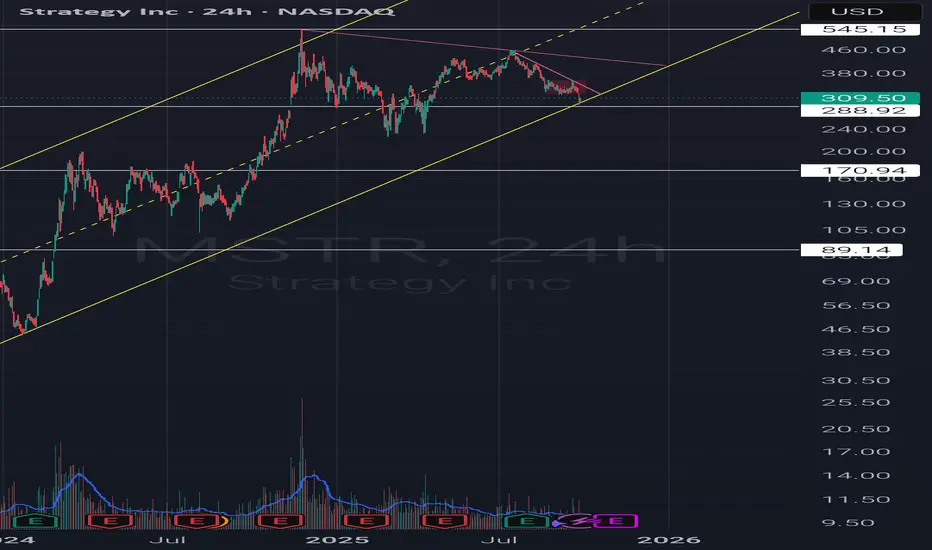
$MSTR to push above $400 again?NASDAQ:MSTR had it's 3rd touch off this blue trend line and usually when it does that, it forms a strong move in the other direction.
As long as this trend line holds, I think it's likely that we can see a move back above $400.
I've marked off key levels as resistance.
Took calls between $367.5 and $410.

MSTR - Here comes #5 at the CenterlineRemember when I said, I do it again Sam?
Nothing changed. Only the price in the consolidation at P4.
This will temporarily end at P5 (Yellow Count), where I'll take my profit. With a little pressure, price will even make it to the L-MLH.
Then I'll relax and watch, how the Chickens run around and create new opportunity. 🐔🐓
Don't be a Chicken, be the 🦊 Fox 🦊, be clever and have patience.
Happy new week all §8-)

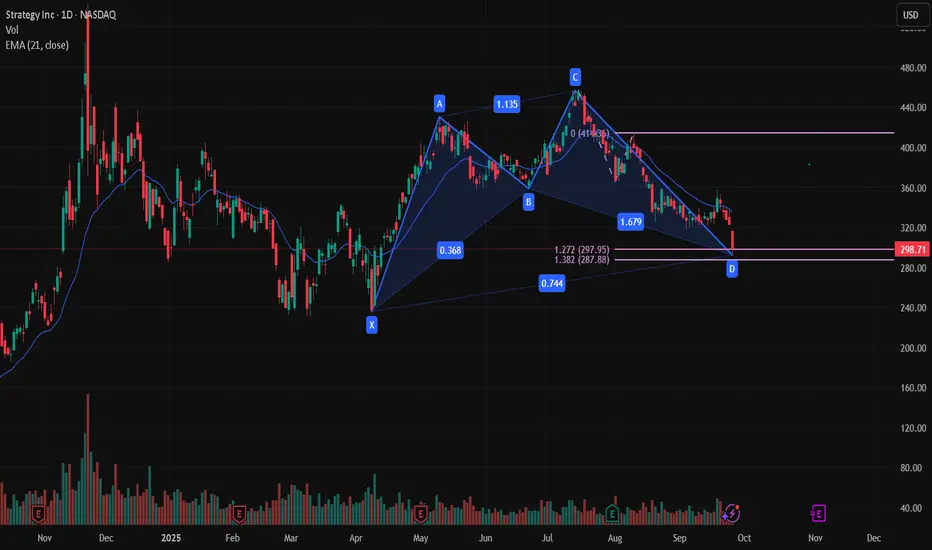
$MSTR Bullish Cypher patternNASDAQ:MSTR This bullish Cypher pattern has a much better look. All depend on a strong bounce in Bitcoin now.
MSTR ZONES OF CONFLUENCECalled this out some time back. Sometimes MSTR gives the cleanest setups on where price is headed as the Mnav and its tradable premium to Bitcoin decouple - a result of shareholder dilution, CAMT tax obligations, as well as interest payments on its preferred. Because of this, riding the down trend is clear and easy until respectfully breaks the upper threshold of support turned resistance - 360.

BTC Exhaustion at $100K Could Trigger $MSTR Structural WeaknessI’ve been tracking Bitcoin’s price action, and buyers look exhausted at these levels. Since July, BTC has been topping out. There’s strong support at the $100K area — with the 200MA right around $103K — this zone is the battleground. If buyers lose it, we’re looking at a possible break of structure at $100K.
We all know NASDAQ:MSTR isn’t really a software company anymore — it’s basically a Bitcoin Treasury play. The model is simple: raise capital (debt, equity), buy more BTC, repeat. That means if BTC breaks lower, MSTR usually gets hit even harder. Leverage cuts both ways.
For me, $317 is the key level. If MSTR loses that, I’m targeting $300. I’ve already picked up some long puts at the $295 strike. My rule: if the premium drops 30%, I cut it as a wrong play. If it holds, I’ll ride it until it’s at-the-money.
As always — manage risk like your survival depends on it. Because it does.

The Next Big Crypto Trade Bitcoin has experienced a notable decline following a failed auction attempt after sweeping all-time high liquidity. This move is now being followed by a significant retracement toward the lower boundary of the broader range, with the current range low positioned around $111K.
In contrast, MicroStrategy (MSTR) has exhibited a more structurally defined downtrend, having broken below its previous pivot low. This price action potentially forms a textbook ABC corrective pattern, with the 1:1 extension target clearly identifiable.
Should the broader market continue to decline in the lead-up to this week’s FOMC meeting and Powell’s remarks, a compelling long setup may emerge. This could coincide with a potential 'sell-the-news' reaction, particularly if the Federal Reserve moves to cut interest rates.
Rate-sensitive equities and assets may initially respond to such news with bullish enthusiasm, possibly triggering a wave of market euphoria and leading to a short squeeze scenario.
I’m closely monitoring the $320 level on MSTR, which aligns with three key technical confluences:
The 0.618 Fibonacci retracement level from the overall move (swing low to swing high).
The 1:1 extension target of the possible ABC corrective structure.
A key support/resistance flip zone, which may mark a potential structural pivot point.
This zone presents a high-probability area for potential price reaction. Let’s see how this plays out.

MSTR....set-up not looking goodNASDAQ:MSTR is below 9, 50, 200SMA! That's about the clearest red flag you can see. There could be some volatility, but would be very careful as it crosses down 330, 300 and then possibly the next support line is further down as people dump hard. CBOE:MSTZ is a nice inverse play here! Best of luck
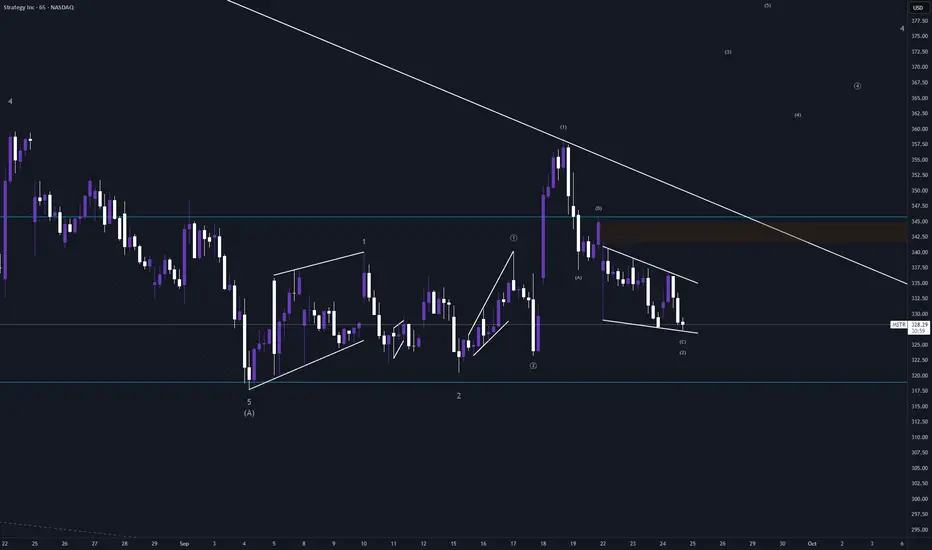
MSTR further winding up with a 1-2 1-2 1-2? Looks like MSTR might have just finished and ending diagonal for another wave c of 2. This could also just be a 1-2 1-2 still but so far counting it as a 1-2 1-2 1-2.
Either way, it looks like it is ready to rip to 380. Will see in the next couple of sessions how this plays out.
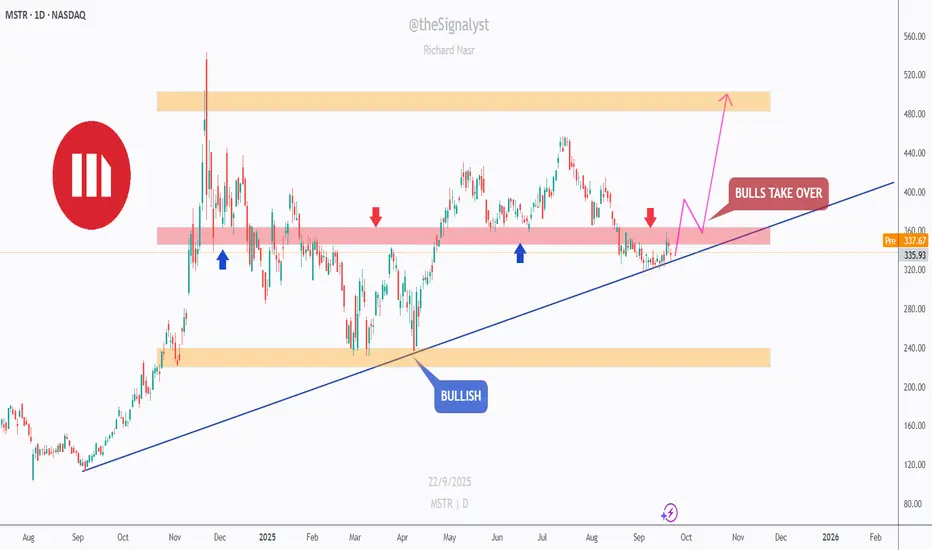
MSTR - Trendline Support vs. Supply Cap!MSTR has been overall bullish on the daily, respecting a rising trendline since last year. Price is coiling right beneath the 330–350 supply band after multiple rejections.
This area is key 🔑. It overlaps prior supply and the rising trendline—clean confluence. If bulls defend the trendline and we see a clean daily close above 350, momentum could extend toward 400 first, then 470–520 inside the broader range 🚀.
If the trendline gives way, I’ll look for a deeper dip toward 260–240 demand before bulls try again. Until then, structure favors the upside while the line holds.
What’s your plan => buy strength above 350 or wait for a retest on the trendline first? 🤔
⚠️ Disclaimer: This is not financial advice. Always do your own research and manage risk properly.
📚 Stick to your trading plan regarding entries, risk, and management.
Good luck! 🍀
All Strategies Are Good; If Managed Properly!
~Richard Nasr