Nike poised for 2026 reboundWe keep coming back to the line attributed to Nike's CEO Phil Knight, “The cowards never started and the weak died along the way. That leaves us.”
Nike shares have slumped over the past 12 months, down roughly 17 to 18 percent. The weakness reflects a tough consumer stretch and pressure across global retail channels.
But beneath the surface, the business is stabilising. Fiscal 2025 revenue came in around $46 billion, down about 10 percent from the prior year. Net income held near $3.2 billion.
Gross margins were close to 42 percent and operating margin hovered near 8 percent. These are not the numbers of a brand in structural decline. They show a business absorbing shocks while keeping its core intact.
The most recent quarter delivered revenue of roughly $11.7 billion, up a touch year-on-year, with net income around $700 million. The uptick is small but important. It tells me the bleeding is slowing. Inventory has normalised, wholesale orders have improved, and margin traction is beginning to reappear.
Now look at the macro backdrop. If US rates fall next year under easing inflation pressure, the consumer should finally exhale. That shifts momentum back toward discretionary spending. Nike captures that swing better than most. Its global footprint, deep wholesale relationships and disciplined direct to consumer strategy give it leverage when demand cycles turn.
Nike has been hit, no doubt. But it remains a unique asset in global apparel. Product cadence is improving. Cost discipline is tighter. The brand still owns mindshare.
Nike has gone through the fire. Many competitors wilted. Nike endured. With the share price depressed and fundamentals firming, the setup looks compelling for a rebound.
The forecasts provided herein are intended for informational purposes only and should not be construed as guarantees of future performance. This is an example only to enhance a consumer's understanding of the strategy being described above and is not to be taken as Blueberry Markets providing personal advice.
Trade ideas

NKE Longdemand Zone
Long entry 61.5
Stop 58,
Target 70, 80
Risk management is much more important than a good entry point.
I am not a PRO trader.
In my trading plan, the Max Risk of each short term trade should be less than 1% of an account.

Bullish Deep Crab + Double Bottom at PCZPattern Identified: Bullish Deep Crab (0.886B/1.618XA with 2.0 BC Projection Confluence) with strong confluence at Potential Reversal Zone (PRZ).
Key Confluence:
Retracement Profile: Dual 0.886 retracements at B and C indicate powerful but potentially exhausted counter-trend momentum
Perfect Crab Ratios: 0.886B/1.618XA is the classic Deep Crab definition
BC Projection Strength: 2.0 extension adds significant confluence to the 1.618 XA level
Confirmation Signals Needed:
Increasing volume on reversal from PRZ and breakout of downwards trendline (green diagonal line).

NKE long idea Long CALLS NKE at 68. 6 weeks expire. SMT in the lows with SP500, this pattern indicates strong demand on NKE.

NKE Weekly Swing Insight – Bearish Bias Despite Bullish Market"QuantSignals V3 – Katy AI
Analysis Type: Swing (17-day horizon)
Current Price: $62.50
Trade Direction: BUY PUTS
Strike Price: $62.50 PUT
Entry Range: $1.85 – $2.15
Target 1: $3.50 (+67%)
Target 2: $4.80 (+123%)
Stop Loss: $1.10 (≈40% loss)
Expiry: 2025-12-12
Position Size: 3% of portfolio
Confidence Level: 62%
⚠️ Risk & Conflict
Katy-LLM Conflict: Katy AI predicts bearish move (-0.86% over 2-3 weeks), but LLM recommendation is BUY CALLS. Medium severity.
Risk Level: Moderate
VIX Context: Falling but elevated at 20.19, moderate volatility environment.
🧠 Analysis Summary
Technical: Stock near 84.9% of swing range, weak momentum, resistance at $66.32, support at $61.01.
Candlestick Patterns: None detected
Options Flow: Strong bearish bias, Put/Call Ratio 1.40, unusual activity at $51 PUT indicates institutional positioning.
Market Context: Overall bullish market, but NKE relatively weak. Sector pressures from tariffs noted.
News Sentiment: Mostly neutral; some negative apparel sector news (tariffs, Levi’s CEO statements).
⚡ Competitive Edge
Katy AI’s bearish prediction combined with elevated put/call ratio and technical resistance creates a high-probability swing setup.
Timing advantage: stock at top of swing range with weak momentum – optimal for reversal.
Risk mitigation: 17-day expiry, tight stop, conservative position size.

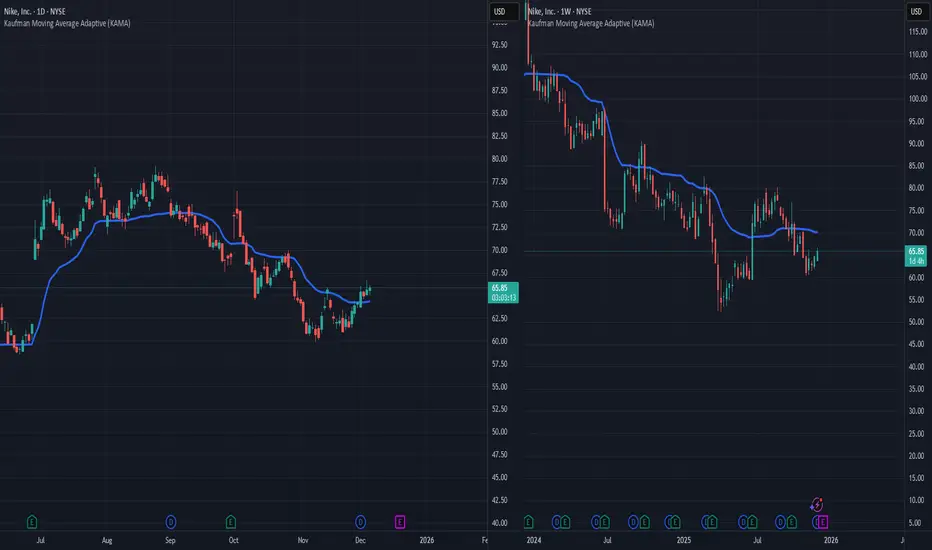
NKE // As long as we are above the Kaufman support on the daily time frame, the direction is up. Our first resistance point is the Kaufman indicator on the weekly time frame.
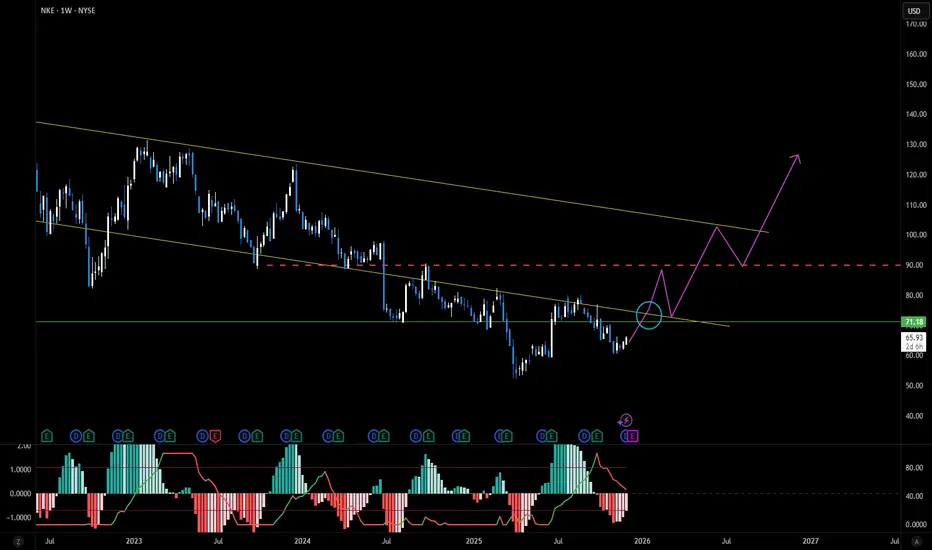
Simultaneously support and trend breakout expectationExpecting support and trend breakout at the same time, then reaching 90 for resistance
and retest and target 100 for the trend line. ** Not for trading advice
NKE 1HR Trend Zones
This analysis is shared strictly for educational purposes and is not financial advice. It is intended to illustrate chart-reading techniques, structure mapping, and scenario planning.
UP TREND (marked in yellow/orange)
A horizontal dotted line above the central region highlights where the chart categorizes an uptrend.
This appears to be above the Fibonacci arc structure.
DOWN TREND (marked in yellow/orange)
A similar label is placed below the arcs, indicating the downtrend zone
The trendlines forming a descending wedge/channel are clearly visible
3. Fibonacci Arcs / Fib Fan
A large set of Fibonacci arcs is drawn from a swing high to a swing low
Different colors (green, teal, gray, red) mark these zones
They visually map potential retracement and extension zones
4. Support Projections
Three projected support points (SP) extend to the right
SP1 (around $64 region)
SP2 (around $62.48 region)
SP3 (lower projection, apprx $60 region)
These are shown as dotted orange diagonal lines pointing into the future, marking where price may find support if the downtrend continues.
5. Chart Patterns
On the left, there is a triangular/accumulation pattern in green.
To its right is a mirror bearish pattern shown in red.
These appear to be harmonic or geometric formations representing breakout and breakdown zones.
Summary
This is a technical trading analysis chart combining
Fibonacci arcs
Trend channels
Support projections
Historical price action
Zones labeled UP TREND and DOWN TREND

NKE – Swing/PositionNike is a globally recognised brand with strong distribution, and at current price levels (~$62.50) it offers a potential low-risk entry into a long-term leader in footwear/apparel. The staggered entry zones allow you to build a position as price consolidates or corrects. Pull-backs to $58 or $53 offer higher reward-to-risk opportunities. The profit targets of $67/$71/$78 align with the stock’s historical high-end range and possible rebound scenario
🔹 Entry Zones:
• Entry #1: ~ $62.50 (current market)
• Entry #2: $58.00 on pull-back
• Entry #3: $53.00 for deeper correction
🔹 Profit Targets:
• Target #1: $67.00
• Target #2: $71.00
• Target #3: $78.00
This post is for educational purposes only and does not constitute financial advice. Always perform your own research and manage your own risk.

December 2025 is Hurst's 9 Years Cycle!Margin of Error "Adjusted" on the chart:
9 Years, 4.5 Years and 18 Months !
1: September 2025 is our early trough
2: 2027 is our late trough
3: Or we are having one right now !

Nike by April 2025 we should have break out or breakdown !101 Trend lines analysis. By April we should could/might reach the Red line in which we will have a break out to a new ATH in the next years or so or a break down to the 40ish/50ish region.!

Nike is reaching trough lands soon ! Or not & W crash more !61% Retracement from all time low "IPO" to "ATH" is in the 60ish region. MKTS permitting & unless we are about to crash just like 1929 as some Elliottsions suggest then we are about to have a trough in Q1/Q2 of 2025 .!

Nike's 1984 Vs 2000 Major Trend lines The 1984 Major and historical Trend line is already broken with 3 candles below, technially
this is a valid and confirmed breakdown.
The 2000 Major and historical Trend line is hanging by $5 give or take $66 -+ is the support for the TL.

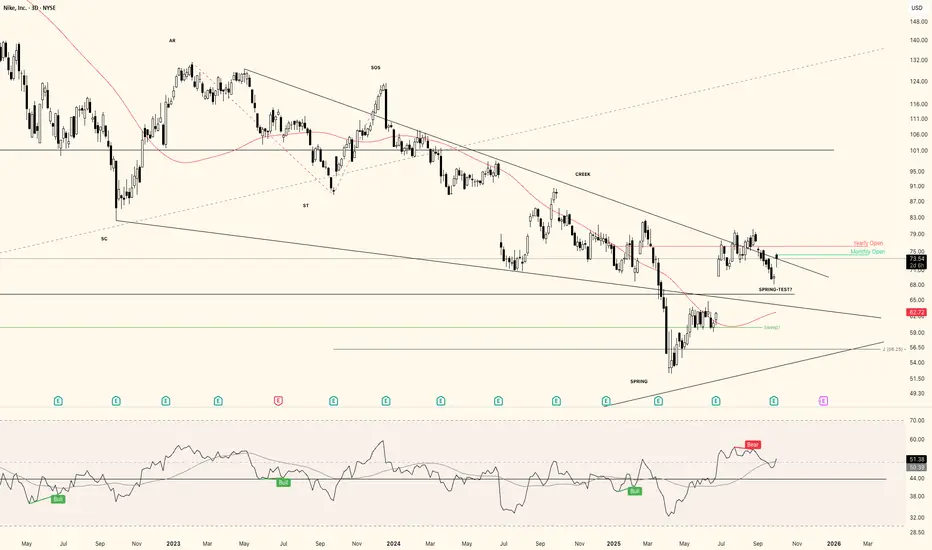
NKE starting a new uprendIf you've followed my previous post about NYSE:NKE you know I was eying a descending wyckoff accumulation schematic. We successfully anticipated the spring-phase and now I think there is a big chance the spring-test has been completed, or anyway will complete soon.
So long story short: next up is SOS-phase and expansion towards a 1.618 trend based fib extension. But I'm personally not looking to trade this and plan to keep this as a multi-year stock hold. That's not financial advise, that's just my personal plan.
NKE may be ready to jump big timeFrom a technical standpoint, it’s important to note that we appear to have completed a multi-year correction, followed by a solid relief rally and a subsequent pullback to the 61.8% Fibonacci retracement level. This is the basis of my technical stance.
My fundamental analysis of NIKE, though, reveals a company at a critical inflection point. The analysis indicates significant deterioration that current market pricing fails to adequately reflect. The -43.5% net income decline, -9.8% revenue contraction, and -50.6% free cash flow deterioration paint a concerning picture of operational challenges and margin compression.
Despite these headwinds, NIKE continues to trade at premium valuation multiples that appear disconnected from the company's current growth trajectory. The P/E ratio of 27.9x and EV/EBITDA of 20.7x are difficult to justify given the earnings contraction and negative revenue growth. While technical indicators suggest oversold conditions, the broader trend remains downward, reflecting market recognition of these fundamental challenges.
The saving grace for NIKE remains its formidable brand equity and global market positioning, which provides some downside protection and potential for recovery if management can successfully navigate the current competitive landscape. However, until clear evidence emerges of successful execution and fundamental improvement, the risk/reward profile remains unfavorable long term. I would recommend a HOLD stance with caution , as current valuation levels appear unsustainable and fail to adequately discount the operational headwinds facing the company.
Current Price: $62
Price Target: $96
Invalidation: $55

Nike Isn’t Flying AnymoreNike was once an unstoppable consumer giant. However, with its last all-time high four years in the rearview mirror, some traders may see downside risk.
The first pattern on today’s chart is the June 11 high of $64.85. NKE bounced above that level on October 10 but ended the month slightly below it. That may indicate support isn’t holding.
Second, the falling 200-day simple moving average (SMA) is falling. Prices are also slipping back below it, which may suggest its long-term trend is bearish.
Third, the 8-day exponential moving average (EMA) is below the 21-day EMA. That could mean its short-term trend is also bearish.
Fourth, the stock tried to rally after its last earnings report but buyers soon evaporated. Does that reflect a lack of enthusiasm about its fundamentals?
Finally, chart watchers may see risk of NKE revisiting its 52-week low at $52.28.
TradeStation has, for decades, advanced the trading industry, providing access to stocks, options and futures. If you're born to trade, we could be for you. See our Overview for more.
Past performance, whether actual or indicated by historical tests of strategies, is no guarantee of future performance or success. There is a possibility that you may sustain a loss equal to or greater than your entire investment regardless of which asset class you trade (equities, options or futures); therefore, you should not invest or risk money that you cannot afford to lose. Online trading is not suitable for all investors. View the document titled Characteristics and Risks of Standardized Options at www.TradeStation.com . Before trading any asset class, customers must read the relevant risk disclosure statements on www.TradeStation.com . System access and trade placement and execution may be delayed or fail due to market volatility and volume, quote delays, system and software errors, Internet traffic, outages and other factors.
Securities and futures trading is offered to self-directed customers by TradeStation Securities, Inc., a broker-dealer registered with the Securities and Exchange Commission and a futures commission merchant licensed with the Commodity Futures Trading Commission). TradeStation Securities is a member of the Financial Industry Regulatory Authority, the National Futures Association, and a number of exchanges.
TradeStation Securities, Inc. and TradeStation Technologies, Inc. are each wholly owned subsidiaries of TradeStation Group, Inc., both operating, and providing products and services, under the TradeStation brand and trademark. When applying for, or purchasing, accounts, subscriptions, products and services, it is important that you know which company you will be dealing with. Visit www.TradeStation.com for further important information explaining what this means.

NIKE — $31–$11 bottom | Before SuperCycle Wave 3 hits ~$1000⚡ NKE: Micro Wave 4 Bounce Before the Final Flush 👟🔥
Nike ( NYSE:NKE ) has been in a SuperCycle Wave (2) correction since topping near $179 in 2021. This isn’t a collapse — it’s a structured reset that should run into 2027 , forming a large ABC correction before the next SuperCycle Wave (3) bull phase begins.
Right now, price action is inside a micro Wave 4 move within the ongoing Wave A. Micro waves 1, 2, and 3 have completed, and waves A and B of this current wave 4 are also done. What’s likely next is a short-term bounce toward $82 , where equal highs and liquidity sit, before a final Wave 5 decline finishes Wave A around the 0.236 Fibonacci retracement near $31 .
From there, expect a Wave B rebound followed by Wave C down toward the 0.382 retracement around $11 , which could complete the full SuperCycle Wave (2) correction. That zone may become the macro accumulation area ahead of the next explosive SuperCycle rally.
The $82 region aligns with a liquidity grab in Smart Money terms — a trap for breakout buyers before price descends into the deeper $31–$50 institutional value range , matching demand zones from 2016–2018.
This phase is less about panic and more about patience. Once the 2021–2027 correction ends, Nike could begin a multi-year rally that redefines its valuation.
The swoosh isn’t breaking — it’s recharging for its next leap. 👟⚡
#NKE #Nike #ElliottWave #SmartMoneyConcepts #WaveTheory #Fibonacci #PriceAction #MarketCycle #TechnicalAnalysis #TradingViewAnalysis #StocksToWatch

Trade Idea | $NKE – Reversal Setup Under Macro Pressure🔍 Trade Idea | NYSE:NKE – Reversal Setup Under Macro Pressure
Timeframe: Daily | Structure + Flow + Macro by VolanX DSS
Setup Summary:
Price emerging from long down-channel into potential base formation.
Support zone near ~$55.85 aligned with prior liquidity hub.
Macro catalysts: brand pivot, margin improvement, consumer discretionary sentiment shift.
Flow trigger: Look for delta-volume expansion on breakout above upper trendline.
Trade Plan:
Entry Trigger: Close above $70 with volume > 1.5× average and retest of breakout level.
Target Zones: TP1 ~$110–120 (structural recovery), TP2 ~$164 (long-term confluence).
Invalidation: Close below $55.85 or re-entry into channel without breakout.
Risk-Management: Max 1.5 % risk, monitor implied volatility if using options.
Narrative:
This isn’t just a consumer stock – it’s a brand undergoing re-engineering. If Nike executes on its “Sport Offense” and operational momentum aligns, the technicals offer a high-probability inflection point for a swing leg. But the thesis is contingent on both structural confirmation and flow/volume alignment.
⚠️ Not investment advice. For educational/trading-alert use only.
#NKE #VolanX #WaverVanir #QuantEdge #SmartMoneyConcepts #LiquidityReclaim #SwingTrade

$NKE NYSE:NKE looks like it’s trading at a discount 👀
This could be a strategic window for restocking inventory, launching new collabs, and refreshing merch lines.
If demand rebounds into the athletic season, the upside could be stronger than expected.

Is this a Bump and Run Reversal for Nike - 60% gains potential In this video I cover what could potentially be a reversal pattern playing out on Nike .
I cover the price action from the ATH down to the lows and present the idea of a bump and run
reversal pattern which could generate 60% gains .
Setting alerts is key and watching volume as explained in the video .
Please like and support my work any questions then ask below the chart .
Safe trading

Global Brand Power Driving Growth Opportunity: BUYBuy Reason: Nike’s strong brand presence, global market penetration, and innovation in sportswear position it for steady revenue growth and resilience amid market fluctuations. Its expanding digital sales and product innovation make it attractive for long-term investors.

NKE Pullback-I'm Buying the DipNike (NKE) is under pressure — post-earnings volatility, macro noise, and sentiment all weighing in. But for swing traders, this looks like a textbook accumulation setup.
📌 Entry Zones I’m Targeting:
🔹 $70.00
🔹 $65.00
🔹 $60.00
Profit Targets (Taking wins before 88):
✅ $78.80
✅ $82.50
Let the market come to you — no chasing, just precision.
💬 Drop your thoughts below — are you buying NKE here or waiting for blood?
Disclaimer: This post is for informational and educational purposes only. It does not constitute financial advice or a recommendation to buy or sell any securities. Always do your own research and consult with a licensed financial advisor before making any investment decisions. Trading involves risk, and past performance is not indicative of future results

$NKE - a Technical Crossroads: April Trendline RetestFocusing on the yellow April trendline and the current price action within the falling red channel:
🟡 Key Level: April Trendline
The yellow diagonal line represents a long-term support/resistance drawn from April.
Price is currently testing that trendline from below, suggesting it's now acting as potential resistance.
If price fails to reclaim and hold above this trendline, it reinforces the bearish regime.
🔻 Descending Channel (Red Lines)
Nike is locked in a well-defined falling channel, making lower highs and lower lows.
Recent bounce off the lower boundary suggests a technical relief rally, not a confirmed reversal.
Price is now near the midpoint/upper boundary of that channel — a common rejection zone.
📍 Current Price Behavior (~$68.50)
Price is stalling right under the confluence of:
April trendline (yellow)
Upper descending channel resistance (red)
This confluence makes $69–$70 a make-or-break zone.
Trade Scenarios & Strategy
🟢 Bullish Case: Breakout & Retest
Trigger: Close above $70 + retest holding trendline
Targets: $72 (T1), $74.50 (T2)
Options Idea:
⏳ Buy Call Debit Spread (70c/75c, 1–2 month expiry) to limit risk
🎯 Sell 75c covered call if holding shares → conservative upside capture
🔴 Bearish Case: Rejection at $70
Trigger: Price rejects yellow trendline & falls below $68
Targets: $66 → $64
Options Idea:
Put Debit Spread (67p/64p)
Short-term credit call spread at $72/74 (for premium)
