TNETAgain, another opportunity to DCA. Expecting this weeks earnings report to provide the fuel that this stock needs to turn around and shoot for the all time highs.
Next report date
—
Report period
—
EPS estimate
—
Revenue estimate
—
2.50 EUR
167.11 M EUR
4.88 B EUR
47.60 M
About TriNet Group, Inc.
Sector
CEO
Michael Q. Simonds
Website
Headquarters
Dublin
Founded
1988
ISIN
US8962881079
FIGI
BBG000CMJGY4
TriNet Group, Inc. engages in the provision of comprehensive human resources solutions for small and medium-size businesses. The firm also offers access to human capital expertise, benefits, risk mitigation, compliance, payroll, and research and development tax credit services. The company was founded by Martin Babinec in 1988 and is headquartered in Dublin, CA.
Related stocks
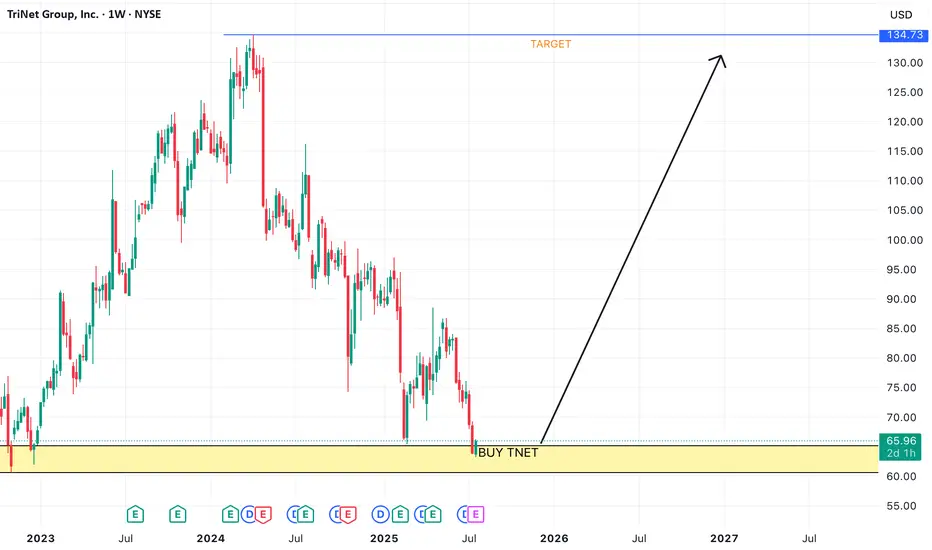
BUY TNETWe are currently sitting at a significant demand zone. Looking to catch this stock own the reverse and ride it to the previous high.

4/27/24 - $tnet - a buy but complicated - vrockstar4/27/24 - outsized move for the stock on eps -17% seems too much. however, growth subdued for next 2 yrs doesn't help. even 8% implied fcf yield while juicy and sticky-ish base... is not exactly what the mkt wants to pay for this -ve growth i'm sensing - it's probably closer to 10% for this type of


TNET: Bullish BreakoutI've been watching TNET since their massive 1-day spike of 23% back in February, and they've been flat in a horizontal channel since. That was a strong clue that I needed to be patient and wait out for a break out on them. Well, it's happening now and the prices are breaking out of that channel in

Watching TNET for break outThis chart looks great on the weekly, too. I'm hoping to get in if it pulls back to the lower, long term trend line for a break out of this potential bull flag. Gray area is potential overhead resistance but I'm betting on it not being very strong if the channel breaks to the upside. Stock is hol

See all ideas
An aggregate view of professional's ratings.
Neutral
SellBuy
Strong sellStrong buy
Strong sellSellNeutralBuyStrong buy
Neutral
SellBuy
Strong sellStrong buy
Strong sellSellNeutralBuyStrong buy
Neutral
SellBuy
Strong sellStrong buy
Strong sellSellNeutralBuyStrong buy
Displays a symbol's price movements over previous years to identify recurring trends.
TNET5628843
TriNet Group, Inc. 7.125% 15-AUG-2031Yield to maturity
6.45%
Maturity date
Aug 15, 2031
TNET5138132
TriNet Group, Inc. 3.5% 01-MAR-2029Yield to maturity
5.52%
Maturity date
Mar 1, 2029
See all TN3 bonds
Frequently Asked Questions
Depending on the exchange, the stock ticker may vary. For instance, on SWB exchange TriNet Group, Inc. stocks are traded under the ticker TN3.
We've gathered analysts' opinions on TriNet Group, Inc. future price: according to them, TN3 price has a max estimate of 82.69 EUR and a min estimate of 57.12 EUR. Watch TN3 chart and read a more detailed TriNet Group, Inc. stock forecast: see what analysts think of TriNet Group, Inc. and suggest that you do with its stocks.
Yes, you can track TriNet Group, Inc. financials in yearly and quarterly reports right on TradingView.
TriNet Group, Inc. is going to release the next earnings report on Oct 22, 2025. Keep track of upcoming events with our Earnings Calendar.
TN3 earnings for the last quarter are 0.98 EUR per share, whereas the estimation was 0.87 EUR resulting in a 12.61% surprise. The estimated earnings for the next quarter are 0.66 EUR per share. See more details about TriNet Group, Inc. earnings.
TriNet Group, Inc. revenue for the last quarter amounts to 247.03 M EUR, despite the estimated figure of 236.84 M EUR. In the next quarter, revenue is expected to reach 223.14 M EUR.
TN3 net income for the last quarter is 31.41 M EUR, while the quarter before that showed 78.57 M EUR of net income which accounts for −60.02% change. Track more TriNet Group, Inc. financial stats to get the full picture.
Yes, TN3 dividends are paid quarterly. The last dividend per share was 0.23 EUR. As of today, Dividend Yield (TTM)% is 1.60%. Tracking TriNet Group, Inc. dividends might help you take more informed decisions.
TriNet Group, Inc. dividend yield was 1.10% in 2024, and payout ratio reached 28.90%. The year before the numbers were 0.00% and 0.00% correspondingly. See high-dividend stocks and find more opportunities for your portfolio.
As of Oct 2, 2025, the company has 3.6 K employees. See our rating of the largest employees — is TriNet Group, Inc. on this list?
EBITDA measures a company's operating performance, its growth signifies an improvement in the efficiency of a company. TriNet Group, Inc. EBITDA is 292.02 M EUR, and current EBITDA margin is 8.27%. See more stats in TriNet Group, Inc. financial statements.
Like other stocks, TN3 shares are traded on stock exchanges, e.g. Nasdaq, Nyse, Euronext, and the easiest way to buy them is through an online stock broker. To do this, you need to open an account and follow a broker's procedures, then start trading. You can trade TriNet Group, Inc. stock right from TradingView charts — choose your broker and connect to your account.