TSM Attempting BreakoutTSM gapped up yesterday on better than expected earnings report
Made a new All Time High but closed below it because of weakness in SPX
Either get in on a confirm breakout OR wait for a gap fill at 132~
Huge volume yesterday, way above 50 Day Standard Volume
Trade ideas

clear shotchart was predicted before time and added to my portfolia within time so if u want more follow me

TSM LongTrendline break + retest
Entry 120
Stop 115
Target 140
Risk management is much more important than a good entry point.
I am not a PRO trader.
In my trading plan, the Max Risk of each short term trade should be less than 1% of an account.

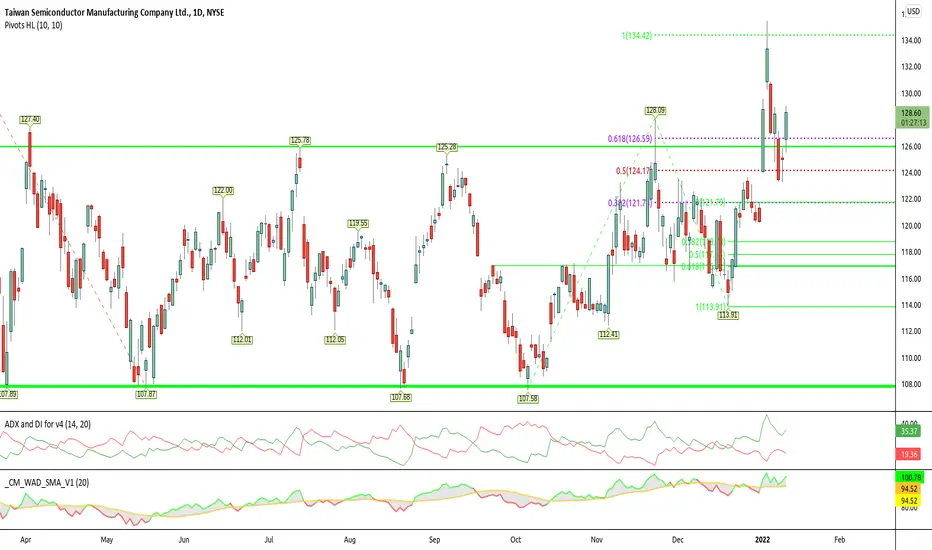
Taiwan Semiconductor earnings on 1/13 at 6amTaiwan Semiconductor Manufacturing ADR (TSM) Q4 earnings are on Thursday 1/13 at 6am. TSM reported Q3 September 2021 earnings of $1.08 per share on revenue of $14.9 billion. Revenue grew 22.6% on a year-over-year basis. TSM said it expects Q4 revenue of $15.4 billion to $15.7 billion. TSM technicals have been "rangy" the past year. What strikes me at this point in time is that the 100SMA, 150SMA & 200SMA have consolidated tightly together now at $117ish. This could become a very strong support area, plus it could point to an impending breakout to the upside if earnings are positive. Here's the price levels on the 1-day chart:
Q4 December 2021 Consensus:
EPS = $1.14
Revenue = $16.10B
P/E = 31.39
Div /Yld = 1.198
52 week high = $142.20
52 week low = $107.58
SMA200 = $117.47
SMA150 = $117.66
SMA100 = $117.72
breakout = $136.42
R3 = $132.77
R2 = $129.11
R1 = $125.46
pivot = $121.80
S1 = $118.15
S2 = $114.50
S3 = $110.84
breakdown = $107.19
Do your own due diligence, your risk is 100% your responsibility. This is for educational and entertainment purposes only. You win some or you learn some. Consider being charitable with some of your profit to help humankind. Good luck and happy trading friends...
*3x lucky 7s of trading*
7pt Trading compass:
Price action, entry/exit
Volume average/direction
Trend, patterns, momentum
Newsworthy current events
Revenue
Earnings
Balance sheet
7 Common mistakes:
+5% portfolio trades, capital risk management
Beware of analyst's motives
Emotions & Opinions
FOMO : bad timing, the market is ruthless, be shrewd
Lack of planning & discipline
Forgetting restraint
Obdurate repetitive errors, no adaptation
7 Important tools:
Trading View app!, Brokerage UI
Accurate indicators & settings
Wide screen monitor/s
Trading log (pencil & graph paper)
Big, organized desk
Reading books, playing chess
Sorted watch-list
Checkout my indicators:
Fibonacci VIP - volume
Fibonacci MA7 - price
pi RSI - trend momentum
TTC - trend channel
AlertiT - notification
www.tradingview.com

Retesting the HighThe January spike up has been corrected but the Fibonacci 50% has been bought immediately. Consequently the following rise may become a retest of this January high. The momentum is increasing.
TSM, Will make a new ATH !TSM 's trend is clearly up . It more than likely has completed waves 1,2,3,4 of a wave cycle and now is completing it's final leg.
TSM' s Tripe three complex correction has ended on 6 Oct 2021 at 107.58 USD. Currently it has completed wave 1 and 2 of last mentioned final leg up and is in wave 3 the final wave .
Our targets are :
1. 149 to 151
2. 161 to 163
3. 174 to 176
I give more chance to 161-163 for now however we have upcoming Earning Report which predicted by analyst to be a strong one and may push the price much much higher!
Normally I expect a correction after hitting our target, retrace back to around 110 and another move up to new ATH.
Our buy point is taking out 135.5 high.
Good luck everyone!

TSM: Buying DipsTaiwan Semiconductor Manufacturing Company - Short Term - We look to Buy at 117.00 (stop at 114.00)
We look to buy dips. Trend line support is located at 116.00. The trend of higher lows is located at 114.00. The bias is still for higher levels and we look for any dips to be limited. Previous resistance located at 127.00. This move is expected to continue and we look to set longs at good risk/reward levels.
Our profit targets will be 126.00 and 134.00
Resistance: 125.00 / 127.00 / 130.00
Support: 116.00 / 114.00 / 110.00
Disclaimer – Saxo Bank Group. Please be reminded – you alone are responsible for your trading – both gains and losses. There is a very high degree of risk involved in trading. The technical analysis, like any and all indicators, strategies, columns, articles and other features accessible on/though this site (including those from Signal Centre) are for informational purposes only and should not be construed as investment advice by you. Such technical analysis are believed to be obtained from sources believed to be reliable, but not warrant their respective completeness or accuracy, or warrant any results from the use of the information. Your use of the technical analysis, as would also your use of any and all mentioned indicators, strategies, columns, articles and all other features, is entirely at your own risk and it is your sole responsibility to evaluate the accuracy, completeness and usefulness (including suitability) of the information. You should assess the risk of any trade with your financial adviser and make your own independent decision(s) regarding any tradable products which may be the subject matter of the technical analysis or any of the said indicators, strategies, columns, articles and all other features.
Please also be reminded that if despite the above, any of the said technical analysis (or any of the said indicators, strategies, columns, articles and other features accessible on/through this site) is found to be advisory or a recommendation; and not merely informational in nature, the same is in any event provided with the intention of being for general circulation and availability only. As such it is not intended to and does not form part of any offer or recommendation directed at you specifically, or have any regard to the investment objectives, financial situation or needs of yourself or any other specific person. Before committing to a trade or investment therefore, please seek advice from a financial or other professional adviser regarding the suitability of the product for you and (where available) read the relevant product offer/description documents, including the risk disclosures. If you do not wish to seek such financial advice, please still exercise your mind and consider carefully whether the product is suitable for you because you alone remain responsible for your trading – both gains and losses.

TSM EarningsHere's my thoughts.
* Extremely bullish flow with high volume of weekly's.
* Next resistance is at $136.12
* Chart is forming a cup and handle.
* With semiconductor shortage easing up earnings may surprise some.

TSMCIf you follow my trading strategy you should follow these rules:
1. Money management: never ever risk more than 2% of your account on every single trade! (Never risk any more than you can afford to lose)
2. Always use a stop loss order.
3. Always make your own analysis before you follow my strategy.
4. Follow Rule 1!
5. Remember Rule 4!

TSM : LONG Bullish Weekly Signal Alert$TSM stock coming out of a long weekly consolidation and a weekly squeeze. Trend and Pattern indicates the stock is ready to breakout on a weekly time frame provided Nasdaq consolidates at current levels and turns bullish.

TSM STRONGER THAN MARKET
Posbbily in phase D for now
-evidence by sos rally with lps
Observation : succesful 3rd point of test, TSM stronger than market based on comparative analysis, Sos rally with lps present
deduction : ongoing phase D, minor sos
confirmation : jac, major sos

Bears are not fan of TSM chipsTSM has always been the laggin semi play and looks to continue that trend by losing it gains. TSM had an insane run last few sesions followed by losing most of it steam. Currently it is on a downtrend after failing to reclaim EMAS. Continued selling pressure has it nearish support but still has some room down. There is a gap to fill below which looks like it may fill via wick or actual candle. IF we get pump at open with a failed EMA reclaim id go short until 122-120. If it breaks below 120 it should be an easy ride to 114 channel support

1/9/22 TSMTaiwan Semiconductor Manufacturing Company ( NYSE:TSM )
Sector: Electronic Technology (Semiconductors)
Market Capitalization: 593.364B
Current Price: $123.50
Breakout price: $128.00
Buy Zone (Top/Bottom Range): $125.00-$120.25
Price Target: $134.50-$136.00 (1st), $142.00-$144.00 (2nd)
Estimated Duration to Target: 66-70d (1st), 118-122d (2nd)
Contract of Interest: $TSM 3/18/22 130c, $TSM 5/20/22 140c
Trade price as of publish date: $5.30/contract, $4.90/contract

TSM broke out but retracted belowTSM the largest chip producer just broke out from their resistance point and retracted below this point during Friday's session. Due to the shortages of 2021 those stocks are poised in my opinion for a great 2022, another point is that its not a US company and will not be affected as much as the US based companies with all of the inflation and FED announcement that are going to take place this year. I have opened a small long position as I believe the stock will push to the upside next week but I would like to know if there is something I am missing. (no financial advise just looking for feedback)


TSM PutTrendlines for continuation to downside. Need to see LOD break for continuation for rest of week.

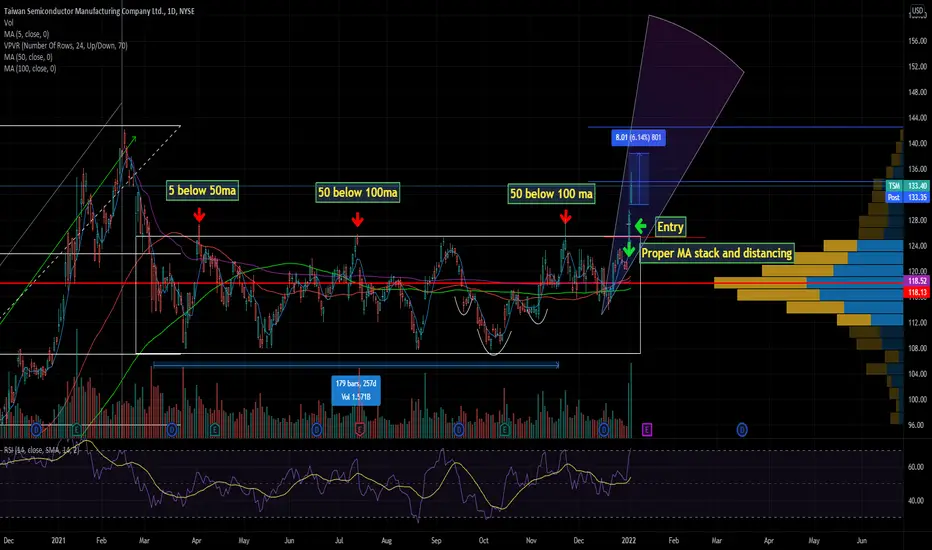
TSM: Real Range BreakEntered a sizeable TSM position upon true break of this accumulation zone. This is also meant to be an education study of how to properly use moving averages. Many traders use moving average crossovers as buy and sell signals. While a crossover can potentially signal the start of an uptrend, they more often signal a non trending accumulation or distribution period. We want to see MA's arranged from shortest term to longest, and some distance between the MA's to determine whether a true uptrend is occurring. Notice how on each one of the false breaks of range, the MA's were not stacked properly, signaling that an uptrend has not yet formed, and is instead still in an accumulation period. This breakout was different, price action gave us both a shortfall and a bullish MA stack, telling us that price action has had enough time to build out a base that can support a new uptrend.
TSMTSM finally breaking out. A full measured move will take it to 142 level. Earnings coming out next week. Will be a good entry on a pull back.

TSM calls and puts: levels to look out for and consider TSM
Price - 128.8
Support - 117.59
Resistance - 131.83
Consider***
Calls above - 135.4
Puts below - 124.01

Beautiful north poll flagBroke out the falling wedge
Hourly Bullish pennant pattern formed at the north pol :)
Good for tomorrow's open .

$TSM Finally breaking out - watch for confirmTSM has finally broken out of the channel. Let's see if we get continuation tomorrow. This one has been range bound for almost a year, leads me to believe there may be more juice this week for a climb higher.
High risk/reward idea is to trade a weekly 130C here with almost 20K contracts being traded today.
TSM breakout TSM could be breaking out on sale numbers coming out over the weekend.
I've been watching this stock for awhile and it has been the lagger of the semis trading under resistance (Whiteline) for awhile.
Currently premarket its trading above that white line but under fibonacci resistance at 125 or. .5
I would like to see a close above 125 for breakout conformation. If we do close above there we're headed back to ATH

RectangleHorizontal trading channel. Basically ranging between upper resistance trendline and lower trendline of support.
You can subtract the upper trendline from the bottom trendline, then divide by 2 to get mid rectangle MR. This level can serve as a stop either way you go with this, up or down
No recommendation
5 touches so far/targets from an upper trendline break out listed above triangle and a break down targets listed below rectangle.
