Trade ideas

NQ, Will History Really Repeat, or Is This a Trap?The chart lays out a familiar rhythm: expansion, consolidation, distribution, and the pullback into heavy demand. We’ve seen this movie before — literally. Prior cycles followed almost the same path, pausing at the same magnet zones and washing into the same liquidity pockets before the next leg.
But here’s the real question:
Is the market lining up for another classic reset, or is this where the fractal breaks?
We’re already seeing early echoes of previous cycles — the topping structure at 25,000, buyers getting tired at the highs, and price starting to drift into the same zones that produced powerful reversals in the past. Two 3-month FVGs sit directly underneath price, and historically, markets don’t just ignore imbalances this size. They come back to clean them up.
But the bigger picture isn’t identical. Index composition is heavier, liquidity conditions are different, and macro flows aren’t the same as 2020–2021. So while the structure rhymes, the environment doesn’t fully match.
Which forces the real tension here:
Does NQ repeat its old playbook and drift toward the 0.5 or even the 0.618…
or does the weight of new-cycle dynamics break the fractal entirely and push us somewhere new?
The market is sitting right at that inflection point.
Hold above the 0.382 → cycle repeat stays alive.
Lose 24,500 → market likely revisits the first FVG.
Reject 25,000 again → deeper rotation becomes the higher-probability path.
This week is where the fractal either confirms… or gets thrown out.


NQ Monday PlayToday the market presents a lot of stacked frameworks.
I'm working with Friday's range and want to see a Turtle Soup above it to get back into the range.
Invalidation point marked on the chart.

Factors That Can Affect the Global Market1. Economic Indicators and Growth Rates
Economic performance is one of the biggest factors influencing the global market. Key indicators such as GDP growth, inflation, employment rates, and industrial output shape expectations about a country’s economic stability.
Strong economic growth increases foreign investment, boosts trade volumes, and encourages risk-taking in global markets.
Weak or negative growth leads to reduced consumer spending, falling demand for imports, and declining stock markets.
Inflation also plays a crucial role. High inflation reduces purchasing power and forces central banks to raise interest rates, slowing down economic activity. Conversely, low and stable inflation creates a favorable business environment.
2. Monetary Policy and Interest Rates
Central banks—such as the US Federal Reserve, European Central Bank, Reserve Bank of India, and Bank of Japan—heavily impact the global market through monetary policy decisions.
Interest rate hikes make borrowing expensive and strengthen the country’s currency. This can reduce stock prices, lower commodity demand, and slow global economic activity.
Interest rate cuts stimulate spending and investment, often pushing global markets upward.
When the US Federal Reserve changes interest rates, the effects ripple across the entire world because the US dollar is the dominant currency in global trade and investment.
3. Geopolitical Tensions and International Conflicts
Geopolitics is a major source of uncertainty in global markets. Conflicts such as US-China tensions, Middle East instability, or Russia-Ukraine conflict affect oil prices, supply chains, trade agreements, and investor confidence.
Wars and conflicts disrupt production and trade routes.
Sanctions limit access to markets and resources.
Political instability causes capital flight and currency devaluation.
Geopolitical risk is especially influential in the energy market, since oil and gas supplies are concentrated in politically sensitive regions.
4. Global Trade Policies and Agreements
Changes in trade relationships between nations strongly affect the global market. Trade agreements promote economic cooperation, while trade wars disrupt supply chains and increase costs.
Tariffs raise the price of goods, reducing demand and affecting corporate profits.
Free trade agreements (FTAs) encourage cross-border business and lead to market expansion.
Import/export restrictions can disrupt sectors that rely on global sourcing.
For example, restrictions in semiconductor exports can impact global electronics, automotive, and technology markets.
5. Technological Advancements and Innovation
Technology drives global market growth by improving efficiency, reducing production costs, and creating new industries. Major technological breakthroughs—such as AI, automation, blockchain, electric vehicles, and biotechnology—reshape sector dynamics worldwide.
Companies adopting new technologies gain competitive advantages.
Older industries may decline due to technological disruption.
Tech-heavy stock markets, like NASDAQ, influence global investor sentiment.
Digitalization has also globalized financial markets through faster trading platforms, online banking, and the growth of cryptocurrencies.
6. Currency Fluctuations and Exchange Rates
Foreign exchange (forex) markets play a pivotal role in global trade. Currency appreciation or depreciation affects international competitiveness.
A strong currency makes exports expensive and imports cheaper.
A weak currency boosts exports but increases the cost of imported goods.
For multinational companies, exchange rate volatility can significantly impact revenue and profitability. Investors also shift capital towards countries with stable or strengthening currencies.
7. Commodity Prices (Oil, Gold, Metals, Agriculture)
Commodity markets deeply influence global economic conditions. Key commodities include crude oil, natural gas, gold, silver, iron ore, wheat, and soybeans.
Oil prices affect transportation, manufacturing, and energy sectors worldwide. Rising oil prices increase inflation and production costs.
Gold prices act as a safe-haven indicator; during global uncertainty, investors buy gold, raising its price.
Agricultural commodities influence food prices and inflation.
Commodity exporters benefit from high prices, while import-dependent nations face economic pressure.
8. Supply Chain Disruptions
Global supply chains are highly interconnected. Events like pandemics, natural disasters, port congestion, and logistical shortages disrupt the flow of goods.
Disruptions lead to:
Higher transportation costs
Delays in production
Shortages of essential components
Increased inflation globally
The COVID-19 pandemic was a major example of how supply chain disruption can destabilize markets for years.
9. Corporate Performance and Market Sentiment
Global markets are influenced by the performance of major corporations. Earnings reports, product launches, mergers, and acquisitions impact investor sentiment and stock indices.
Positive earnings push markets upward.
Weak performance causes sell-offs.
Large multinational companies—like Apple, Amazon, Google, and Tesla—have global customer bases, so their performance influences markets worldwide.
10. Environmental Changes and Climate Risks
Climate change is increasingly shaping global markets. Extreme weather events—such as floods, droughts, and hurricanes—affect agriculture, energy supply, insurance costs, and infrastructure.
Renewable energy investments are rising.
High carbon-emission sectors face regulatory pressure.
Climate events disrupt commodity supply and productivity.
Global markets now price in climate risks as part of long-term investment decisions.
11. Global Health Crises and Pandemics
Health emergencies like pandemics create widespread market disruptions:
Industries like travel, tourism, aviation, and hospitality decline sharply.
Healthcare, pharmaceuticals, e-commerce, and technology see rapid growth.
Consumer behavior shifts dramatically.
The global impact of COVID-19 highlighted how health crises can slow economic growth and trigger global recessions.
12. Investor Psychology and Market Trends
Human behavior and sentiment also affect the global market. Fear, greed, and expectations drive short-term price movements.
Key psychological phenomena include:
Panic selling during crises
Speculative bubbles
Trends created by social media or news
Market sentiment often amplifies economic or geopolitical events.
Conclusion
The global market is influenced by a complex network of factors—economic performance, political stability, technological innovation, currency movements, natural disasters, and investor sentiment. Each factor interacts with others, creating a constantly shifting environment. Understanding these drivers helps traders, businesses, and policymakers anticipate global trends, manage risks, and make informed decisions. Whether it is a change in interest rates, a geopolitical conflict, or a supply chain disruption, every event sends waves across the global economy, shaping the future of world markets.

NQ bottom along with tech and crypto.New ATH coming after the recovery, I think this is the bottom of this down move, I don't think we rocket straight back up to ATH but its a great bet to add Long here. You really only get a move like this once every 5 years.
I think we see Crypto continue to move up, lots of good projects are oversold in the ALT world and lots of good projects are still carrying to torch. Showing strength amongst the weakness.
I think HYPE goes on to lead the way of finance onchain. They are only getting started.
I think S / Sonic goes on to be leader of the next defi summer 2.0.
(will make a post about them soon)
So I'm betting on the fastest horses and calling a decent spot to place bets on the overall condition of the market and i think CRYPTOCAP:BTC leads that race.

NQ Daily Outlook | November 23, 2025I am bullish on the NQ. We are pushing above the 50 ema now so we could see a push higher this week.
I will be looking for longs if the 1hr stays above the emas!

#202547 - priceactiontds - weekly update - nasdaq e-miniGood Evening and I hope you are well.
comment: Neutral. Same reasoning as dax. Here we have a proper bear channel and we are still very low in it. Selling down here is bad because you would be hoping for a break below the lower bear trend line and that’s just not likely. Much more likely is another big bounce for 24600/25000.
current market cycle: bear trend but most likely it’s a trading range 23000 - 26400
key levels for next week: 23800 - 25000
bull case: Bulls are just favored to buy it close to the lower bear trend line. We touched 25200+ last week and there is no reason we can not melt for 25k again from 24300. Reality is, bulls who bought sell spikes made money. The only bulls who lost money are the ones who bought above 25800 and if they scaled in lower, they got out break-even or better. So until we leave behind big bear gaps, this market is not going meaningfully lower.
Invalidation is below 23800
bear case: Below 23800 bears mean business and there is no more support until 23300ish. That’s the bears dream but how likely is it after 6 consecutive bull months? Not very likely. Bears know it. The channel looks pretty amazing and selling down here is a low probability trade. Sure we can get a bear surprise but I would not put my money on it. Above 24606 more bears could cover and wait for 25000+ before shorting again. If bears keep this below 25100 next week, it would surprise me we can expect more downside. Maybe not this year but definitely early Q1 2026.
Invalidation is above 24606
short term: Neutral but more interested in longs close to the lower bear trend line than shorts.
medium-long term - Update from 2024-11-23: 24150 was my latest more realistic bear target for this year and we got 23904. I doubt we can get as low as 23300. At least not with the given environment right now.

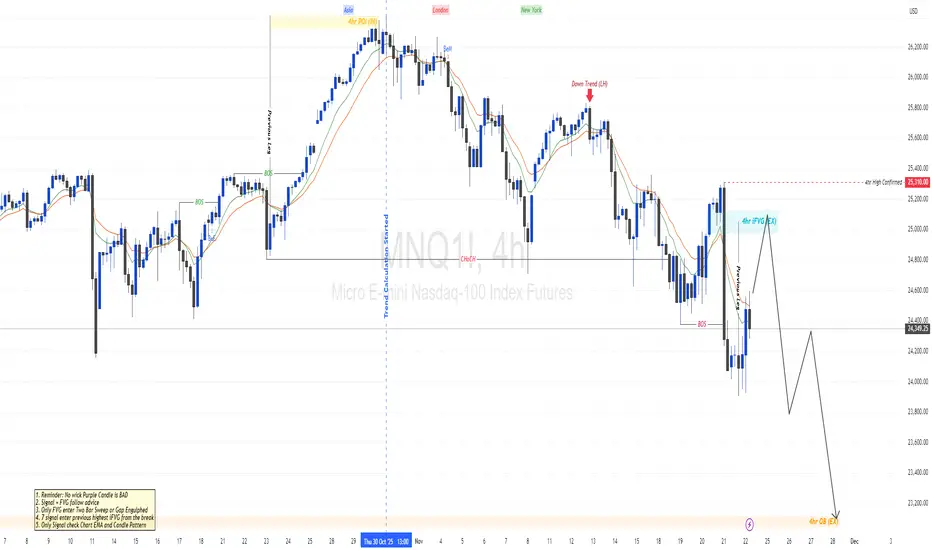
24th Nov- 28th Nov NQ analysisNext week’s price outlook appears bearish.
Market structure shows a clear downtrend following the confirmed break of the previous swing low.
Price is expected to retrace into the iFVG before continuing lower toward the downside order block.
The iFVG aligns precisely with the lowest tick of the highest candle of the prior move and sits in the correct position relative to the previous supply zone.
The order block below is a high-probability area, as five liquidity lows are positioned directly above it.
Also publish a explanation video on this you can check in my profile.
Retracement After Expansion Bearish ~My Idea, Is To retracement NQ Target Is Liquidity Void
Before Expansion Bearish
#Good Look

MONDAY 11-24-25 OUTLOOKBullish outlook to grab higher internal liquidity to fuel the move down. Overall I am still bearish, but I see a push higher being more likely before we continue to sell off. We need a slight pull back to ease the selling pressure in addition to add more fuel to the selling pressure afterwards.

NQ Weekly Recap | November 17-21, 2025Weekly Recap – NQ (Nov 17–21, 2025)
Monday (Nov 17)
Price spent the entire NY session under all EMAs. Clean downside.
Tuesday (Nov 18)
Same thing — stayed under every EMA and continued lower. No strength.
Wednesday (Nov 19)
Choppy during NY. No clean direction or follow-through.
Thursday (Nov 20)
Looked bullish before NY, but as soon as the session opened it failed and dumped under the EMAs hard. Cleanest downside day of the week.
Friday (Nov 21)
Weak push down during NY, then the bigger move up happened after the session ended.
Bias:
Overall bearish week. Price stayed under the EMAs for most of the NY sessions except for Friday’s late push up.
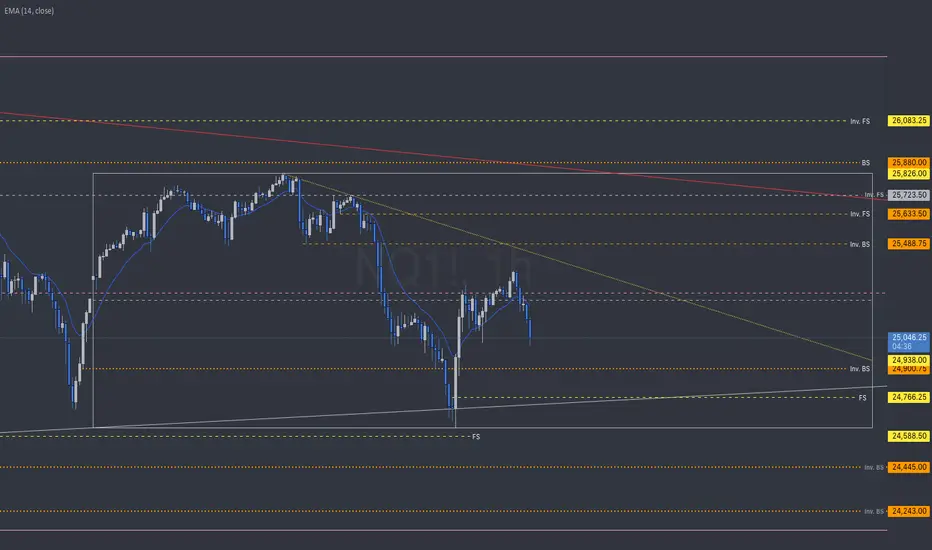
NQ Week 47 (Hourly chart)T.A explained -
BackSide (BS)
FrontSide (FS)
Inverse BS (Inv.BS)
Inverse FS (Inv.FS)
BS & FS levels are expected support when dashed lines, tested when dotted and resistance when solid lines.
The inverse is true for the Inv. BS Inv. FS levels, they are resistance as dashed lines, tested as dotted and support as solid lines.
Monthly timeframe is color pink
weekly grey
daily is red
4hr is orange
1hr is yellow
15min is blue
5min is green if they are shown.
strength favors the higher timeframe.
2x dotted levels are origin levels where trends have or will originate. When trends break, price will target the origin of the trend. its math, when the trend breaks, the vertex breaks too so the higher timeframe level/trend that breaks, the more volatility there could be as strength in the orders flow in to fuel the move.
NQ Higher then Bear MarketThink we have one last leg up in NDX/NQ here then a bear market to follow.


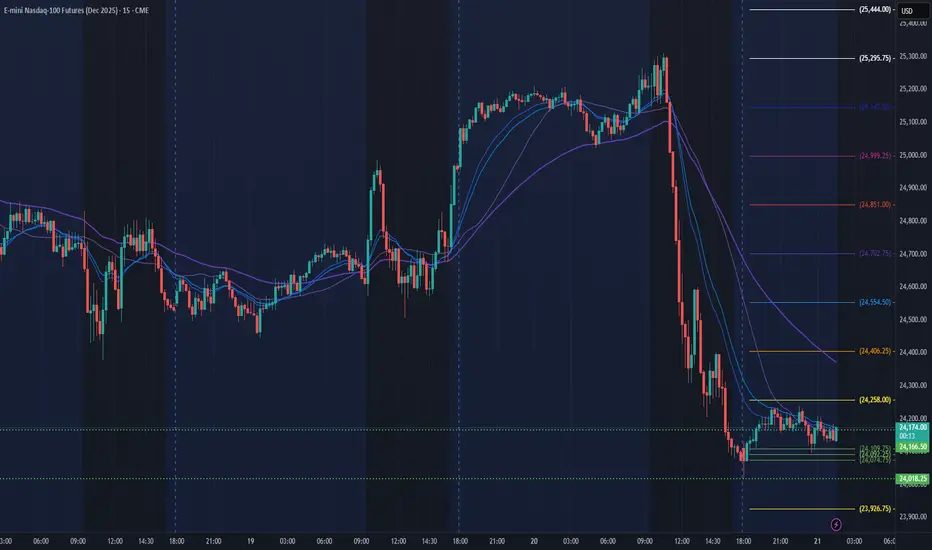
NQ Power Range Report with FIB Ext - 11/21/2025 SessionCME_MINI:NQZ2025
- PR High: 24166.25
- PR Low: 24018.00
- NZ Spread: 331.0
Key scheduled economic events:
09:45 | S&P Global Manufacturing PMI
- S&P Global Services PMI
Session Open Stats (As of 12:35 AM)
- Session Open ATR: 525.13
- Volume: 66K
- Open Int: 301K
- Trend Grade: Long
- From BA ATH: -8.4% (Rounded)
Key Levels (Rounded - Think of these as ranges)
- Long: 26636
- Mid: 25410
- Short: 24039
Keep in mind this is not speculation or a prediction. Only a report of the Power Range with Fib extensions for target hunting. Do your DD! You determine your risk tolerance. You are fully capable of making your own decisions.
BA: Back Adjusted
BuZ/BeZ: Bull Zone / Bear Zone
NZ: Neutral Zone
Bearish Scenario on NQEyeing a bearish scenario on NQ after retracing it to 0.5 to 0.618 fib levels.
Bearish points
- Bearish Divergence on daily
- Rising wedge broken and retested
- Head n shoulder forming
Just waiting on breaking 24000 level to take a legendary short. And I beleive it should retrace back to atleast 0.5 fib level which is close to 21430.
Let's see....
Currently it seems it is going to pump from here to make a LH and then drop from there since it's oversold on Daily timeframe.
Please share your thoughts.

Nasdaq 100 - Analysis
Currently watching this expanding megaphone pattern, should this break down, then a 20-30% drop would be on the table.
the recent drop in NVDA despite strong earnings signals cracks in the AI trade, concern over extending the depreciation of GPUs may also cause cracks as further financial investigation may find.
I am currently short QQQ, with some hedged long positions, but with a strong overall cash position.
should equities fall, then i expect crypto to follow suit, this would all equate to a tremendous buy opportunity in the next 6-12 months.
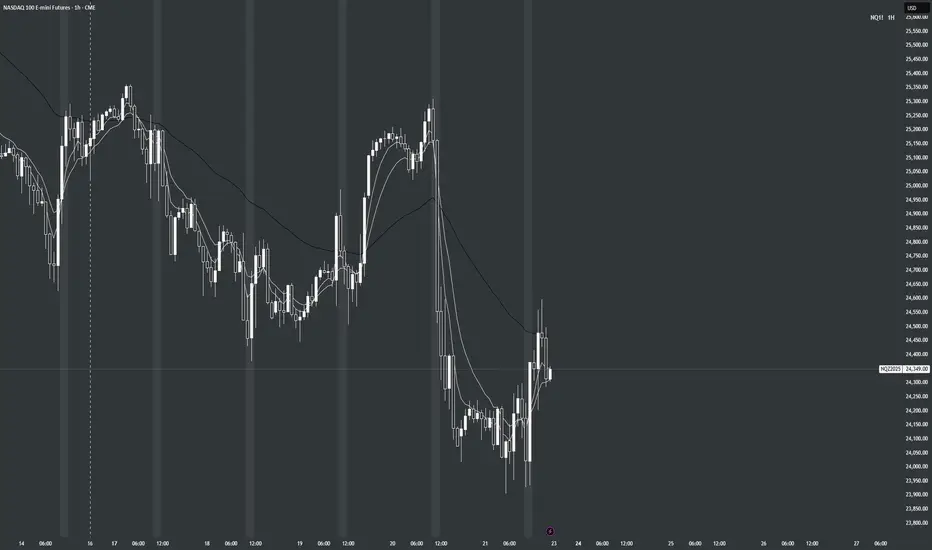
NQ Daily Outlook | November 21, 2025Timeframe Shown: 1H (1-Hour Chart)
EMAs I’m Using:
• 50 EMA (black)
• 5 EMA (white)
• 10 EMA (white)
Price dropped below all of these EMAs during the NY session. On the 1H chart we’re getting a pullback now, and when that happens I scale down to the 5M and look for the same thing — price pulling back into the EMAs and then breaking back below them. That’s where I look for my continuation entries.
Bias: Bearish while we’re still under all EMAs.

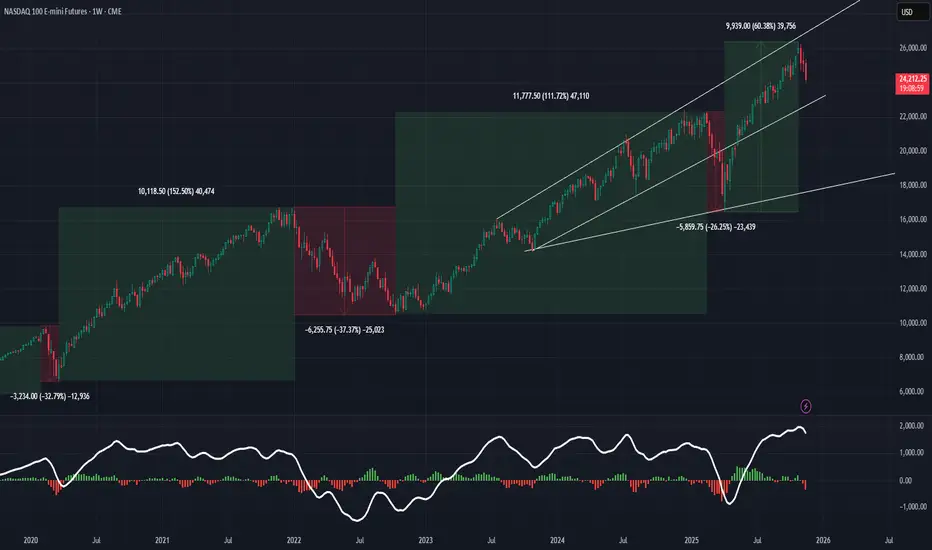
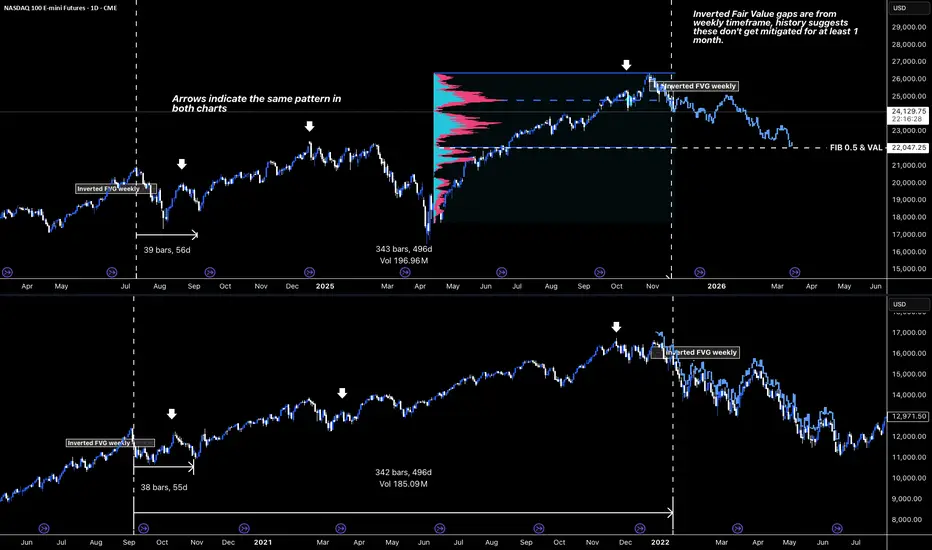
NQ Local top is in, 22,000 the target lowHi All,
NQ is still walking the same path it did in 2020–22.
Same weekly inverted FVG near the top.
Same slow fade after the high.
Same bar count into the rollover.
The fractal underneath isn’t a coincidence — Markets repeat patterns the same way people repeat bad decisions after saying ‘never again.
The downside confluence is hard to ignore:
the 0.5 Fib, the weekly imbalance, and the Value Area Low all sitting on top of each other around 22k.
Three signals, one destination.
Premium is done.
Distribution is done.
Now the market’s heading back to fair value, the same way you head back to the gym after a blowout weekend — not because it’s fun, but because that’s where the reset happens.
The fractal already laid the blueprint:
drift → tag fair value → reflex bounce → finish the imbalance.
Nothing in the current structure says this time is different.
Until that 22k zone is cleaned up, anything above it is just background noise.
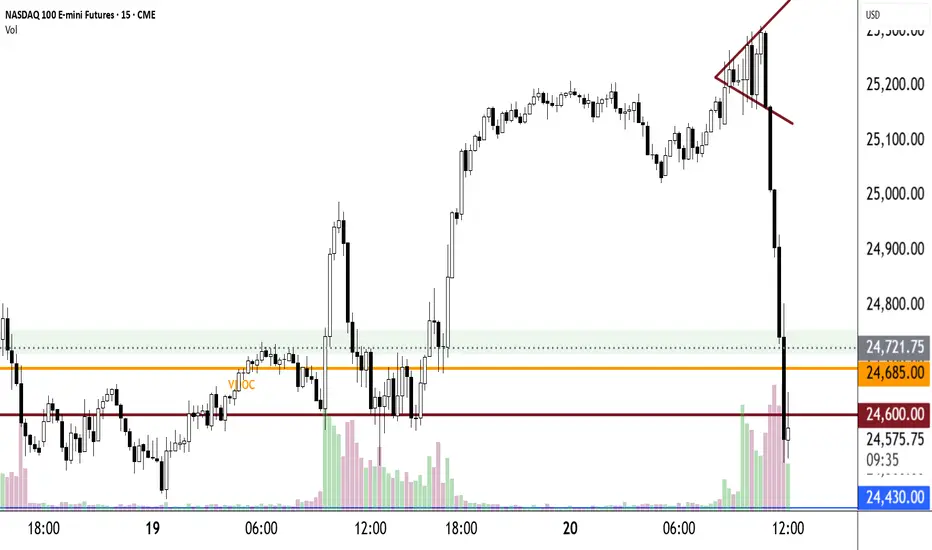
Caution FormationAny reverse formation shouts "Caution!" Turn this pattern around and you have a Symmetrical Triangle which is a consolidation pattern and typically indicates continuation of the trend. It would also be a price coil. This Reverse Symmetrical Triangle is a price expansion. Whenever you see this reverse pattern think Caution.
Right now, 12:05, we have a very high probability win rate BTD trade forming, an Exhaustion Candle immediately followed by a White Bull @ strong near the prior day's close.
Some days require two charts. Today is one of them
.5% risk after taking a loss yesterdaySeeing which PD arrays were being respected and it was the bullish ones, looks like a 1H PO3 coming on now at 10am however.
