Long trade
1Hr TF overview
📘 Trade Journal Entry
Pair: MGC1! (Micro Gold Futures)
Direction: Buyside Trade
Date: Fri 10th Oct 2025
Time: 12:00 PM
Session: LND to NY Session AM
Timeframe: 1-Hour
🔹 Trade Details
Entry: 3,998.3
Profit Target: 4,373.6 (+9.39%)
Stop Loss: 3,972.4 (–0.63%)
Risk-Reward Ratio (RR): 14.9
⚙️ Model Context
Model 010 – Sweep / Trigger / Entry
Setup Sequence:
Price swept the prior swing low and formed a liquidity grab near the breaker block and demand zone. Clear CHOCH (Change of Character) confirmed on 1H timeframe.
Fib retracement alignment with the 0.618–0.705 zone, providing ideal re-entry confirmation.
Volume expansion occurred at breakout, supported by sustained EMA/WMA alignment.
Structure maintained a strong ascending trendline respecting 50EMA and 200WMA support.
🧭 Narrative Context
Price consolidated in the mid-3,900s region following an extended accumulation phase, with multiple FVGs (Fair Value Gaps) and a high-volume zone below acting as structural support.
Institutional order flow confirmed by consistent re-accumulation and sweep of internal liquidity pockets.
Projection levels 4,259 → 4,373 (Fib 2.618–3.618) highlight continuation potential, targeting extended buyside liquidity above 4,300.
📊 Outcome (as of chart timestamp)
Current price hovering near 4,260+, validating trajectory towards projected extension levels.
Trade remains in the upside continuation phase with structural integrity intact above the 4,120 WMA. Trump’s “Trade War 2.0” rhetoric, combined with renewed geopolitical and tariff tensions, is reviving safe-haven demand. TSM earnings volatility and an anticipated Federal Reserve speech could amplify market uncertainty — typically, this may translate into accelerated gold inflows.
Trade ideas

GC Update againSurprised they're pumping it again tonight. Appears MFI is not going to hit my red line, they're just gonna melt it up with no real drops.
Missed out, but I'd rather go big on a sure bet than hold a small position continuously. There's no way I'd have sunk $700k into gold for a long term play, though in hindsight I wish I had, lol
Weekly Outlook — Gold Futures (MGCZ2025)Price is sitting between key levels after last week’s explosive move.
I’m watching 4,300 as immediate resistance — if bulls can’t hold above this level, I expect a sweep toward 4,200–4,150 (H4 + Daily FVGs) before continuation.
Monday might just be a setup day, building liquidity for a Tuesday/Wednesday move.
Key Levels:
🟦 4,392 – Previous Weekly High
🟨 4,300 – Near-term resistance
🟧 4,200 – Daily Low / Support zone
🟩 4,150 – H4 FVG top
Let’s see how Monday sets the tone for the week.
#Gold #Futures #TradingPlan #ICT #PriceAction

Gold GC1 UpdateI said earlier this week that it's supposed to drop but will wind up going sideways instead and it did. I put my money where my mouth is, and went long on GLD calls and ETF because my MFI indicator went oversold then crossed back over the red line.
We'll see if I'm right or not and if the 3hr MFI indicator actually works as well as I think it does. Bought 30 GLD call contracts and 2k shares of GLD, so it's a very sizeable bet.
Gold , final top $8500 area. Still on track !Gold , final top is in the $8500 area top based on the chart. Still on track with corrections and consolidations along the way. Then big bear market with a low of $2500 and then new bull. Not for trading

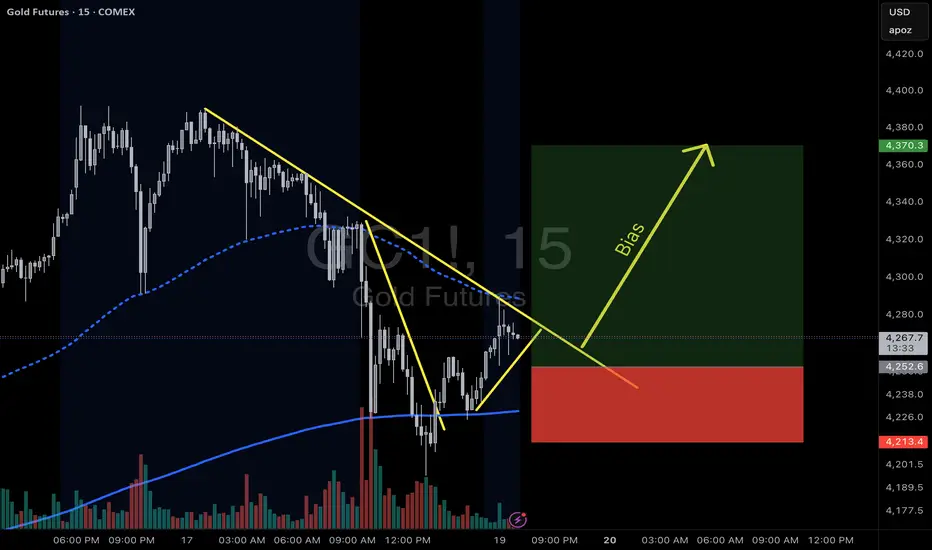
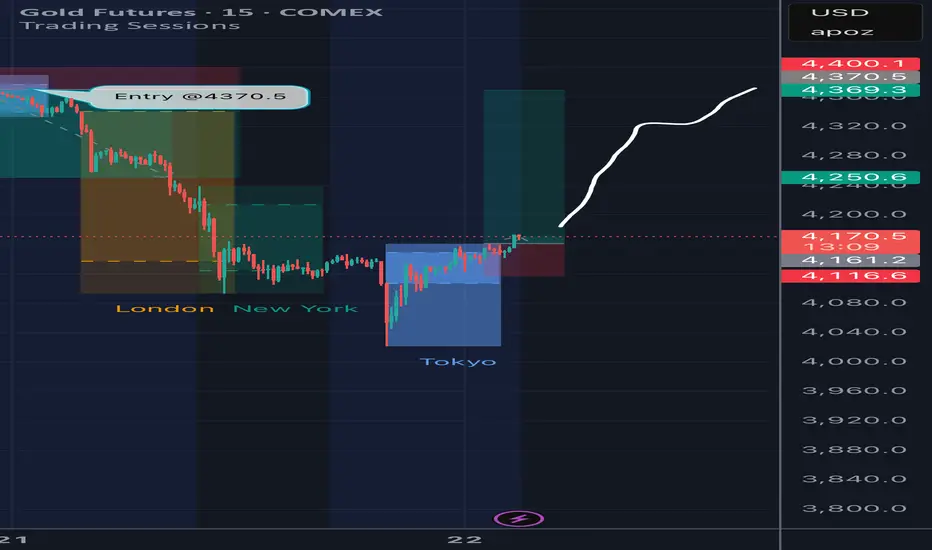
Gold Still Running Hot — No Real Pullback YetPrice exploded out of the 15m FVG during Thursday’s Asian session and hasn’t looked back. Took a long right off that 8PM impulsive candle, scaling in as we broke back above the Previous Daily High.
Now we’re holding steady above 4345 — the midpoint of the Asian range looks like short-term support. If bulls defend this level, we could see continuation toward 4380–4400.
Friday bias: Bullish, unless 4340 gives out.
No clean pullback = no reason to force entries. Let the market prove it.
#GoldFutures #MGC #ICTConcepts #NOFOMO #DayTrading

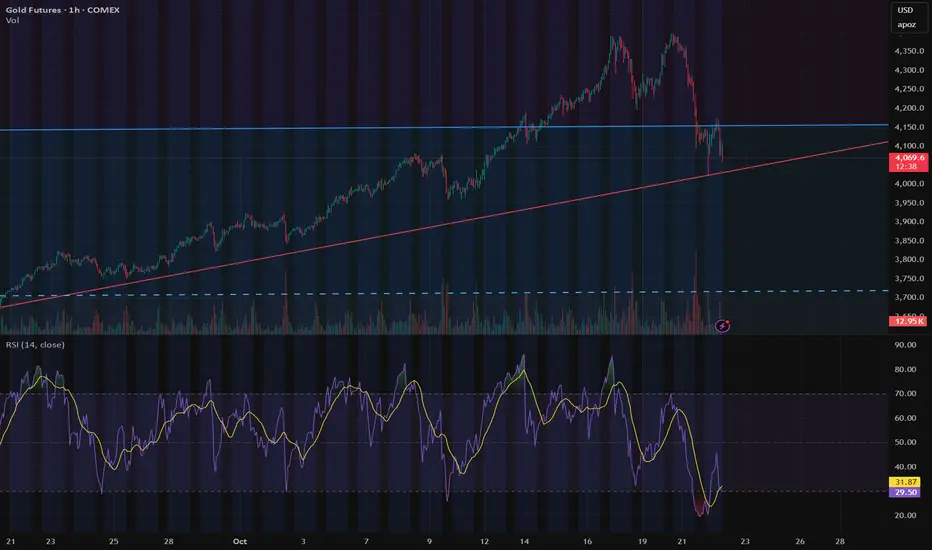
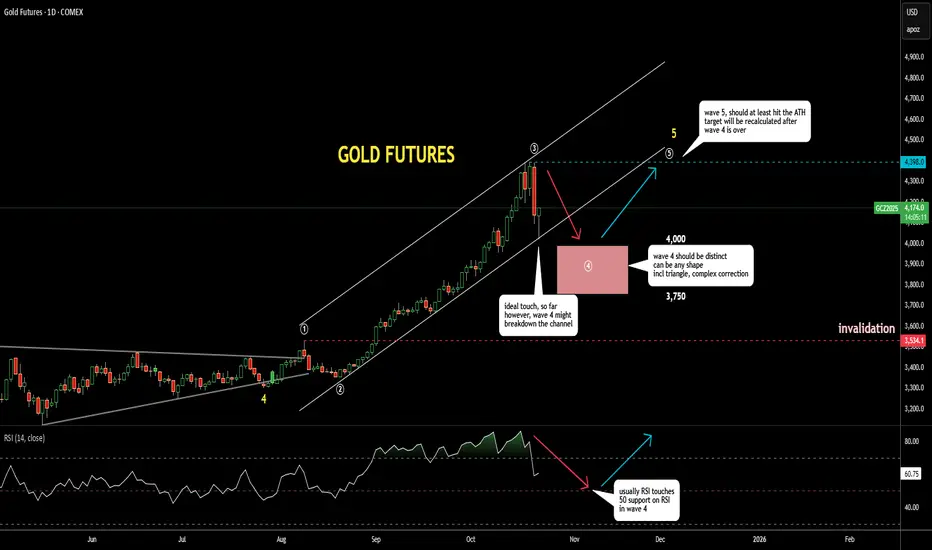
Gold Update 22OCT2025: Wave 4 Correction is in Progress Sooner or later, both overbought conditions and bearish divergence tend to play out — and we’re seeing that now.
Gold just experienced a massive and surprising sell-off, with many stop-losses triggered.
The price dropped $300 in a single day, compared to its usual $50 range.
This likely marks the start of wave 4, as expected. Price briefly touched the bottom of the uptrend channel and bounced off quickly.
However, wave 4 is rarely straightforward.
It can take many corrective forms, such as a triangle or sideways consolidation.
It also tends to be larger than wave 2 and should become clearly visible on the chart.
The target range for wave 4 remains $3,750–$4,000. While $4,000 has already been touched, the corrective structure isn’t fully formed yet.
We should wait for wave 4 to fully develop before setting any expectations for wave 5.
Gold Futures GC - 1:3 opportunity setting up?Based on the market bias Gold may be setting up a 1:3 Risk:Reward? What are your thoughts? Will news impact the balanced flow of Gold?
A good look at some markets that traded very well yesterdayThis is Tuesday morning and I gave a review of a number of markets and I have to apologize for the video that I did for Monday because I picked the worst market... Silver which was contracted and there were all these other possibilities that were set up to go but I picked silver. But this video showed a lot better choice if I'd been more careful and so hopefully this will make up for the previous video. Warren Buffett is giving me indigestion because he is very bearish on gold..... I mean very bearish. Me gold may have a 2 bar reversal that that signifies that the market's going to correct lower since it completed a very profitable ABCd pattern but that's different than saying you're going to lose your wealth if you're an old participant in the markets... Which is what I am so I'm a little concerned because the worst thing I could put my assets in is the American dollar as best I can tell so if I liquidate positions of gold I'm right back where I didn't want to be and that's with the dollar and from what I understand the dollar is Ravishly losing its ability to maintain its purchase power. He does mention that there is a a position you can take where the government guarantees a certain price and it's I don't think it'a bond and it's not the money that you put into your bank account but to me I don't see that as a solution.

GOLD FUTURESAccording to Gann: Gold and the "Square of the Range"---3 squares up in price = 4411. Gold is hugely overbought some are so ready to sell. If December Gold gets to 4411 and shows signs of topping, that do not mean it is the end of the rally.
It is overdue for a pullback it just may continue for a few years.

GOLD | Intermediate Top ReachedI believe gold has reached an intermediate-term peak and is positioned for a significant pullback. However, this correction doesn't signal the end of gold's long-term bullish trajectory.
Price Targets:
Initial target: ~$4000 level
Final target: ~$3700 level

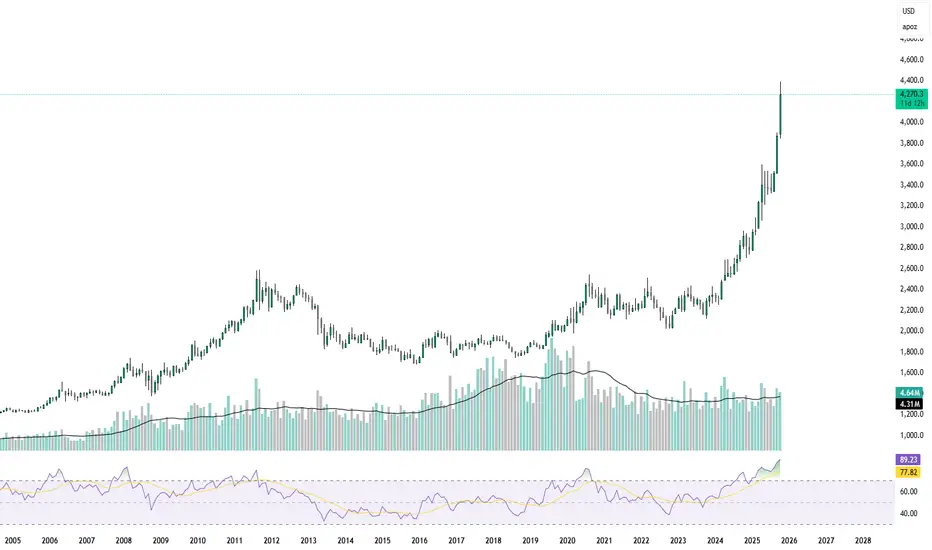
Gold Volatility Surges Above $4000Gold's selloff on Tuesday was its fifth most bearish day's trade since 1970 - according to spot prices from LSEG. Clearly this is a significant event, especially when we consider it occurred at its record high. Let's take a closer look at technical levels.
Matt Simpson, Market Analyst at City Index and Forex.com.

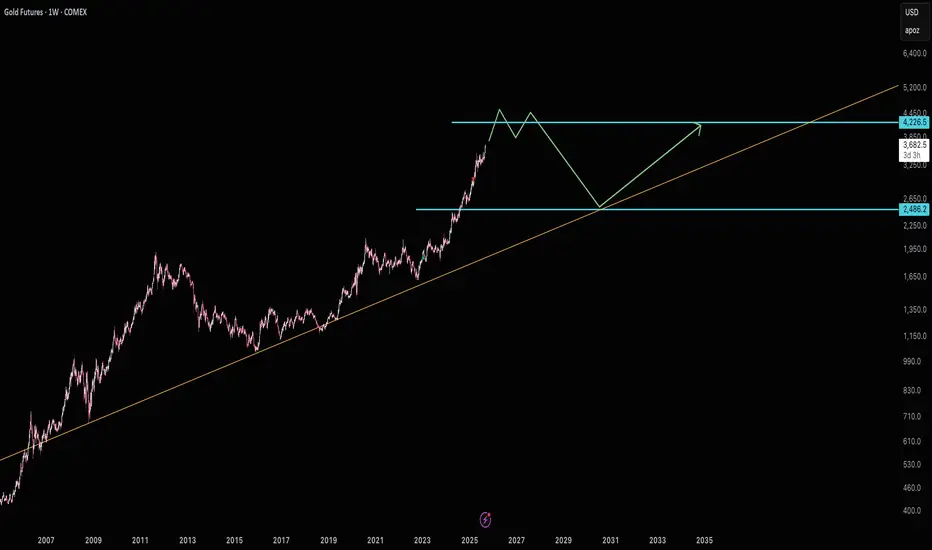
Gold is in a bubbleGold appears to be running straight up to resistance without ever forming support around $2486. This is not a good sign for gold buyers. I'm highly speculating gold will fall back to $2486. This move is similar to 1979. As in 1979 it went significantly higher than resistance before falling all the way back down to support. So be cautious, this could go much higher than $4220 before coming back to reality.
Good luck!
Gold Above 4300 – Watching for FVG Fill Before Next LegPrice consolidated all of yesterday’s Asian and London sessions before breaking bullish through NY, clearing the 4300 resistance.
Today, we’re holding above that breakout level and sitting just beneath the weekly high at 4398.
A 4H FVG rests below price around 4345–4360 — that’s my first area of interest for a retrace and possible continuation higher.
If price dips to fill that gap and shows strength, I’ll look for a long toward 4398–4420.
Otherwise, I’ll wait for a clear reclaim above the weekly high before confirming continuation.
Staying patient tonight — the easy part is waiting for the market to tell me what it wants to do.
#FuturesTrading #Gold #ICT #PriceAction #NOFOMO

GC1 Daily Trade Setup 22/10/25In this update we review yesterday's price action in Gold futures and update the trading opportunity and pivotal price objectives to target. To reivew today's video analysis click here!

Gold to push back up to 4270 Gold is now targeting the highs as liquidity sits there waiting for the taking. Price just broke structure to the upside on m5-H4! Momentum is for sure expected as FVG acts as a stronger attraction towards the liquidity sitting above it.
Gold Outlook – A Historical Signal of an Impending DeclineSince 1970, gold (GC – CME) has experienced six major crashes, each occurring right after eight consecutive green weekly closes.
In every case, the market first showed what seemed like a “healthy buying phase” — strong optimism and aggressive inflows — before a sharp reversal took place.
Historical data reveals a clear pattern:
In the first week after the streak, gold fell an average of 11.8%.
By week four, the average drawdown deepened to 23.5%.
And within eight weeks, the total average decline reached up to 33%.
This pattern suggests that gold tends to build extreme bullish momentum before major corrections, as traders chase prices higher and sentiment detaches from fundamentals.
Currently, after another extended streak of weekly gains, gold once again sits in the same statistical zone that historically preceded a significant pullback.
If history repeats itself, we may soon witness a sharp correction — a natural reset after an overheated rally.

GOLD (XAUUSD): Bullish! IRL To ERL! Look For Buys!In this Weekly Market Forecast, we will analyze the Gold (XAUUSD) for the week of Oct. 13-17th.
Gold is bullish on all HTFs. Selling is not an option. Moving from IRL to ERL. Only buys are valid.
Enjoy!
May profits be upon you.
Leave any questions or comments in the comment section.
I appreciate any feedback from my viewers!
Like and/or subscribe if you want more accurate analysis.
Thank you so much!
Disclaimer:
I do not provide personal investment advice and I am not a qualified licensed investment advisor.
All information found here, including any ideas, opinions, views, predictions, forecasts, commentaries, suggestions, expressed or implied herein, are for informational, entertainment or educational purposes only and should not be construed as personal investment advice. While the information provided is believed to be accurate, it may include errors or inaccuracies.
I will not and cannot be held liable for any actions you take as a result of anything you read here.
Conduct your own due diligence, or consult a licensed financial advisor or broker before making any and all investment decisions. Any investments, trades, speculations, or decisions made on the basis of any information found on this channel, expressed or implied herein, are committed at your own risk, financial or otherwise.

Gold to Push DownPrice has shown liquidity sweep of the Highs while breaking structure on the smaller timeframe m5. Price has told me it intends to now wipe out previous lows (retail pending orders) and I am targeting the lows of yesterdays NY Session as first target, and London Low as 2nd Target.

Nears the Boss Resistance at $4,489 — Revaluation Era Incoming?Gold (GC1!) Nears the Boss Resistance at $4,489 — Revaluation Era Incoming? 🟡👑
No hype — this is it.
Gold Futures (GC1!) have pushed past $4,400 , approaching what I’ve long marked as the Boss Resistance at $4,489 . This is the final gate — and it's been sitting on my chart for years, untouched... until now.
That $4,000 level? It was our signal. The failed short attempt there wasn’t a mistake — it was confirmation. Since that breakout, gold’s been in vertical mode.
📍 Now we’re in the danger zone.
Expect chop, traps, or a reversal between $4,000 and $4,489 unless the Boss gets taken out with strength.
🔍 Big Picture: Revaluation May Be Coming...
The price action is wild — but the backdrop is even bigger.
🧾 Did you know the official U.S. valuation of gold is still $42.22 per ounce?
New research suggests Washington may be considering a gold revaluation — just like Roosevelt did in 1933. That move alone boosted U.S. gold wealth by 69% overnight.
Why revalue now? Here’s what’s brewing:
• 📉 National debt is exploding
• 🪙 Gold ETFs are soaking up demand
• 🌍 Central banks are stacking gold to escape USD dependency
• 💰 Revaluation would instantly add trillions in assets — without printing a dime
This isn’t just a rally — this is a structural reset.
📈 Levels Recap:
• Boss Resistance: $4,489 👑
• Breakout Floor: $4,000
• Intermediate Support: $3,602 and $3,000
• Long-Term Flip Zone: $2,537
Markets don’t move because of candles — they move because of confidence.
🧘 Mindset Check 🧘
Gold is rising because trust is falling.
We are entering an era where sound money is not just a preference — it’s a necessity.
One Love,
The FXPROFESSOR 💙
Gold front runs-----BTC Follows....

Kahan Ja Ke Rukega?? Kahan Tak chamkega?Gold!
High Today 1.32Lac
A Hammer Candle on Daily Time Frame
I see Gold Slipping till 1.21Lac and if it cant hold that Leven
It Should Go Down till 1.11Lac
Lets Wait and Watch.....

Gold’s Pullback: The Dip Everyone’s Afraid to Buy🏆 Gold’s Pullback: The Dip Everyone’s Afraid to Buy 🏆
Gold just gave us the pullback we’ve been waiting for. After an incredible vertical run to $4,400, price has tapped right back into long-term trend support — exactly where past rallies have launched from.
Zoom out on the weekly channel and it’s clear:
Momentum spikes look scary, but historically they’ve reset just before the next leg up.
Volume confirms conviction — this isn’t a fade; it’s a reload.
On the 4H chart, buyers are already defending the trendline like clockwork.
On the 15M, we’re seeing the first signs of stabilization.
💡 My take:
This isn’t the time to panic — it’s the time to position.
“Buy fear, sell greed” wasn’t written for stocks; it was written for gold.
🎯 Watch zone: $4,000–$4,050 — that’s my reload range.
Next resistance: $4,400 → $4,800 if the structure holds.
📈 I’m buying the dip. Are you brave enough to?
#Gold #GC1 #Comex #Futures #BuyTheDip #Macro #Commodities #TrendFollowing #TechnicalAnalysis