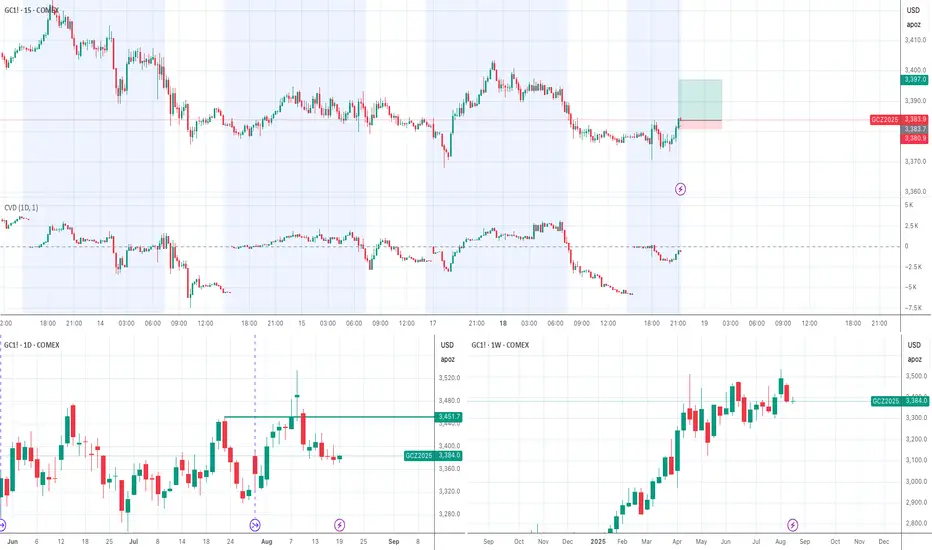
GC Local Breakout to Top of Daily Range ✅ Pre-Trade Checklist
Session context: Range Bound
Daily Bias: I'm still holding on to a long bias, but we are definitely in a daily downtrend
Key levels: 3370 at bottom of range, 3400 at top of range
CVD and delta structure: Strong positive CVD approaching the breakout level
Entry, SL, and TP are at reasonable levels on the order book
Calculated Risk: 5 MGC for $150 risk
📊 Trend Follow (Order Book Focus)
Clear directional move established (impulse leg breaking structure)
Pullback to value area / trendline / support-resistance level
Order book shows a clear liquidity target in the direction of the move.
CVD aligned with trend
Pullback shows **lower volume + weaker delta** vs. impulse leg
No absorption blocking continuation at the level
Entry at level of support on order book
🎯 Trade Execution
Entry: 3389.9
Stop: 3380.9
Target(s): 3395.9
R:R: 4:1
📓 Post-Trade Notes
Outcome: TBD
Plan followed? No
If not, what rule was broken? I don't usually trade local breakouts, so this trade is not really in plan for me.
Lessons learned:
GD1! trade ideas
Gold Futures | Accumulation in Play – Watching for Manipulation Gold Futures are currently sitting in the Accumulation phase of an AMD sequence. Price is ranging just above the Daily/H4 FVG demand zone (3350–3360) after rejecting supply at 3387–3394.
Here’s what I’m watching:
Accumulation: Current consolidation between 3368–3387.
Manipulation: A clean sweep of yesterday’s low (3368) would complete this phase.
Distribution: If manipulation plays out, I’ll look for price to rotate higher, targeting 3387 → 3404 and potentially higher levels.
⚖️ Bias: Waiting for liquidity run before positioning long.
No need to rush — the sweep is the confirmation. Until then, patient observation.

Learning Video On Gold Future 18th AugGold Future had doing consolidation on downside & expected to move further down

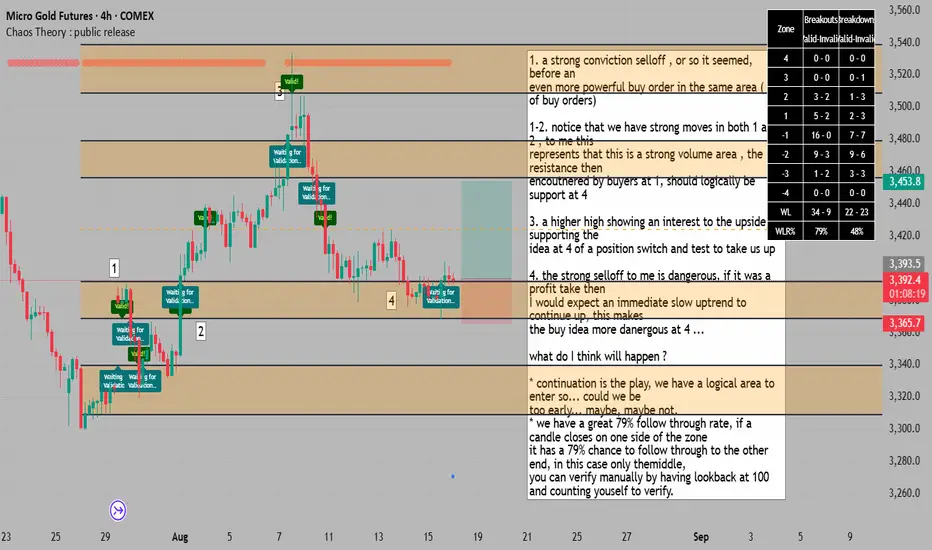
an uptrend returns to an area of strong action , continuation?1. a strong conviction selloff , or so it seemed, before an
even more powerful buy order in the same area ( set of buy orders)
1-2. notice that we have strong moves in both 1 and 2 , to me this
represents that this is a strong volume area , the resistance then
encoutnered by buyers at 1, should logically be support at 4
3. a higher high showing an interest to the upside, supporting the
idea at 4 of a position switch and test to take us up
4. the strong selloff to me is dangerous, if it was a profit take then
I would expect an immediate slow uptrend to continue up, this makes
the buy idea more danergous at 4 ...
what do I think will happen ?
* continuation is the play, we have a logical area to enter so... could we be
too early... maybe, maybe not.
* we have a great 79% follow through rate, if a candle closes on one side of the zone
it has a 79% chance to follow through to the other end, in this case only themiddle,
you can verify manually by having lookback at 100 and counting youself to verify.
GC Futures – Will Bulls Defend the Daily/H4 FVG Overlap?Gold Futures opened the week pressing directly into a stacked Daily + H4 FVG demand zone (3350–3360). Price action is sitting just above this level, making it the key battleground for the week.
Support: 3350 (FVG low), 3332 liquidity sweep
Resistance: 3377 → 3394 (prior D-H), 3451 (M-H)
Scenarios: Bounce off demand could target 3380–3394, with a reclaim opening 3420–3450. Failure here points to deeper liquidity at 3332.
Asian session may set the early range, but real direction likely comes during London/NY killzones. Watching closely for reaction inside the FVG overlap.

Shorting Gold again I will be amazed if this short dosent play out.
Those two red lines on are the actual stoploss placement. I thing the price should stretch beyond those two red lines.
for more safty, use the second stoploss as its more wider but safer than the first one.
Hopefully it goes through.
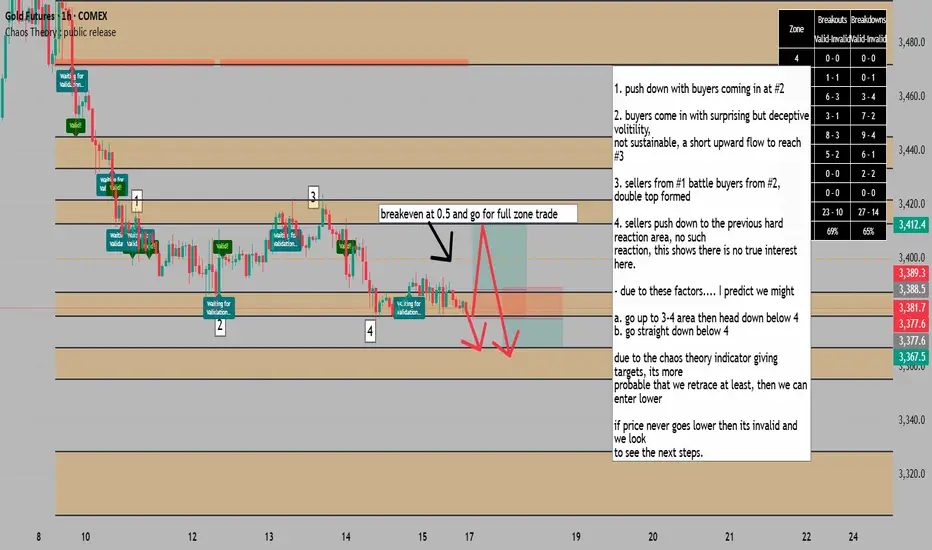
gold in clear downtrend : retrace or continuation down expected
1. push down with buyers coming in at #2
2. buyers come in with surprising but deceptive volitility,
not sustainable, a short upward flow to reach #3
3. sellers from #1 battle buyers from #2, double top formed
4. sellers push down to the previous hard reaction area, no such
reaction, this shows there is no true interest here.
- due to these factors.... I predict we might
a. go up to 3-4 area then head down below 4
b. go straight down below 4
due to the chaos theory indicator giving targets, its more
probable that we retrace at least, then we can enter lower
if price never goes lower then its invalid and we look
to see the next steps.
GOLD Outlook. 15.08.2025, FridayCOMEX:GC1!
Expecting a massive short on gold. Will be hunting for the New York meltdown

Gold Futures – Waiting for the Flush Before the Long (Asian KillMarket Context:
Gold is sitting right inside a confluence zone — overlapping Daily + H4 Fair Value Gaps at 3,375–3,380. This zone also aligns with the lower boundary of last week’s range (W-L at 3,397).
What I’m Watching:
Going into the Asian Killzone, I’m looking for an impulsive spike down into this FVG.
This move would ideally push below 3,375, tag liquidity, and create DOM excess — the kind of aggressive selling that often marks exhaustion before reversal.
ADX is above 25 and rising, signaling momentum is strong — but we’re at a potential pivot level.
Bullish Setup Criteria:
Flush down into 3,375 or slightly below.
DOM excess showing absorption (stuck sellers).
Strong rejection candle (M1/M5) followed by bullish follow-through.
Targets if Triggered:
T1: 3,397 (Weekly Low)
T2: 3,423 (Daily High)
Stretch: 3,451 (Monthly High)
Invalidation:
1H close below 3,375 without immediate reclaim.
Summary:
Patience is key. I want to see sellers press in during Asia, fail to break down with continuation, and then get run over on a squeeze higher. If we get the right reaction, this could be the start of a strong move into Weekend.

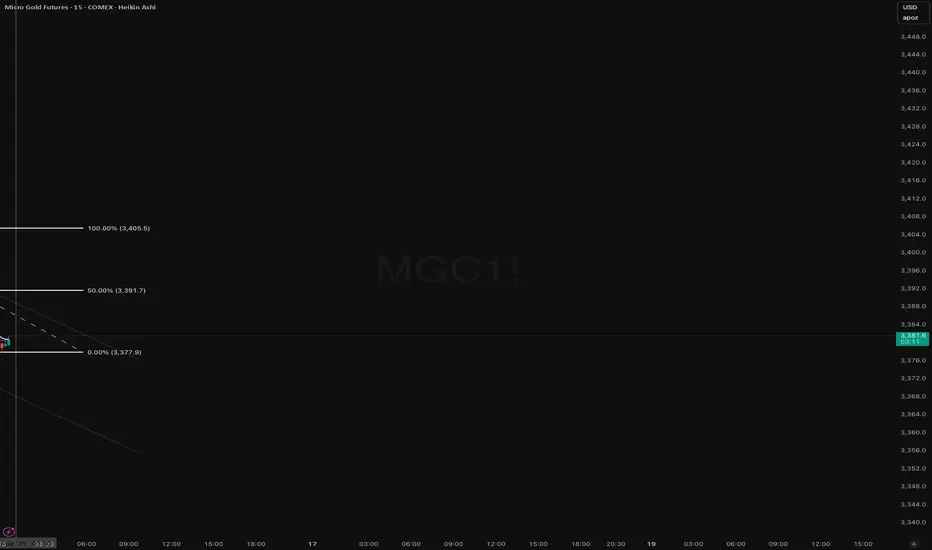
Will Gold Rip or Slip from Here?Heading into the Tokyo session, MGC sits in a critical decision zone. Price action on the 5-minute shows a clear double bottom structure forming near $3,778 a level that has already acted as a demand shelf twice today. From a quant perspective, we have a short-term oversold condition colliding with intraday support, which typically presents a mean-reversion probability spike in low-liquidity Asian hours.
Bullish scenario (42% probability):
- Confirmation trigger is a break and hold above $3,787 (micro neckline).
- Immediate resistance comes in at $3,790–$3,794 (local VWAP + micro EMA confluence).
- If liquidity builds, stretch target aligns with the 50% fib retrace of the last swing at $3,391.7 (highly dependent on overnight momentum continuation).
- Risk: Tight stop just below $3,776 to avoid chop whipsaws.
Bearish scenario (58% probability):
- Failure to reclaim $3,787 opens the door for liquidity sweep below $3,778.
- Initial target $3,770, with potential extension toward $3,765 if Asia volume remains one-sided.
- Downside bias is supported by the broader 1H downtrend, VWAP resistance slope, and previous session imbalance still unfilled.
Factors in play:
- VWAP slope: Bearish.
- EMA separation: Expanding to the downside, signalling trend continuation potential.
- Volume profile: Thin liquidity below $3,778 increases probability of a stop-hunt flush before any reversal.
Tokyo session game plan:
Wait for breakout confirmation either a micro double bottom neckline break for the long scalp, or a rejection for the short continuation. Execution discipline is key; Tokyo often gives one clean directional push before stalling into consolidation.
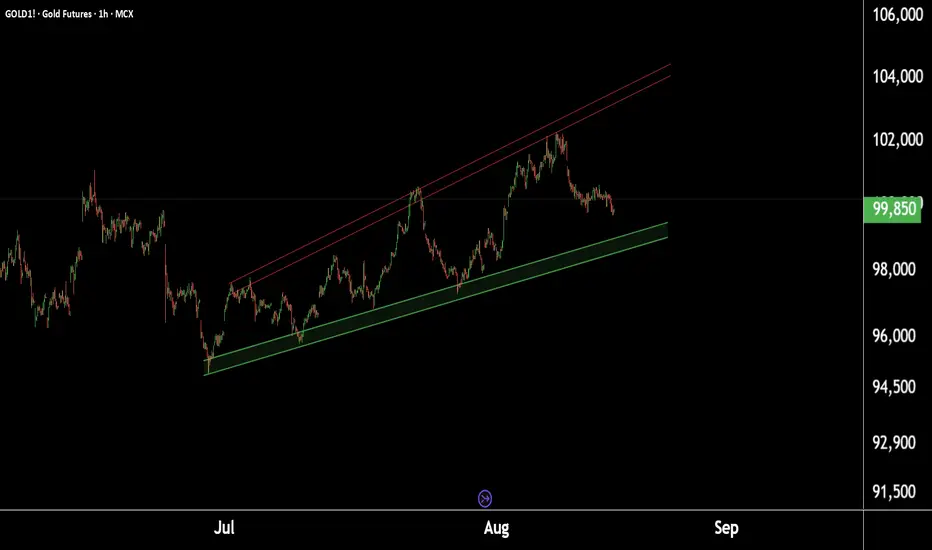
Gold at Crucial Levels – Buy or Sell? Watch These Key Price ZoneDaily Gold Update:
This is the daily timeframe chart of Gold1!.
Gold1! is forming an ascending broadening wedge pattern with support in the ₹98,500–₹98,800 range.
If this support holds, we may see higher prices.
However, if it breaks, Gold1! could decline towards its pattern target near ₹95,000.
Thank You !!
Gold Short Going to take this short today.
Looks like a good short to be honest and i dont see anything bullish on the chart.
If iam rating this short, i would say 6 out of 10 this will play out right.
Hopefully it goes through :D
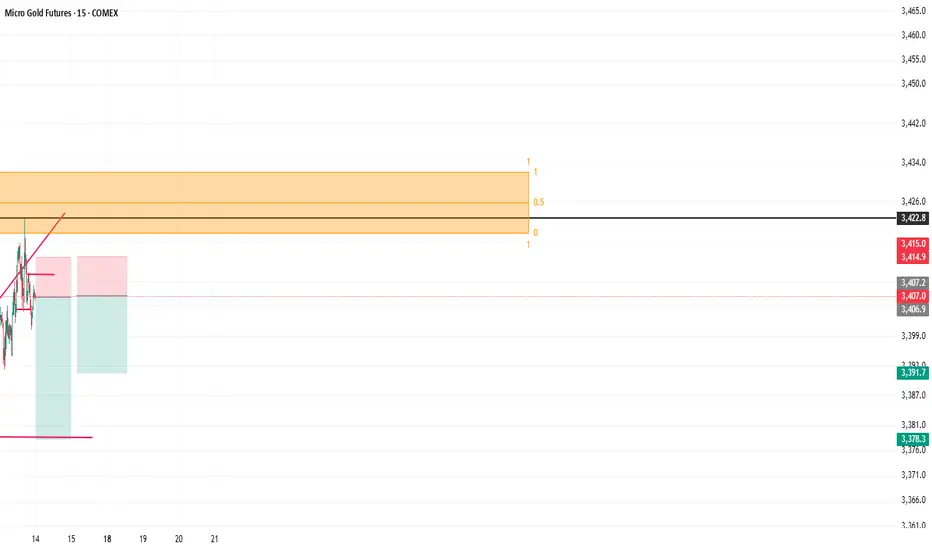
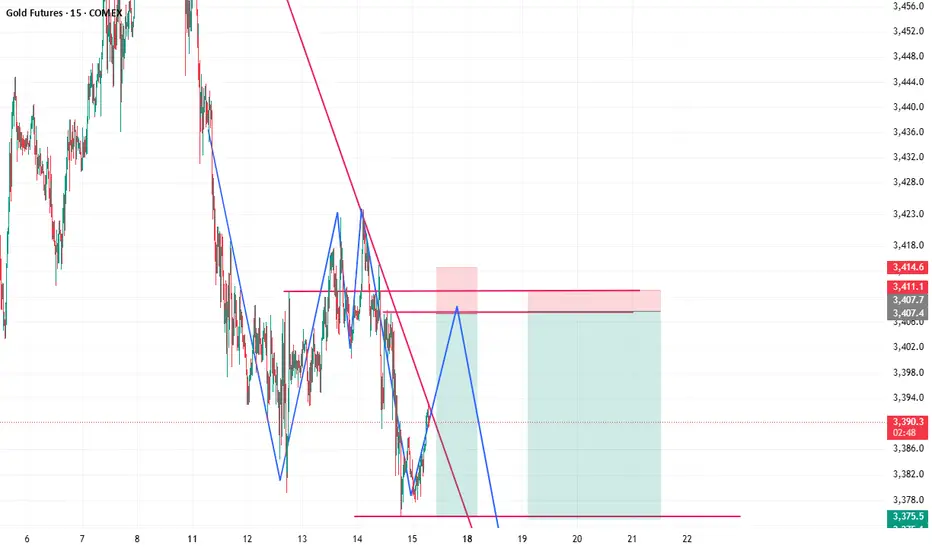
Gold Futures – Testing Trendline ResistanceGold has rallied back into a converging resistance zone — the intersection of the upper short-term trendline and longer-term descending trendline. Price is showing signs of hesitation here.
Price is pressing against the red diagonal resistance.
This level has rejected multiple times.
Setup targets a pullback toward mid-channel support near 3,407, then 3,388.
Stop positioned above resistance to protect against a breakout continuation.
Gold Futures – Bearish Target Hit… But the H4 Gap Still WaitsYesterday’s sessions made their move for the higher bearish target, leaving the H4 & Daily FVG untouched below. This sets up an interesting scenario: will price roll over to fill the gap next, or keep hunting liquidity above?
Key levels and volume profile zones are adjusted for today.
Premium supply zone reached ✅
H4/Daily FVG still in play 📉
Watching London Killzone for impulsive confirmation
Patience is the edge — no clean setup, no trade.

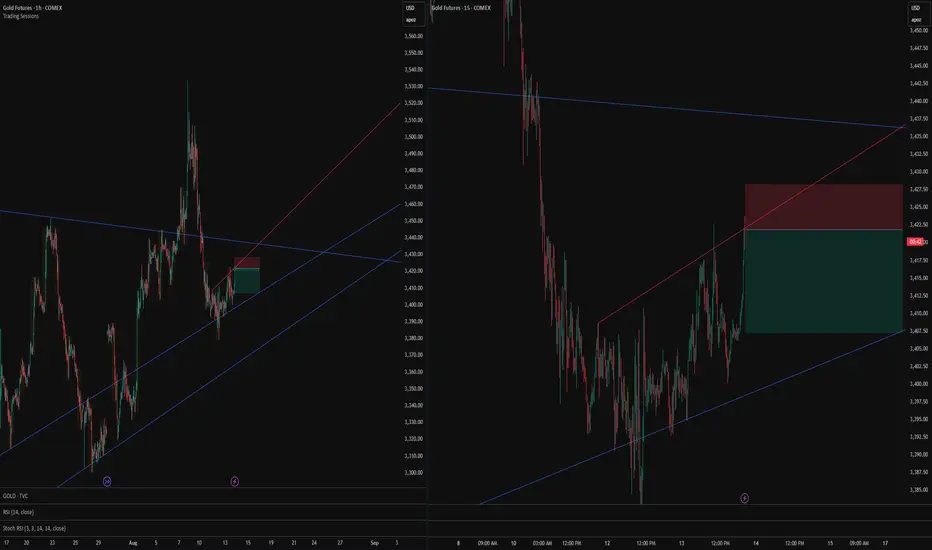
Tokyo Gold Play: 68% Short Bias, But Watch the FlipAlright, here’s where we’re at going into Tokyo. Gold’s stuck right between a rock and a hard place. On the 1-hour, we’ve just bounced off the upper side of a big descending channel and couldn’t even sniff past that 50% fib from the 3,510.9 → 3,386.3 drop.
On the 5-minute, it’s even cleaner: double top at 3,420.8, neckline chilling at 3,400.9, and we’re camped right at VWAP under a short-term downtrend line. Everything’s coiling, and whichever side breaks first is probably gonna run the table for the session. My bias? Still leaning bearish 68% downside odds based on the structure, the fibs, and how order flow’s been stacking.
The Bigger Picture (1H)
- Rejected straight off the channel midline, couldn’t crack 3,448.6 (50% fib).
- Lower highs still printing since Aug 8.
- Major support sits at 3,386.3 that’s the line in the sand for the next leg down.
Intraday Setup (5M)
- Clean descending trend line from the highs.
- Double top locked at 3,420.8, neckline at 3,400.9.
- Price hugging VWAP, which is acting like a lid.
Bearish Plan (Main Play – 68%)
- Trigger: Lose 3,404.0 (VWAP + fib cluster).
Targets:
- 3,400.9 (neckline)
- 3,392.4 (fib projection)
- 3,386.3 (1H support)
Why I like it:
Multi-TF downtrend, rejection from key levels, and lower-high flow on the 5M.
Bullish Backup Plan (32%)
- Trigger: Get back over 3,410.9 and crack 3,420.8.
- Targets: 3,424.9, 3,448.6 (HTF fib)
- Why it’s risky: Would need a trend line break + VWAP reclaim with decent volume.
Tokyo Flow
If nothing big hits the wires, Tokyo usually just extends NY’s late session move. Right now, sellers still have the ball unless buyers rip us back over 3,410.9 with conviction.
Quick Stats
- ATR(14) 1H: $17.2 → plenty of range for TP2 in one session if we trend.
- VWAP deviation ±0.25% lines up with our fib levels.
- Downside edge: 68%, Upside edge: 32% from my multi TF model.
Tokyo’s not usually the session that throws the knockout punch, but tonight’s setup has all the right ingredients for a clean move if we get that break. I’m leaning short until proven wrong, and always scalping. Watching 3,404 as the tripwire. If we hold under it, sellers probably drag this into the low 3,390s before the dust settles. But if buyers punch through 3,410 and especially 3,420, I’ll flip the script and ride the squeeze. No bias is worth blowing up a trade levels first, ego second.

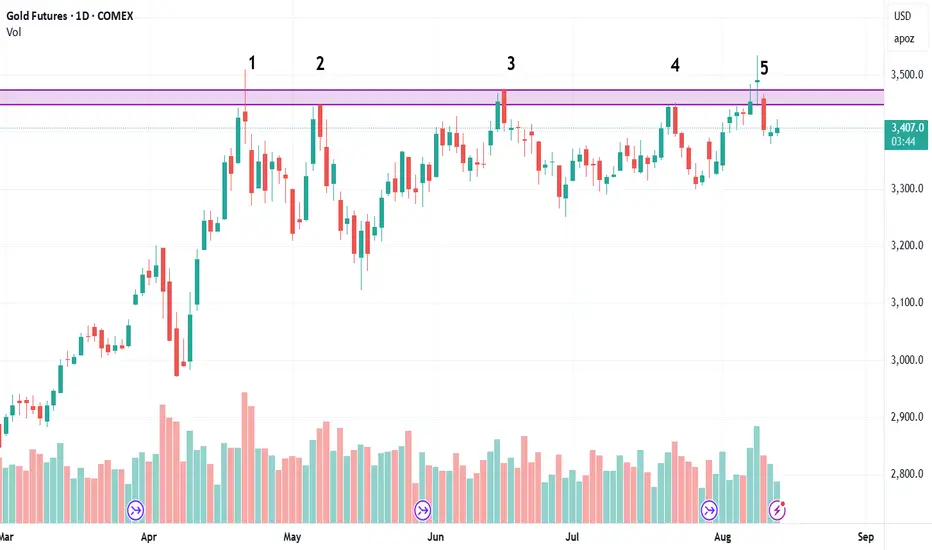
6th time is the charm for Gold ? COMEX:GC1! has been tried pushing through that ceiling near $3500, five separate times.
Soon it may try the 6th time. If it does push through convincingly, the upward move might be violent.
It is like having two cup and handles back to back. Can't wait to play it long when it happens. Will play TVC:SILVER as well.
Do you agree?

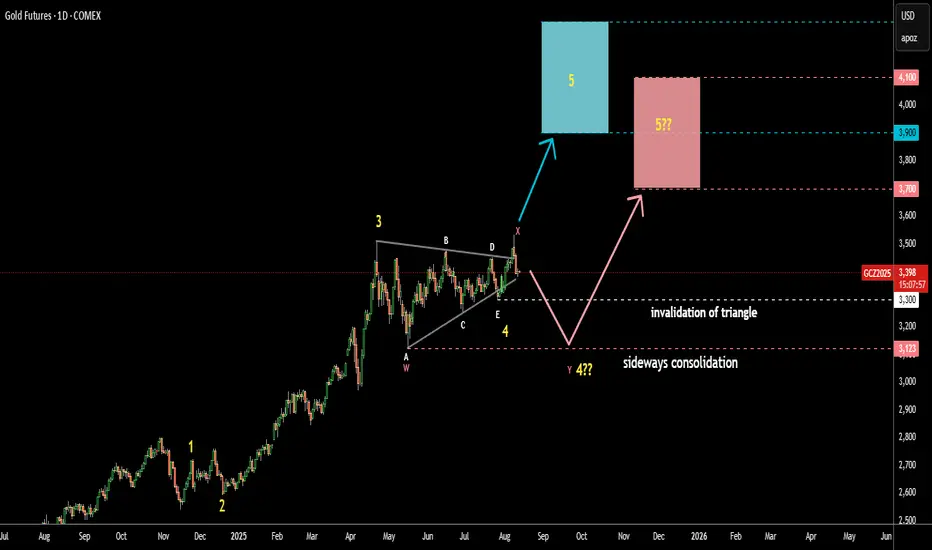
Gold Update 13AUG2025: Risk of Sideways Consolidation Last Friday, August 8, the price failed to progress above the April top as it closed underneath. Hence, there are two possible scenarios from here:
The price could have just completed the first wave up in a larger wave 5, and we may see a retracement. This setup remains valid as long as the price stays above the last wave E of the Triangle at $3,300.
The large sideways consolidation (WXY) might take shape, potentially retesting the bottom of wave A at $3,123. In this case, the target could drop lower, with potential support in the pink box area between $3,700 and $4,100.
Which one do you think plays out?
Gold Futures: Low ADX Signals Liquidity Play Before TrendGold Futures (MGC) continues to consolidate with ADX below 25 across all timeframes up to the Daily, signaling that the market is not ready to trend just yet.
Yesterday’s session was mostly sideways, building liquidity on both sides of the range. With the H4 and Daily FVG overlap still in play, I’m watching for a potential sweep of yesterday’s low into the Daily FVG zone before any sustained attempt higher.
However, low ADX conditions mean price is more likely to rotate between liquidity pools than run in a clean, one-sided trend. That opens up the possibility of:
Scenario A: Direct sweep of yesterday’s low → fill the Daily FVG → bounce toward midrange.
Scenario B: Fake bullish breakout into untested supply (3,410–3,420) before the low sweep.
Scenario C: Overshoot of the low into the 3,350 HVN before any meaningful reaction.
Plan:
Stay patient, focus on killzone impulsive displacement after liquidity is taken, and keep profit targets tighter — aiming for midrange or HVN instead of chasing extended moves.

Who Has Bought the Most GoldSince the inflation hit a high at 9% in 2022, China, Turkey and Poland have been the top 3 buyers of Gold, including in the first two quarters of this year.
It’s not just these countries; many other central banks have been stockpiling gold since (iii) July 2022. Then gold prices were at around US$1,800.
Are central banks still buying as much gold today?
Micro Gold Futures and Options
Ticker: MGC
Minimum fluctuation:
0.10 per troy ounce = $1.00
Disclaimer:
• What presented here is not a recommendation, please consult your licensed broker.
• Our mission is to create lateral thinking skills for every investor and trader, knowing when to take a calculated risk with market uncertainty and a bolder risk when opportunity arises.
CME Real-time Market Data help identify trading set-ups in real-time and express my market views. If you have futures in your trading portfolio, you can check out on CME Group data plans available that suit your trading needs www.tradingview.com

Gold Prices Slide as Geopolitical Calm Sparks Market DivergenceIn a surprising turn of events, gold prices experienced a sharp decline on Monday, reflecting shifting investor sentiment driven by easing geopolitical concerns and evolving market dynamics. The precious metal fell approximately 1.65% overnight, with the current trading price around $3,399 as of this writing. This downtrend marks a significant departure from recent stability, highlighting the complex interplay of global events and market positioning.
Geopolitical Factors and US Dollar Dynamics
The primary catalyst behind the recent slump has been the easing of geopolitical tensions, particularly surrounding the ongoing Ukraine conflict. Investors are increasingly optimistic about the prospects of diplomatic resolution, bolstered by the upcoming US-Russian summit scheduled for Friday. Many market participants believe that this high-level meeting could pave the way for de-escalation and possibly bring an end to the prolonged war, reducing the perceived need for safe-haven assets like gold.
Simultaneously, a surge in US Dollar buying has contributed to gold's decline. As the dollar strengthens, the relative attractiveness of gold diminishes since it is priced in dollars, making it more expensive for holders of other currencies. This dynamic has compounded the downward pressure on gold prices, further amplifying the current bearish momentum.
Market Positioning: Divergence Between Retail and Institutional Traders
A noteworthy aspect of the current market landscape is the divergence observed between different trader groups. Non-commercial traders, often institutional investors and hedge funds, have increased their long positions on gold. This suggests a continued belief in the metal’s potential as a safe haven or a strategic asset. Conversely, retail traders appear to be shifting towards short positions, possibly reacting to the recent price decline or attempting to capitalize on a short-term correction.
This divergence signals a potential imbalance in market sentiment and could hint at an upcoming volatility spike. Typically, such divergences between large institutional positions and retail sentiment can precede significant price movements, either a reversal or a deeper correction.
Technical Outlook and Upcoming Data Releases
Looking ahead, technical analysts are eyeing the possibility of a further spike down in gold prices before any potential rebound. The current trend suggests a bearish movement, but a volatile market environment could see a sharp correction or a "spike down" between today and the end of the week.
Adding to the market's uncertainty are upcoming macroeconomic data releases, notably the Core Consumer Price Index (CPI) month-over-month and the overall CPI figures. These indicators are critical as they influence expectations regarding Federal Reserve policies and can significantly impact dollar strength and precious metals’ prices. A surprise in these data points could either reinforce the bearish trend or trigger a reversal, especially if inflation figures diverge from consensus estimates.
Trading Strategy: Looking for a Long Setup
Despite the current bearish tone, there is a strategic opportunity for traders to position themselves for a potential rebound. Given the divergence and upcoming data releases, many are eyeing a long setup—buying opportunities that could capitalize on a short-term correction or a reversal once market fears subside.
Traders should monitor key support levels around current prices and watch for confirmation signals in price action and volume. A strong bounce or reversal pattern following the release of inflation data could present an ideal entry point for long positions, aligning with the broader view of a potential spike down followed by a recovery.
Conclusion
Gold remains a dynamic asset influenced by geopolitical developments, currency movements, and trader positioning. While the recent decline signals caution, the divergence in trader sentiment and upcoming economic data provide traders with a strategic landscape ripe for potential opportunities. As always, careful analysis and risk management are paramount in navigating these volatile markets.
✅ Please share your thoughts about GC1! in the comments section below and HIT LIKE if you appreciate my analysis. Don't forget to FOLLOW ME; you will help us a lot with this small contribution.

Support’s on Life Support. Paging Dr. TokyoMGC is currently trading at 3,393.8, positioned at the 0% retracement of the recent leg from 3,510.2 down to current lows. The prior swing high at 3,510.2 marks the 100% Fib, with the 50% retracement at 3,451.18 acting as the mid-range pivot. Price action has been in a sustained downtrend since rejecting the 50% retracement level, with EMAs aligned bearish on the H1.
The Point of Control (POC) for this distribution is located at 3,492.0, which coincides with the upper value area, untested since the selloff.
Bias Assessment:
- Bearish Bias: 60% Probability
- Bullish Bias: 40% Probability
- Volatility Expectation: Moderate in Asian session, potential acceleration on key level breaks due to lower liquidity.
Bearish Scenario – Primary Path:
- Breakdown confirmation requires an H1 close 3,393.4 (0% Fib).
- Immediate target: 3,365.0 (local structural demand)
- Extended target: 3,350.0 (measured move completion / previous support cluster)
- Risk trigger: Failure to break 3,393 followed by reclaim of 3,410 negates short bias.
Bullish Scenario – Alternate Path:
- Defense of 3,393.4 with absorption will reclaim 3,410.0 (minor LVN).
- Upside target 1: 3,451.18 (50% Fib, key mid-range)
- Upside target 2: 3,492.0 (POC, high-volume resistance)
- Continuation trigger: Break and hold - 3,492 opens 3,510.2 retest.
Key Tokyo Session Levels:
- Support: 3,393.4 → 3,365.0 → 3,350.0
- Resistance: 3,410.0 → 3,451.18 → 3,492.0 → 3,510.2
Tokyo session tends to front-load stop hunts in the first 15–30 minutes. Prefer confirmation based entries at key level breaks with tight stops in low-liquidity conditions. Position sizing should be reduced relative to NY/London volatility profile.
Happy Trading

Gold Futures: Short-Term Bounce Before Bigger Play?Gold Futures (MGC) has now reached the H4 + Daily FVG confluence zone we’ve been tracking over the past few days. Price action has been decisively bearish, breaking key intraday supports and targeting liquidity below the weekly low.
On the 1H & 4H, the ADX > 25 confirms strong short-term momentum, but the higher timeframes (8H+) still lack the directional conviction for the “big play.” This suggests the current move may be part of a broader setup still in development.
Here’s the scenario I’m watching:
Asian Session: Potential bullish retracement toward the POC in the volume profile as buyers step in from current FVG support.
London Session: Opportunity for shorts if price tags the supply zone around 3,430–3,447 and fails to reclaim higher levels.
NY Session: Possible reaction inside the remaining bullish FVGs, especially if USD news catalysts shake up momentum.
📊 Key Levels:
Support: 3,397 (W-L), 3,385–3,350 (lower FVG & HVN).
Resistance: 3,432–3,447 (supply), 3,466 (D-H).
Bias: Short-term bounce → London short setup → watch for NY session reaction.
Tomorrow’s USD-heavy news cycle could be the volatility driver that determines whether we get a deeper drop into the 3,350s or a reclaim back toward the mid-3,400s.
