MGC - WEEK 36 SEPT 2ndLooking for MON, TUE, WED to create high of the week at BS then pull back into the larger range.
CALANDER EVENT
TUES
-10AM - PMI (HIGH)
WED
-7AM - 30-YEAR MORTGAGE RATE (MED)
-9AM - FED SPEACH (MED)
-10AM - JOLT's JOB OPENING (HIGH)
THUR
-10AM - PMI (HIGH)
-12PM - OIL/GAS (MED)
FRIDAY
-8:30AM - NFP / UNEMPLOYMENT RATE
GF1! trade ideas

XAUUSD/GOLDGold looks cooked. Strong dollar, rising real yields, and fading fear — the perfect storm for XAU/USD downside. Price action is heavy, and the bulls are running out of reasons.

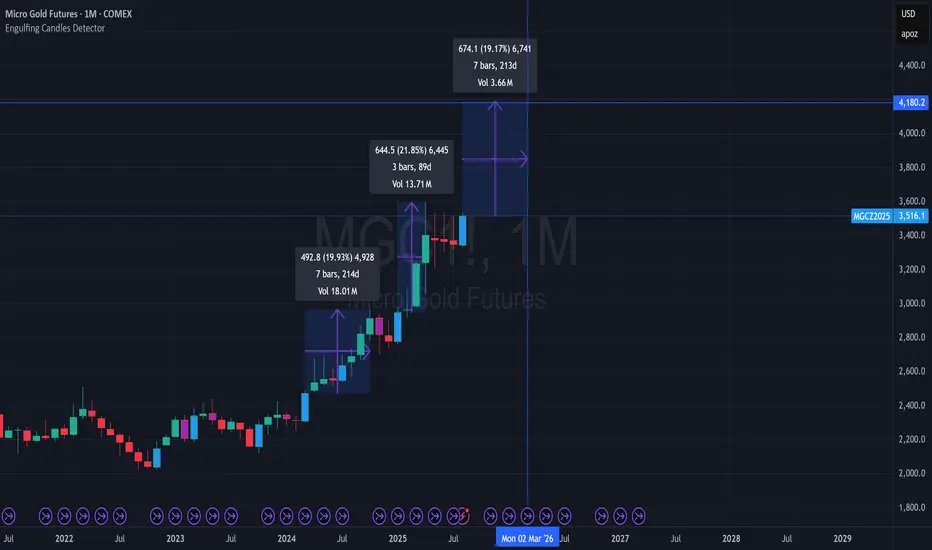
Gold Futures Targeting 4000 to 4200 in the next 3 - 7 months?Pretty bullish close on the monthly for Gold. If it is similar to other bullish monthly closes recently and the start of a fresh bullish phase possibly Gold targeting 4200 in the next 3 to 7 months could be a potential.
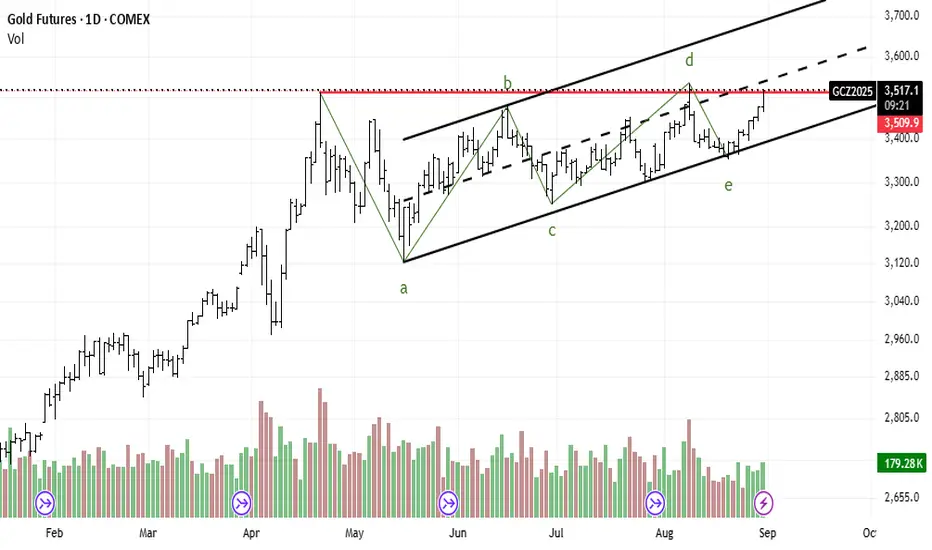
No CommentGold futures (GC) are currently exhibiting a classic consolidation pattern on the daily timeframe, specifically a contracting triangle. This formation, identified as a standard a-b-c-d-e Elliott Wave sequence, is functioning as a continuation pattern following the strong uptrend observed from Q1 to Q2 2025.
The accompanying decline in trading volume throughout the pattern's development reinforces the validity of this consolidation phase, suggesting that market energy is accumulating for a significant directional move.
Key Levels to Monitor:
Confirmation (Trigger): A decisive daily close above the key resistance zone of $3,525. This breakout should ideally be supported by a surge in volume.
Price Target: A successful breakout projects an initial, measured target in the $3,900 - $3,950 range.
Invalidation: The bullish thesis would be invalidated upon a breakdown below the pattern's lower trendline support, specifically a close below the wave 'e' low at approximately $3,400.
From a macroeconomic perspective, this technical setup is highly sensitive to upcoming economic data. A catalyst in the form of weaker-than-expected labor or inflation figures could accelerate the anticipated bullish breakout.
Gold Futures (GC1! | Daily Analysis)📊 Gold Futures (GC1! | Daily Analysis)
Gold is consolidating within a tight wedge structure, testing the equilibrium zone near $3,390.
🔑 Key Observations:
Premium Zone rejected near $3,520, aligning with recent swing highs.
Price is now retesting trendline support + equilibrium zone (~$3,320–3,390).
Volume profile shows distribution spikes suggesting strong participation but indecision.
A clean break below equilibrium could target discount zone near $3,160.
Holding above support may invite another test of premium liquidity above $3,500.
⚖️ Outlook:
Gold sits at a critical decision point.
Bullish case: Hold equilibrium → push back toward $3,520.
Bearish case: Break and close below $3,320 → liquidity sweep into $3,160.
🕵️♂️ Watch how price reacts at this wedge support; it will define the next leg.
#Gold #Futures #SMC #Trading #WaverVanir

Gold at Resistance ! Next move will decide trend.Daily Chart Update – Gold1!
Gold is currently forming a rising wedge pattern, with resistance near the sell zone of 103550–103700. The metal is also trading within a well-defined ascending parallel channel, where the channel resistance aligns with the first selling level around 10500.
On a percentage basis, after a 5–6% upward move, gold has reached the key levels of 104700–10500. If these resistance levels hold, we may witness a potential decline in prices. Accordingly, positions can be shifted, and selling opportunities may be considered in line with both the pattern formation and the overall market structure.
Conclusion: According to the pattern and overall structure, 103500 is the first selling zone, while further resistance lies at 104700–10500. Sustaining below these levels could open the way for lower prices.

Gold Bulls Eye Breakout, But Caution May Be RequiredI'm seeing a lot of bullish calls for a gold breakout this week, and the contrarian within me suspects this could lead to disappointment over the near term. Even though my core bias is for gold to reach new highs eventually. Today I look at market exposure to gold futures from the commitment of traders report alongside key levels on gold's futures chart.
Matt Simpson, Market Analyst at Forex.com and City Index.

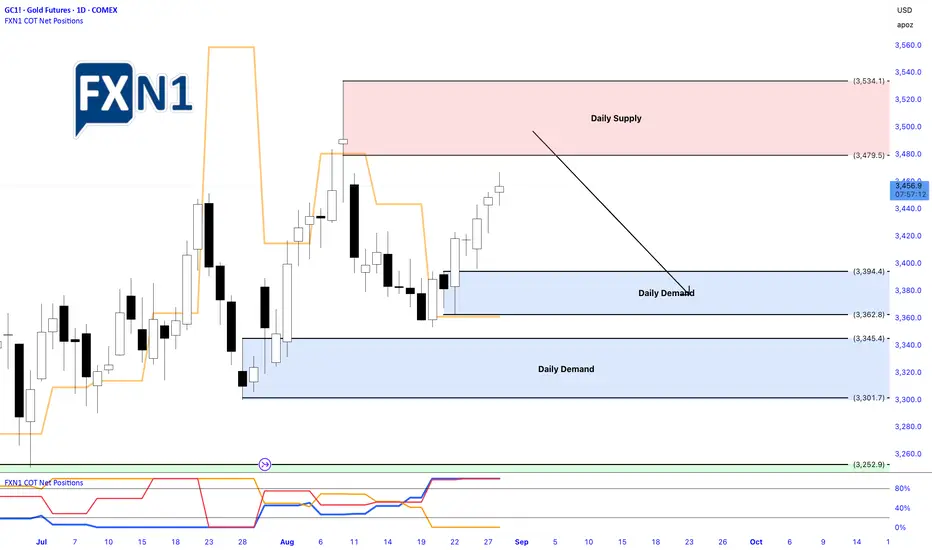
Gold Surge: Preparing for a Possible Pullback at Supply ZoneThroughout August, gold has steadily risen in value, experiencing only minor retracements along the way. Currently, the price is approaching a significant daily supply zone, situated at the top of the market. Recent data indicates that non-commercial traders have been increasing their short positions over the past few weeks, hinting at a potential capitulation or liquidation of positions soon. Meanwhile, retail investors continue to push longs, whereas commercial traders remain positioned more neutrally, gradually adding to their holdings. Moving forward, I will closely monitor the next supply zone, as it could present an ideal opportunity to initiate a short position, capitalizing on potential market exhaustion at this resistance level.
✅ Please share your thoughts about GC1! in the comments section below and HIT LIKE if you appreciate my analysis. Don't forget to FOLLOW ME; you will help us a lot with this small contribution.
Good Price action can continue on Gold As we get ready to close out the week price moved full on bullish yesterday and it looks like it can continue. Looking to see what Happens when price moves back insde of the small 1HR FVG they left behind. we are not reacting to anything before the killzone.

Dipping my toes with 1-Ounce Gold Futures CME in 2025 launched a new futures instrument called 1-Ounce gold.
Day trading margin requirement is $16.5 and overnight trading margin requirement is $165.
This has been a great way to start trading in live markets with low capital requirements.
1OZ price action closely mirrors GC gold futures so there is a lot of content and experts that share their ideas about where gold is going.
1OZ is equivalent to 1/100 of Gold Futures and tick sizes are 0.25 equivalent to $0.25.
Great for a beginner like myself to get a feel of the markets to test strategies and also experience the emotions of being in a position; being up and being down. These emotions cannot be simulated when backtesting or paper trading.
While experiencing these emotions, I have been journaling how the trades make me feel and behave. I have learnt more about myself that day-to-day life experiences do not subject me with.
I started my journey mid-2025 and so far I have had more losing trades than wins. However, 0.25 tick only represent 25c I treat it as the paying the market a low-fee for my education.
Who knows if I will be resilient enough to continue this journey in the months or years to come? We all have to start somewhere/sometime. Hope I have the discipline to stay the course and not give up.
Is anyone out there a beginner like myself trading 1OZ? Please comment and tell me how 1OZ has been treating you?

Gold Futures | ADX Heating Up – Continuation or Trap at MH?Price has pushed away from the untested H4 FVG, showing strong bullish pressure. With ADX > 25 on the 15m and close to crossing on 1H/4H, momentum is shifting into trend mode.
My watch:
Break + retest of yesterday’s high and MH level for continuation longs.
Only looking for shorts if liquidity sweeps above MH and we see strong rejection.
Question is: do we run higher with ADX confirmation, or is this just a trap before a deeper pullback?

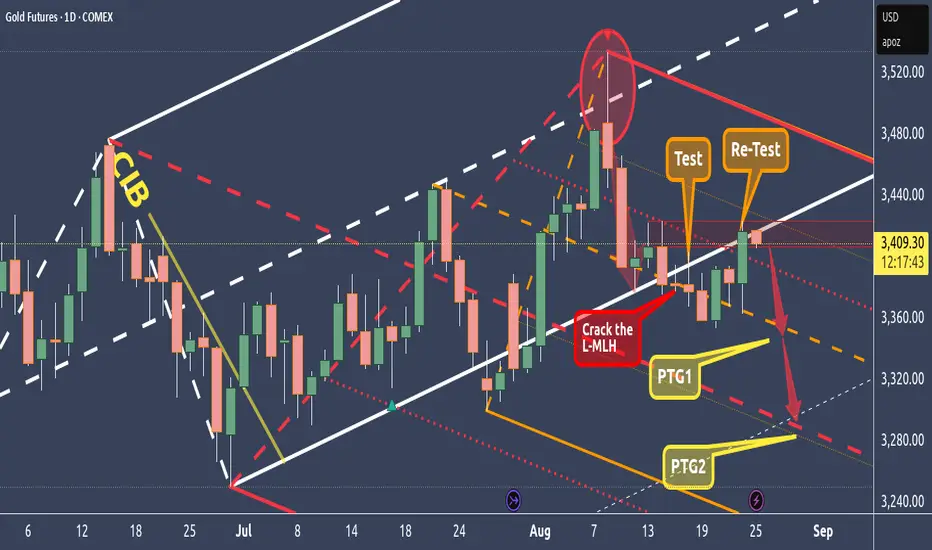
GC - Gold Re-Testing The L-MLH - Short AheadFirst we crack the L-MLH.
Then we got a test and now the re-test.
On a close outside the fork it's a present to short wit stops above somewhere the wicks high.
Profit at the orange Centerline (PTG1) and at the Red Centerline. All in all a wonderful trade with a decent risk/reward.
And if the train leaves without us, NO FOMO please §8-)
Gold looks interesting again.Gold has successfully worked off its prior overbought condition through a period of sideways consolidation rather than a corrective drawdown. This resilience—marked by the metal’s unwillingness to print lower lows—points to a constructive setup.
Technical Setup
Support: The 50-day EMA has held as a key support level, reinforcing the bullish bias.
Breakout Potential: Should price resolve higher out of the current range, the move could prove sharp and decisive given the stored energy of consolidation.
Breadth Confirmation: While gold has moved sideways, GDX (miners) has already pushed to fresh highs, and silver is breaking out, signaling strong cross-complex participation.
Thematic Takeaway
The broad alignment across gold, silver, and miners suggests a healthy underlying bid for the precious metals complex. This type of breadth historically strengthens the case for sustained upside momentum rather than an isolated rally.

GC Midweek Outlook – Daily Imbalance Tested, H4 FVG Still in PlaPrice has now completed the move into the Daily FVG (~3425–3443) that I highlighted earlier this week. This is the critical mid-week decision point.
Bearish Case: If price rejects here, downside rotation into the untouched H4 FVG (3377–3396) remains possible before any larger move higher.
Bullish Case: If buyers defend the H1 imbalance and hold above 3412, continuation toward the Monthly High (3451) is on the table.
ADX remains under 25, suggesting no strong trending conditions yet — market is still liquidity-driven.
I’ll be watching the Daily FVG reaction and how price handles the H1 imbalance as key intraday signals.

How to Trade Morning Star and Evening Star Candlestick Patterns Learn to identify and trade Morning Star and Evening Star candlestick formations using TradingView’s charting tools in this detailed tutorial from Optimus Futures.
Morning and Evening Stars are powerful reversal patterns that often mark turning points in the market. Recognizing them can help you anticipate when momentum is about to shift—and take advantage of new trading opportunities.
What You’ll Learn:
• How Morning Stars signal bullish reversals at the end of a downtrend
• How Evening Stars indicate bearish reversals after extended uptrends
• The three-candle structure of each pattern and what it means for trader psychology
• Why indecision candles (like dojis) play a critical role in confirming momentum shifts
• Using volume confirmation to validate Morning and Evening Star setups
• The importance of context: spotting these patterns at major support and resistance levels
• Setting effective stop losses at the high/low of the pattern for risk control
• Advanced entry tactic: waiting for retracement after confirmation to optimize risk/reward
This tutorial may help futures traders and technical analysts who want to harness candlestick reversal signals to identify potential market turning points.
The strategies covered could assist you in creating structured setups when strong buying or selling pressure appears at key chart levels.
Learn more about futures trading with TradingView:
optimusfutures.com
Disclaimer:
There is a substantial risk of loss in futures trading. Past performance is not indicative of future results. Please trade only with risk capital. We are not responsible for any third-party links, comments, or content shared on TradingView. Any opinions, links, or messages posted by users on TradingView do not represent our views or recommendations. Please exercise your own judgment and due diligence when engaging with any external content or user commentary.
This video represents the opinion of Optimus Futures and is intended for educational purposes only. Chart interpretations are presented solely to illustrate objective technical concepts and should not be viewed as predictive of future market behavior. In our opinion, charts are analytical tools—not forecasting instruments. Market conditions are constantly evolving, and all trading decisions should be made independently, with careful consideration of individual risk tolerance and financial objective

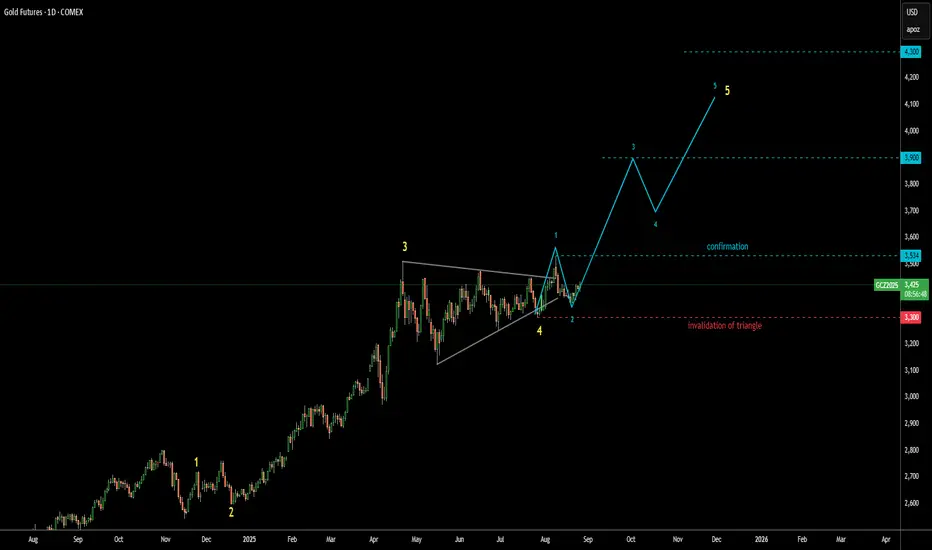
Gold Update 26AUG2025: Bullish Confirmation Above $3,534 The gold futures price has made a U-turn as it didn't trigger Triangle's invalidation at $3,300
This bounce back could be a harbinger of wave 3 within the larger degree wave 5
It will be confirmed once upmove breaks above the top of wave 1 beyond $3,534
I erased the complex correction scenario as the price might be taking off right now
I added the breakdown of the upcoming large wave 5 into smaller 5 waves inside
Target range remains intact between $3,900 and $4,300
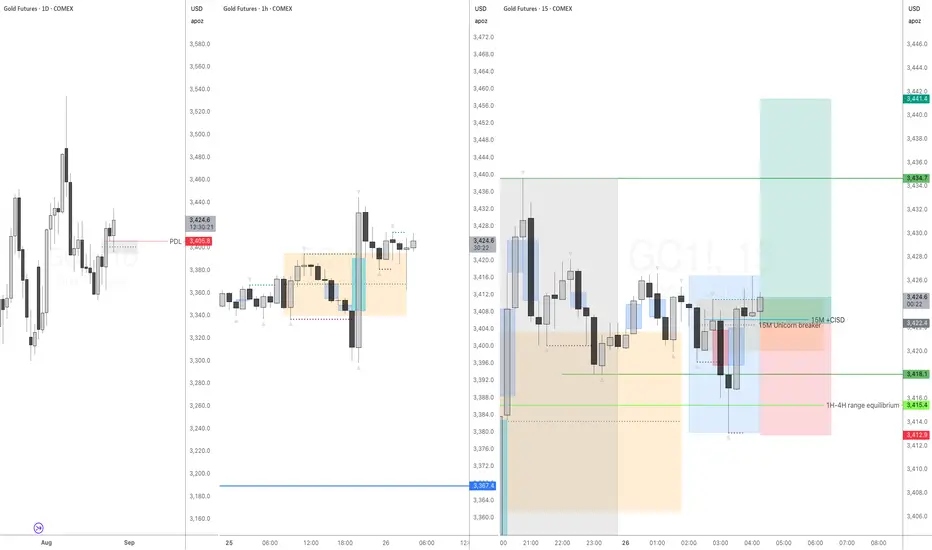
Buying GC based on multiple confluence elementsGC formed Daily +Unicorn breaker. Overnight GC sweapt PDL, formed 1H +unicorn breaker. It returned to the breaker zone and 1H range discount (below equilibrium and formed 15M + Unicorn breaker during London open.
I've never seen more confluence elements in one place. Going for 1:2 RR
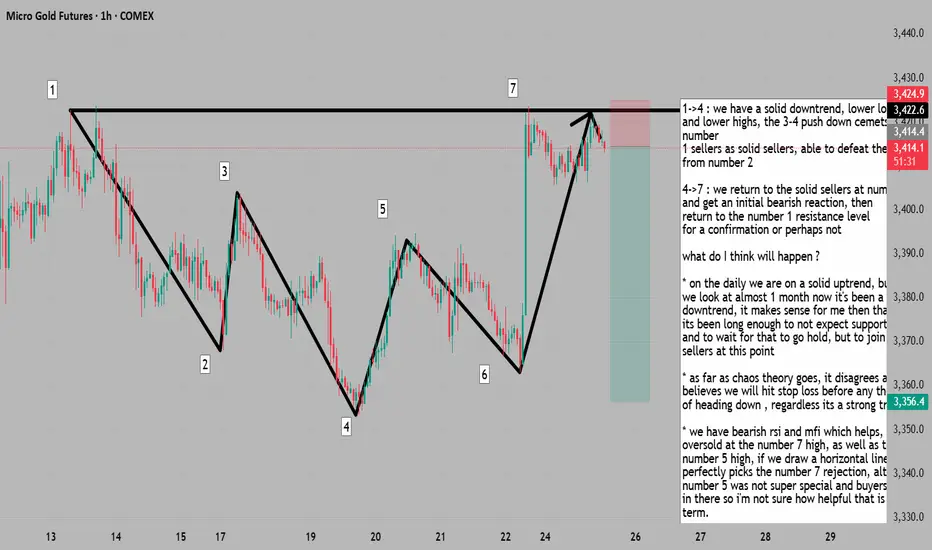
retracement to solid sellers with pullback =SELL it up1->4 : we have a solid downtrend, lower lows
and lower highs, the 3-4 push down cemets number
1 sellers as solid sellers, able to defeat the buyers
from number 2
4->7 : we return to the solid sellers at number 1
and get an initial bearish reaction, then
return to the number 1 resistance level
for a confirmation or perhaps not
what do I think will happen ?
* on the daily we are on a solid uptrend, but if
we look at almost 1 month now it's been a solid
downtrend, it makes sense for me then that maybe
its been long enough to not expect support to hold
and to wait for that to go hold, but to join the sellers at this point
* as far as chaos theory goes, it disagrees and believes we will hit stop loss before any thought
of heading down , regardless its a strong trade
* we have bearish rsi and mfi which helps, they are oversold at the number 7 high, as well as the number 5 high, if we draw a horizontal line, perfectly picks the number 7 rejection, although number 5 was not super special and buyers came in there so i'm not sure how helpful that is long term.
* as far as elliot wave goes we could have completed the fifth wave and are looking for a 3 wave retracement which helps us as we are aiming for the low at number 4
GC 8/26 Outlook – Filling the H4 FVG, Trend Not Ready YetPrice is finally working down into the H4 FVG (3377–3396 zone) after rejecting the Daily FVG overhead (~3425–3440). This is the key area of interest going into Tuesday’s trading sessions.
🔑 Context:
Daily FVG above → unfilled liquidity magnet for the future.
H4 FVG below → currently being filled, acting as the main battleground.
Daily Low (3405) already taken; price now sitting between liquidity pools.
ADX < 25 (HTFs) → No strong trending environment yet, so expect more range-like behavior until a side commits.
📌 What I’m Watching:
Reaction inside the H4 FVG → Looking for either absorption/reversal (bullish case) or continuation through to lower liquidity.
Liquidity Levels:
Midpoint of H4 FVG (~3394).
Bottom of H4 FVG (~3377).
Weekly/Monthly Lows (3353 / 3347) if downside momentum extends.
Killzones:
Asian: Likely to set the range.
London: Could raid deeper into FVG.
NY: Potential reaction leg (either reversal or continuation).
📊 Bias: Neutral → short-term bearish into H4 FVG completion. Waiting for a clear reaction to confirm the next trending move.

xauusd trade ideatook a buy after breaking out the consolidation during the London session and full tp was successfully hit.

Gold Analysis Learning Video 25th AugMarket Given Support At 99000, Expecting to be in sideways and rally on upside if it hold yesterday last momentum zone, I mean at last 2hrs market

Gold Weekly Plan: Daily FVG → H4 FVGGold closed last week with a strong impulsive move into a Daily Fair Value Gap (FVG). As we open the new week, I’ll be watching closely:
Daily FVG (3423–3451): Potential resistance and rejection zone early in the week.
H4 Bullish FVG (3390–3395): If price rejects the Daily FVG, I expect a retrace into this zone to set the weekly low between Monday and Tuesday.
From there, we could see a bullish expansion for the rest of the week.
The key question: Will Gold respect the Daily FVG as resistance before rebalancing lower, or will buyers push straight through?
What’s your bias going into the week? 🚀📉

MGC - WEEK 35 AUG 24TH Looking to see gold run up to take highs this week as dollar drop to take out its own lows. Based on new we should see the most action towards the end of the week.
