Tia bounce back to $1.550Just recently opened a long position on tia
Sl: 1.453
Aiming for $1.550
2 RR trade

Long Tia/usdtThe long correction on LSE:TIA might finally be over.
The price just completed a classic corrective pattern and tagged a major 4H support zone.
As long as this demand area holds, the outlook is bullish. Watching this one very closely for a long entry.
LSE:TIA #TradingSetup #nfa

Celestia (TIA): Looking For Break of 100 EMA | BULLISH PLAYTIA is once again pressing against the 100EMA, a level that has been rejecting the price multiple times in the past.
If buyers manage to secure above, it could finally unlock the path toward the upside targets.
The game plan is clear: stay patient until we get that clean confirmation (which can hap

TIA Swing Long OpportunityTIA Swing Long Opportunity
📊 Market Sentiment
Market sentiment is bullish, fueled by the FED restarting rate cuts. We’ve seen a 0.25 BPS cut in September, with expectations for two more consecutive 0.25 cuts in the coming months. In addition, institutional liquidity flow into crypto has increase

TIAUSDT 12H#TIA has formed a symmetrical triangle on the 12H timeframe. Consider buying here at the current price and near the support level of:
🛡 $1.700 (which is approximately aligned with the 12H SMA100)
In case of a breakout above the triangle resistance, the potential targets are:
🎯 $2.077
🎯 $2.314
🎯 $2.

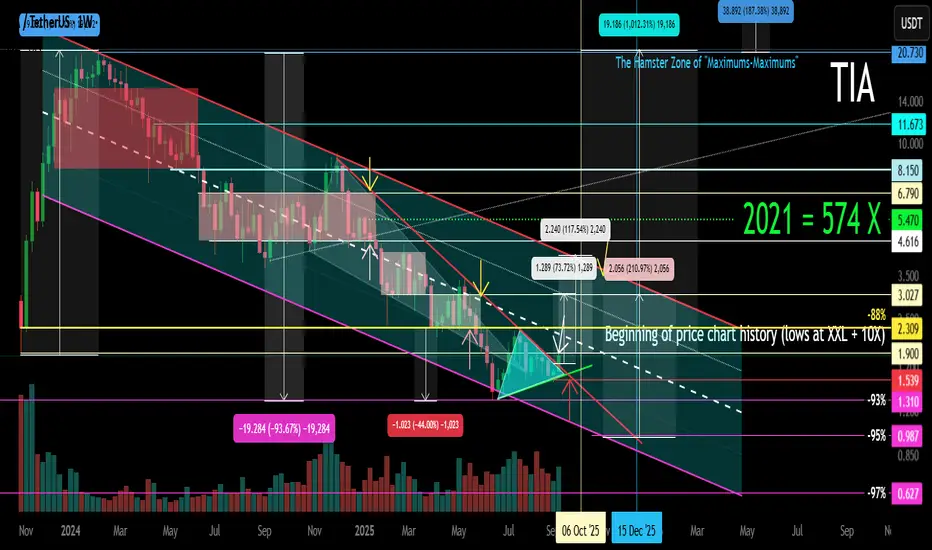
TIA (Celestia) XXL Main Trend Channel. Now +10X 13 09 25The price entered the 10X profit zone of crypto funds on 09 2025.
🟣 Locally , a symmetrical triangle formed under the downward trend.
🟢 Breakthrough — a trend break and movement to the resistance of the downward channel.
🔴Not a breakthrough — further immersion, after all, now the price is

TIA momentum crazy good!!!Just several pips to go. And surely it will be in this market situation and TIA will go super quick to 3usd minimum super easy and super quick!

TIAUSDT UPDATE#TIA
UPDATE
TIA Technical Setup
Pattern : Bullish Falling Wedge Breakout
Current Price: $1.83
Target Price: $2.45
Target % Gain: 35.38%
Technical Analysis: TIA has broken out of a bullish falling wedge on the 4H chart, with strong momentum after reclaiming trendline resistance. The breakout is s


See all ideas
Summarizing what the indicators are suggesting.
Oscillators
Neutral
SellBuy
Strong sellStrong buy
Strong sellSellNeutralBuyStrong buy
Oscillators
Neutral
SellBuy
Strong sellStrong buy
Strong sellSellNeutralBuyStrong buy
Summary
Neutral
SellBuy
Strong sellStrong buy
Strong sellSellNeutralBuyStrong buy
Summary
Neutral
SellBuy
Strong sellStrong buy
Strong sellSellNeutralBuyStrong buy
Summary
Neutral
SellBuy
Strong sellStrong buy
Strong sellSellNeutralBuyStrong buy
Moving Averages
Neutral
SellBuy
Strong sellStrong buy
Strong sellSellNeutralBuyStrong buy
Moving Averages
Neutral
SellBuy
Strong sellStrong buy
Strong sellSellNeutralBuyStrong buy
Displays a symbol's price movements over previous years to identify recurring trends.