Tia bounce back to $1.550Just recently opened a long position on tia
Sl: 1.453
Aiming for $1.550
2 RR trade
TIAUSDT.P trade ideas

Long Tia/usdtThe long correction on LSE:TIA might finally be over.
The price just completed a classic corrective pattern and tagged a major 4H support zone.
As long as this demand area holds, the outlook is bullish. Watching this one very closely for a long entry.
LSE:TIA #TradingSetup #nfa

Celestia (TIA): Looking For Break of 100 EMA | BULLISH PLAYTIA is once again pressing against the 100EMA, a level that has been rejecting the price multiple times in the past.
If buyers manage to secure above, it could finally unlock the path toward the upside targets.
The game plan is clear: stay patient until we get that clean confirmation (which can happen as we are in very bullish momentum), then look for moves into $2.6, $3.4, and possibly $5+.
Swallow Academy

TIA Swing Long OpportunityTIA Swing Long Opportunity
📊 Market Sentiment
Market sentiment is bullish, fueled by the FED restarting rate cuts. We’ve seen a 0.25 BPS cut in September, with expectations for two more consecutive 0.25 cuts in the coming months. In addition, institutional liquidity flow into crypto has increased as the US officially adopted crypto as part of its international reserves. While inflation remains elevated, a weakening labor market is forcing the FED to ease policy, pushing liquid capital into risk-on markets.
📈 Technical Analysis
Price created a Daily Demand Zone at $1.70 and bounced, confirming its validity.
Price also broke the bearish trendline and closed multiple candles above, signaling further upside potential toward higher liquidity targets.
📌 Game Plan
I already entered the position after rejection at $1.70 and will manage it as a swing setup, targeting highs around $3 — a potential 70% expansion.
🎯 Setup Trigger
Validation came from the rejection at $1.70.
📋 Trade Management
Stoploss: Daily close below $1.30
Target: $3 (Potential 70% expansion)
💬 Like, follow, and comment if you find this setup valuable!
⚠️ Disclaimer: This content is for informational and educational purposes only and does not constitute financial, investment, or trading advice. Always DYOR before making any financial decisions.

TIAUSDT 12H#TIA has formed a symmetrical triangle on the 12H timeframe. Consider buying here at the current price and near the support level of:
🛡 $1.700 (which is approximately aligned with the 12H SMA100)
In case of a breakout above the triangle resistance, the potential targets are:
🎯 $2.077
🎯 $2.314
🎯 $2.550
🎯 $2.888
🎯 $3.317
⚠️ Always remember to use a tight stop-loss and follow proper risk management.

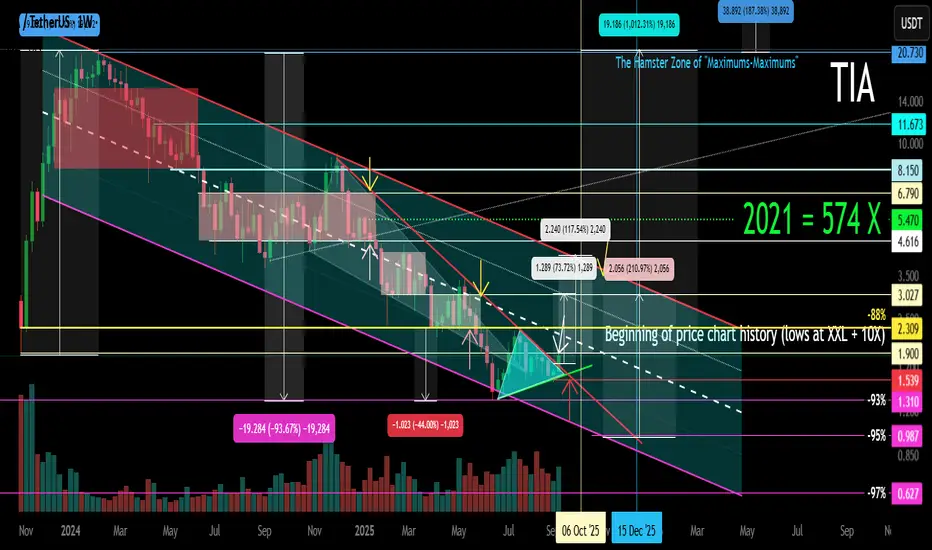
TIA (Celestia) XXL Main Trend Channel. Now +10X 13 09 25The price entered the 10X profit zone of crypto funds on 09 2025.
🟣 Locally , a symmetrical triangle formed under the downward trend.
🟢 Breakthrough — a trend break and movement to the resistance of the downward channel.
🔴Not a breakthrough — further immersion, after all, now the price is in the 10X zone , but already at least not 574 X ) When working with such hype, remember what a crazy profit the asset is at the "bottoms".
On the one hand, the asset will move with the market as a whole , and not by itself. In order to continue selling the hyped crypto wrapper, large market participants (swindlers and exchanges) will have to create hype again and redirect the traffic of "inexperienced" market participants. That is, make "dump waves ". You can use this, but with due regard to money management, and do not climb into margin and futures on such assets (inadequate profit on the other side). Work with local, down-to-earth goals (channel logic, in case of its breakthrough - the bowl), and not with maximum hypothetical ones.

TIA momentum crazy good!!!Just several pips to go. And surely it will be in this market situation and TIA will go super quick to 3usd minimum super easy and super quick!

TIAUSDT UPDATE#TIA
UPDATE
TIA Technical Setup
Pattern : Bullish Falling Wedge Breakout
Current Price: $1.83
Target Price: $2.45
Target % Gain: 35.38%
Technical Analysis: TIA has broken out of a bullish falling wedge on the 4H chart, with strong momentum after reclaiming trendline resistance. The breakout is supported by higher lows and volume expansion, indicating potential continuation toward $2.45.
Time Frame: 4H
Risk Management Tip: Always use proper risk management.


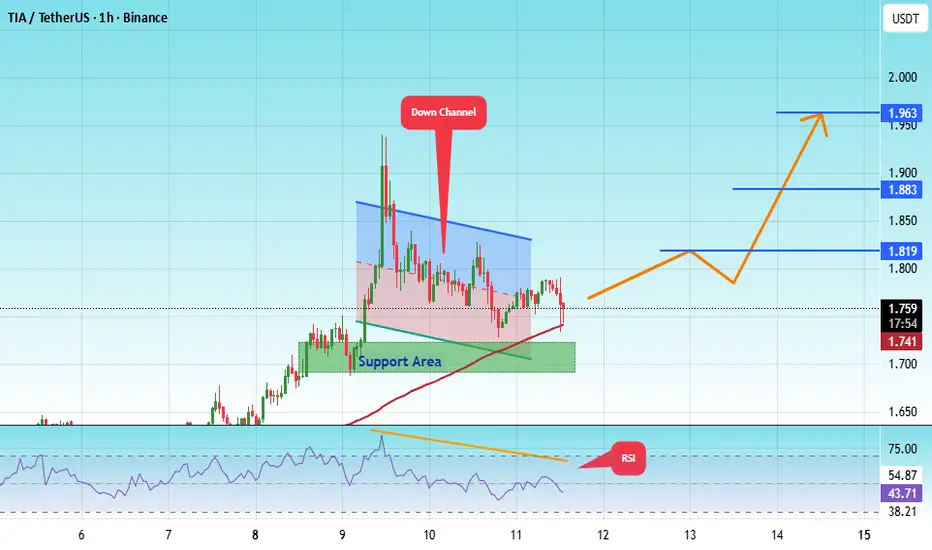
#TIA/USDT — a Major Decision Point at the Downtrend Line!#TIA
The price is moving within a descending channel on the 1-hour frame, adhering well to it, and is heading for a strong breakout and retest.
We have a bearish trend on the RSI indicator that is about to be broken and retested, which supports the upward breakout.
There is a major support area in green at 1.70, representing a strong support point.
For inquiries, please leave a comment.
We are in a consolidation trend above the 100 Moving Average.
Entry price: 1.75
First target: 1.82
Second target: 1.88
Third target: 1.96
Don't forget a simple matter: capital management.
When you reach the first target, save some money and then change your stop-loss order to an entry order.
For inquiries, please leave a comment.
Thank you.
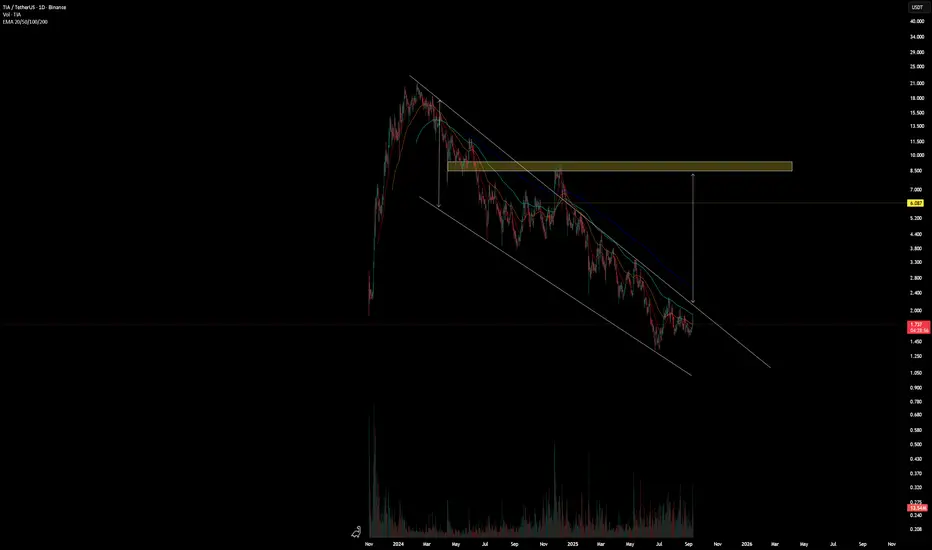
TIA Consolidation Ends? Bulls Eye 2.2 First, Then 4.0In my previous analysis, I mentioned that I am bullish on BINANCE:TIAUSDT , expecting the coin to recover at least part of the ground lost since the start of 2024.
So far, we haven’t seen real acceleration to the upside, but the price action is encouraging:
• Dips have been well defended around the 1.5 zone.
• The recent low stands above the July low, suggesting buyers are stepping in earlier.
• Two days ago, price finally managed to break above the falling trendline, a technical step in the right direction.
Putting these elements together, I maintain my bullish outlook. The first soft target for this move is 2.2.
But the real inflection point comes there: if TIA manages to stabilize above 2.2, a level that acted as support in early 2025 and resistance in late July, then the door opens for a much stronger rally. In that case, a reasonable target would be 4.0, with momentum likely to pick up sharply.

Simple Re-Test (Alt-Season)Forecasting a mild alt-season this cycle.
More regulation, absence of schemes (FTX) and the broad sweeping naivete about crypto this time around, alt-season performance will go through a necessary dampening.
No new highs for LSE:TIA this cycle. This project will be lucky to see a revisit to the level above, where I expect significant resistance.
Perhaps price will merely wick this area and commence another -80%+ drawdown.
TIA Descending Channel BreakouT
Celestia is breaking the upper channel resistance at $6.20 with increasing volume momentum👀
Channel break + volume confirmation = rally preparation complete🐃
Price targets: $2.20 → $2.70 → $3.38 → $4.20🎯
This is the breakout that catches everyone sleeping😴

TIA - Bullish wave awaited! LSE:TIA - bullish breakout awaited💣
Trend remain hihly oversell on the monthly basis
I expect to see a bull run toward 2.20 - 2.300$ key resistance next! 📈
Key support to be maintained: 1.675$

TIA ANALYSIS🚀#TIA Analysis : What Next ??💲💲
✅As we can see that there was a formation of Descending Triangle Pattern in #TIA and given a breakout. We are expecting around more than 30% bullish move in coming weeks 📈📈
🔰Current Price: $1.815
🎯 Target Price: $2.081
⚡️What to do ?
👀Keep an eye on #TIA price action. We can trade according to the chart and make some profits. Stay tuned for further analysis and stay updated with market sentiments and news.⚡️⚡️
#TIA #Cryptocurrency #TechnicalAnalysis #DYOR

TIACELESTIA-TIA
Looks like it is about time to show the power of long time awaited, TIA, it must go at least 40-70% from this point LONG
NFA
dyor

TIA Chart Signals a Massive 100% Move — Altseason is Here !Hello Traders 🐺
As you might already feel it, Altcoin season is about to begin — and one of my favorite picks for this cycle is TIA.
Looking at the chart, we can clearly see a descending channel with price respecting its boundaries over time. Right now, TIA is getting very close to breaking above the orange resistance line — and if that happens, we could see a massive rally of nearly 100%, pushing price all the way up to the upper resistance of the channel around $3.82.
📈 This is definitely a setup worth watching closely.
Make sure to act accordingly!
🐺 KIU_COIN 🐺

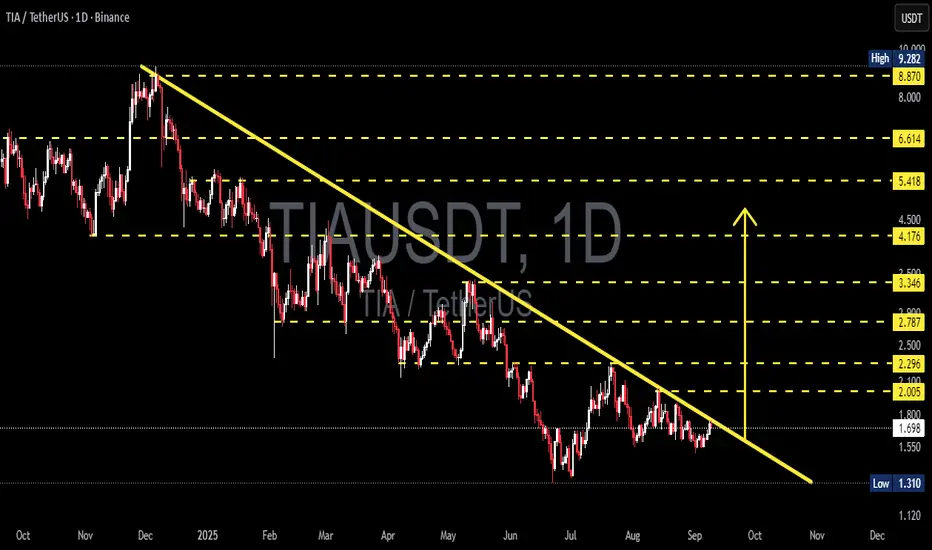
TIA/USDT — a Major Decision Point at the Downtrend Line!🔎 Overview
The daily chart (1D) of TIA/USDT shows that price action remains within a clear medium- to long-term downtrend. This is reflected by a series of lower highs & lower lows, all connected by the dominant descending yellow trendline.
Right now, the price is sitting at a critical crossroads — testing the trendline after months of trading below it. This is the moment that will determine whether TIA is ready to begin a bullish reversal or continue its extended bearish cycle.
---
🟢 Bullish Scenario
If TIA manages to break and close above the descending trendline with strong daily volume, the probability of a trend reversal increases significantly.
Step-by-step upside targets (based on chart levels):
2.005 USDT → first psychological resistance.
2.296 USDT → key supply zone, strong seller area.
2.787 USDT → next breakout confirmation zone.
3.346 USDT → mid-term bullish validation.
Breaking above 3.346 could open the path toward 4.176, 5.418, and higher.
Important note: a breakout without volume confirmation is often a false breakout.
---
🔴 Bearish Scenario
On the other hand, if the price fails to break the trendline and faces rejection, sellers will likely regain control.
Downside possibilities:
Price revisits 1.55 – 1.60 USDT zone.
Stronger sell pressure could drag it down to 1.310 USDT (critical support).
A breakdown below 1.310 USDT with heavy volume may trigger a capitulation wave, sending price into deeper lows.
In short: as long as price remains under the descending trendline, the overall trend stays bearish.
---
📐 Pattern & Structure
Main trend → Continuous downtrend since peak around 9.282 USDT.
Pattern → Descending trendline resistance that has rejected every rally attempt.
Critical support zone → 1.310 USDT (structural base).
Potential accumulation area → 1.3 – 1.7 USDT, seen from repeated bounces.
This structure resembles a descending channel with base-building. A breakout would shift momentum from bearish to neutral-bullish.
---
🎯 Conclusion
Bullish case → Trendline breakout + volume → upside targets at 2.0 → 2.3 → 2.7.
Bearish case → Rejection at trendline → downside toward 1.55 → 1.31.
Key focus: market’s reaction at the yellow trendline will dictate the next major move.
We are at a decision point: either TIA breaks out to start a recovery phase, or sellers take control again for another leg down.
---
#TIA #TIAUSDT #CryptoAnalysis #Altcoin #Breakout #Bearish #Bullish #ChartAnalysis #PriceAction #SwingTrade #TechnicalAnalysis #RiskManagement
$Tia Spot position Like this idea from LSE:TIA , I’ve opened a spot position at 1.64 right where the POC is. Looking for some targets shown there.
DYOR

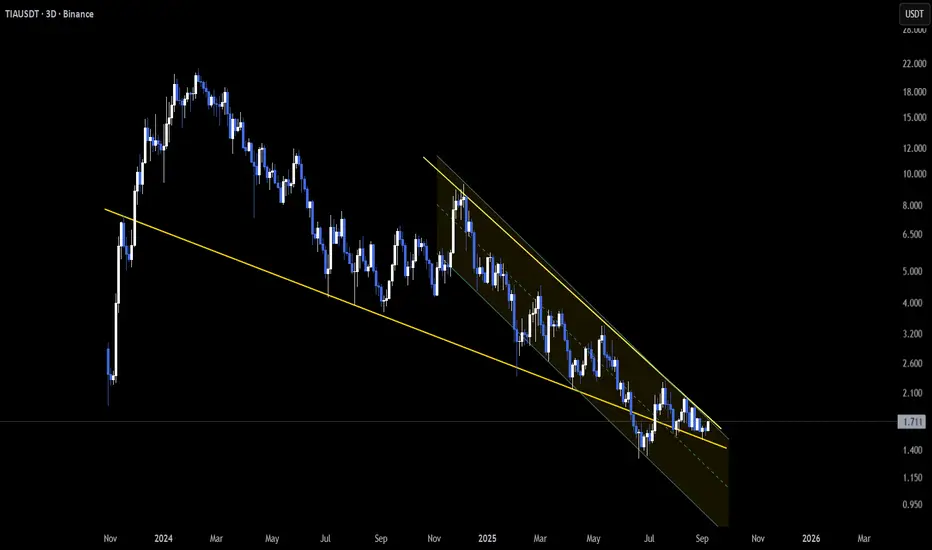
TIA – Falling Wedge Compression Near Apex📆 On the 3D timeframe, LSE:TIA is consolidating inside a falling wedge, with price action now pressing closer to the apex 📐.
This type of structure usually signals exhaustion of selling pressure. From my trading experience, wedges often resolve with strong directional moves once price tightens — either a breakout to the upside or one more dip into support before momentum shifts.
👀 Structure is reaching decision point — breakout or another retest?
Not financial advice.
BINANCE:TIAUSDT BINANCE:TIAUSDT.P
bullish tia We are seeing a lot of price pressure and increased volume compared to a few weeks ago. Volume is up, good news for this chart... I think (tia.usdt) will move higher.

TIA/USDT – 4‑hour technicalPrice is moving inside a descending channel defined by two downward‑sloping trendlines, sellers still have the upper hand.
the descending channel suggests the market is respecting lower highs and lower lows — a classic bearish structure.
Price is currently closer to the lower half of the channel, meaning a short‑term bounce toward 1.743 is possible if buyers defend 1.548.
A break below 1.501 would be a strong bearish signal, potentially opening the way toward new lows.
Conversely, a breakout above 1.743 could trigger a test of 1.909 and possibly the channel’s upper boundary.
