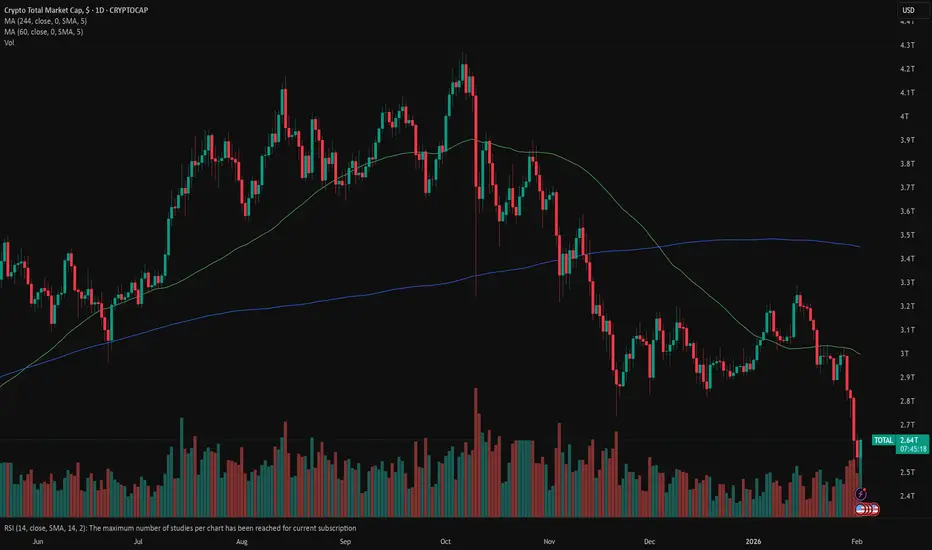
Total crypto market capitalization analysis and BTC🤝 Congrats to everyone who survived another deep and painful crypto drawdown.
👉 CRYPTOCAP:BTC ’s decline was stopped only around the $60,000 level — that’s where real demand showed up.
👉 At the same time, the Fear & Greed Index dropped to 9, a zone we’ve been pointing to for weeks (or even m
Crypto Total Market Cap, $
No trades
Key data points
Previous close
—
Open
—
Day's range
—
About Crypto Total Market Cap, $
A prepared trader is defined by their ability to see a bigger picture of a market. It applies to crypto traders too — if you agree, we've prepared a chart that will let you see the whole crypto market from a bird's-eye view. It shows total crypto market cap, which is calculated by TradingView by adding up top 125 coins market caps, which, in their turn, are the number of coins times their current price. A growing market cap can indicate investors' interest and their positive evaluation of the current market state. For you it might be a good indicator of where the wind blows and whether digital coins are a good investment tool.

February Alts Market RequestFebruary Altcoin Analysis Request – Limited Slots ⚠️
February will be treated with a potential bear market mindset. Expect selective, risk-aware analysis only, focused on structure, downside protection, and realistic scenarios, not hype.
🔹 Only 20 altcoins will be analyzed for February
🔹 First com

MARKETS week ahead: February 9 – 15Last week in the news
Although US NFP and Unemployment data were postponed, still JOLTs are showing ongoing weakness in the US jobs market. The risk-off mode still holds among investors, in which sense a short move to the upside of assets, should be taken with precaution. The S&P 500 significantly

TOTAL [Crypto Total Market Cap] EWP FIB TC ANALYSIS WEEKLY TFCrypto Total Market Cap (Weekly) – Structural Pullback Within a Primary Uptrend
The weekly structure of the total crypto market cap continues to support a larger bullish framework, even though price is currently undergoing a corrective phase.
After completing a strong impulsive advance that pushe

TOTAL - CrossroadsTOTAL
Has had a little pop at the HTF 1:0.618 Golden Window.
To remind, if a pivot were to form here, then 1:0.618 is a weak ratio due to the shorter third wave signalling exhaustion, so that could signal upside strength.
That might come across as strange wording since it looks like a bear market

MARKETS week ahead: February 2 – 8Last week in the news
Quite an interesting week is behind us. The Fed did not make any changes in the level of interest rates, as expected, while the US President nominated Kevin Warsh as the next Fed Chair. The US Dollar continued to lose in value, however, the most interesting development was wit
Cryptomarket cap at support levelCrypto touching supprot in the log chart, an uptrend from May 2017.

$TOTAL Crypto Market Cap Complete Meltdown Well Alright Ya’ll..
Here she blows 🤯
Longs about to be obliterated ☠️
If the Crypto CRYPTOCAP:TOTAL Market Cap gets a few Daily Closes below $2.8T then $75k CRYPTOCAP:BTC is not too far away.
Sure we shoulda all sold more, but here we are...
Should be a good buying opportunity to sell into

Transparency: The Foundation of Trust at GreenBayChartIn the investment world, trust is not just a nice bonus — it is the very foundation of long-term partnership. Clients entrust us with their life savings, often everything accumulated over decades of hard work. At GreenBayChart, we firmly believe that genuine trust arises not from flashy promises of

Analysis (TOTALCAP): Correction Completeted, Target $2.6T.🎯 Key Thesis:
Following strong absorption of selling volume on February 6, the total crypto market capitalization shows signs that the correction phase has ended. Continued growth toward the $2.6 trillion target zone is expected, after which large-scale profit taking and consolidation are likely.
📊

See all ideas
Summarizing what the indicators are suggesting.
Oscillators
Neutral
SellBuy
Strong sellStrong buy
Strong sellSellNeutralBuyStrong buy
Oscillators
Neutral
SellBuy
Strong sellStrong buy
Strong sellSellNeutralBuyStrong buy
Summary
Neutral
SellBuy
Strong sellStrong buy
Strong sellSellNeutralBuyStrong buy
Summary
Neutral
SellBuy
Strong sellStrong buy
Strong sellSellNeutralBuyStrong buy
Summary
Neutral
SellBuy
Strong sellStrong buy
Strong sellSellNeutralBuyStrong buy
Moving Averages
Neutral
SellBuy
Strong sellStrong buy
Strong sellSellNeutralBuyStrong buy
Moving Averages
Neutral
SellBuy
Strong sellStrong buy
Strong sellSellNeutralBuyStrong buy
Displays a symbol's value movements over previous years to identify recurring trends.