Intel - This behavior is wonderful!🎉Intel ( NASDAQ:INTC ) respects all structure:
🔎Analysis summary:
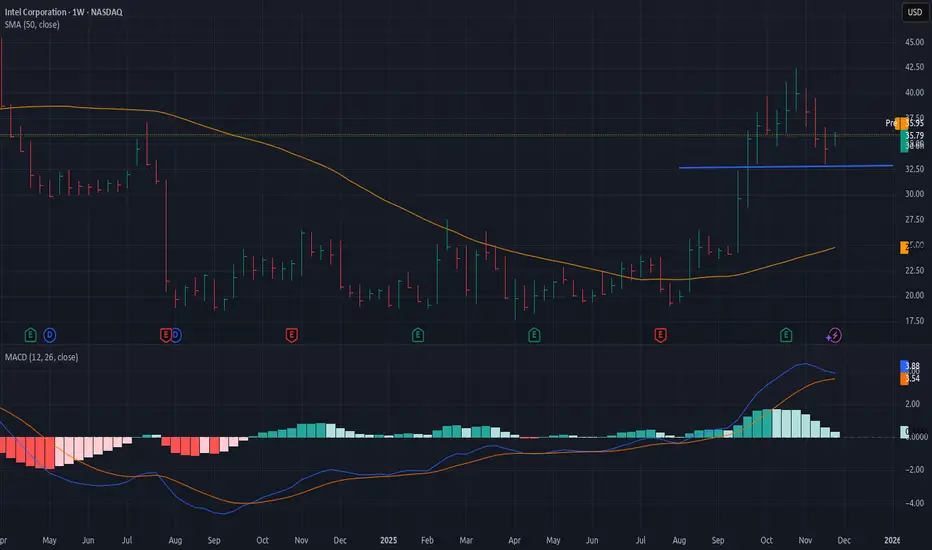
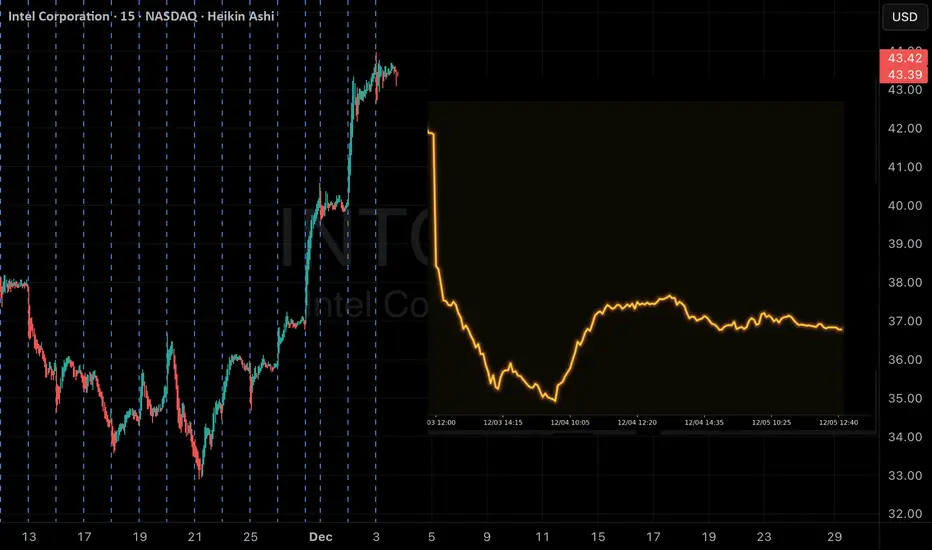
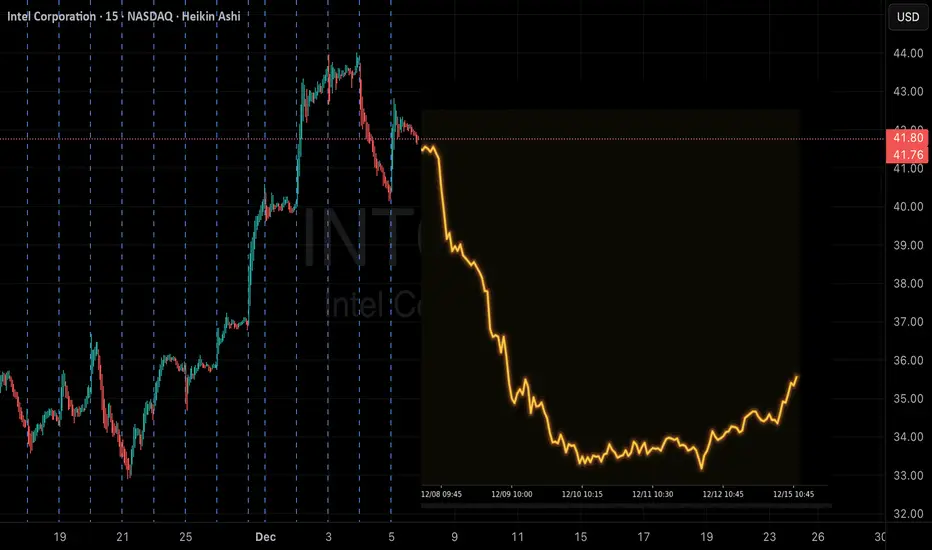
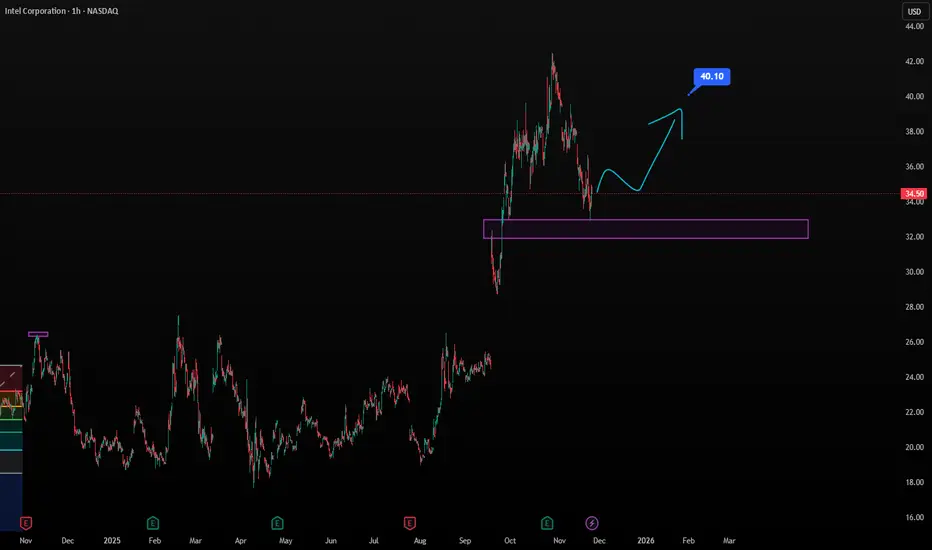
Just in the end of 2024, Intel perfectly retested a major long term horizontal support. After we then witnessed bullish confirmation, it was so obvious, that Intel will create a move higher. Now, Intel rallied +120% and is ready for a shorter term correction now.
📝Levels to watch:
$45
SwingTraderPhil
SwingTrading.Simplified. | Investing.Simplified. | #LONGTERMVISION
Intel Corporation
No trades
Trade ideas

INTC | Intel is Going To Pop In The Future | LONGIntel Corp. engages in the design, manufacture, and sale of computer products and technologies. It delivers computer, networking, data storage, and communications platforms. The firm operates through the following segments: Client Computing Group (CCG), Data Center and AI (DCAI), Network and Edge (NEX), Mobileye, Accelerated Computing Systems and Graphics (AXG), Intel Foundry Services (IFS), and All Other. The CCG segment consists of platforms designed for notebooks, 2-in-1 systems, desktops, tablets, phones, wireless and wired connectivity products, and mobile communication components. The DCAI segment delivers solutions to cloud service providers and enterprise customers, along with silicon devices for communications service providers and high-performance computing customers. The NEX segment offers computing system solutions from inflexible fixed-function hardware to general-purpose compute, acceleration, and networking devices running cloud native software on programmable hardware. The Mobileye segment develops driving assistance and self-driving solutions. The AXG segment provides products and technologies designed to help customers solve the toughest computational problems. Its products include CPUs for high-performance computing and GPUs targeted for a range of workloads and platforms, from gaming and content creation on client devices to delivering media and gaming in the cloud, and the most demanding high-performance computing and AI workloads on supercomputers. The IFS segment refers to full stack solutions created from the foundry industry ecosystem. The All Other segment represents results from other non-reportable segments and corporate-related charges. The company was founded by Robert Norton Noyce and Gordon Earle Moore on July 18, 1968 and is headquartered in Santa Clara, CA.

INTC Swing Play: Apple Deal Breakout — High-Conviction set upInstrument: INTC
Strategy: Swing CALL
Strike Price: $40.00
Entry Price: $2.10 – $2.30
Target 1: $3.15 (50% gain)
Target 2: $4.20 (100% gain)
Stop Loss: $1.40 (33% loss)
Expiry: 2025-12-19 (18 days)
Position Size: 3% of portfolio
Confidence: 65%
1W Move: -0.88% | 2W Move: +0.86%
Volume vs Prior Swing: 1.3×
Swing Range: $39.49 – $40.80
Options Flow: Neutral
Risk Level: MODERATE
Technical Notes: Breakout above $38 resistance; VWAP support $36.07; momentum indicators bullish
News/Catalyst: Apple chip deal creates strong bullish sentiment for US chip sector
Katy AI Prediction: Conflicting — Katy predicts bearish (-12.99%), LLM suggests BUY CALLS
⚠️ High Risk Warning: Stock already moved 17.5% intraday; wait for pullback to optimal entry zone and use strict stop loss.
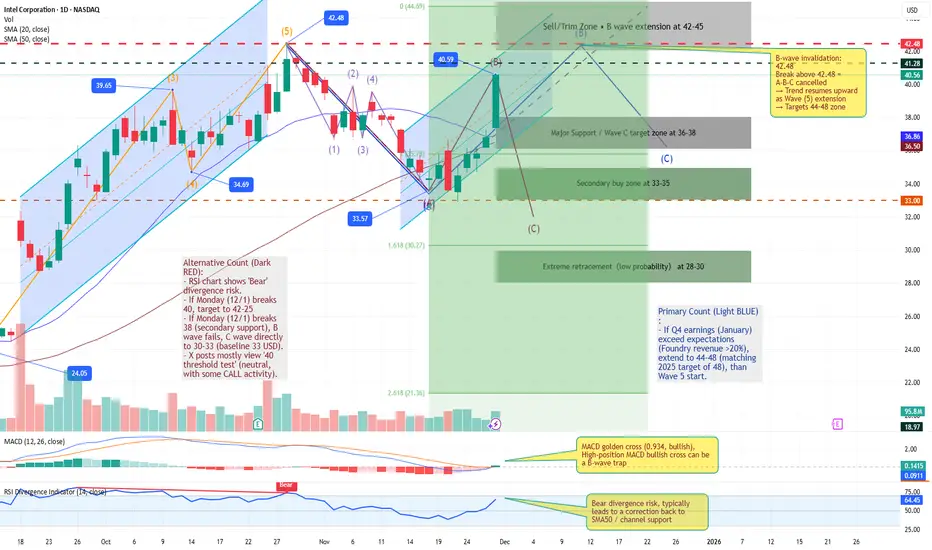
INTC: ABC Correction Fails – Wave 5 Impulse Targets $45+INTC Elliott Wave Update: ABC Correction Fails – Wave 5 Impulse Targets $45+
Published: Dec 3, 2025 | Bullish Reversal | Wave Invalidation
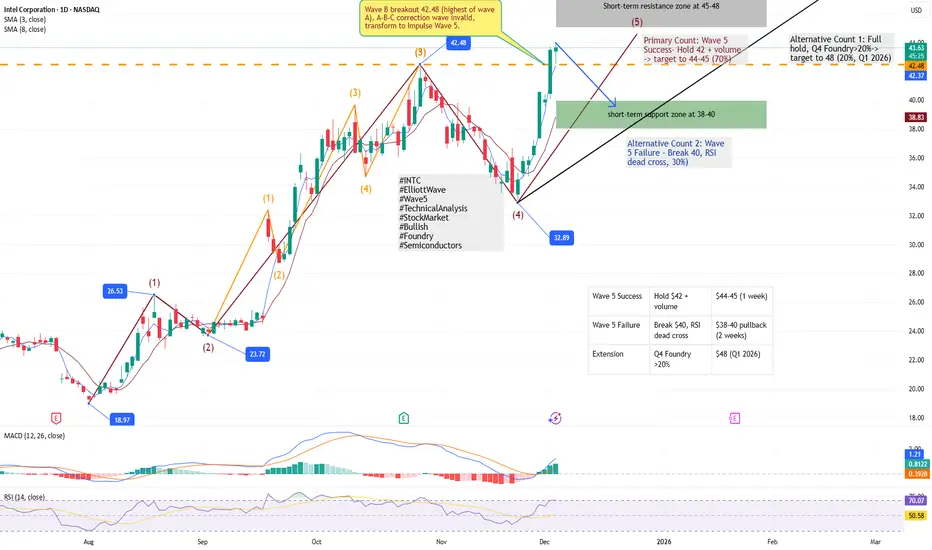
Last week's Idea forecasted a C-wave drop to $30-33 in an ABC correction from the $42.48 high. However, INTC's explosive rally—breaking decisively above $42.48 on Dec 2 (now ~$42.92)—has invalidated the ABC setup entirely. The failure stems from B-wave extension beyond 100% retracement (A-low at $33), coupled with volume surge (1.5B shares) and MACD golden cross (0.934 bullish), signaling exhaustion of correction and bullish impulse resumption. This reclassifies the prior ABC as Wave 4's sub-correction, launching Wave 5 from the $33 low.
Key Signals:
Invalidation Confirmation: Price holds above $42.48 with no C-wave probe; RSI divergence (69.7) resolves bullishly short-term.
Targets: $44-45 (channel extension, 1 week); $48+ on Q4 Foundry beat (>20% growth, Jan 2026).
Risks: $40 support—break below eyes $38 retest (30% odds).
Disclaimer: This analysis is for educational purposes only and is not investment advice. Please do your own research (DYOR) before making any trading decisions.
Is Intel’s Apple Deal the Ultimate Pivot?Intel (NASDAQ: INTC) stock soared over 116% this year. Reports suggest Apple may use Intel’s foundry by 2027. We analyze the drivers behind this potential resurrection.
Geopolitics & Geostrategy: The Stability Premium
In a volatile world, Intel offers a "stability premium." TSMC’s concentration in Taiwan risks Western supply chains. The US government now holds a ~10% stake in Intel. This actively incentivizes domestic production to secure the grid. Apple chooses Intel to hedge against geopolitical friction. This move aligns with US strategic interests, treating Intel as a sovereign asset.
Management & Leadership: The Tan Effect
CEO Lip-Bu Tan drives a massive cultural shift. He replaced Pat Gelsinger’s engineering vision with operational discipline. Tan prioritizes customer listening, an area where Intel historically struggled. This pivot is paying off. Securing Apple proves Intel is shedding its "arrogant" legacy. It is becoming a true service-oriented foundry.
Technology & Innovation: The 18A-P Advantage
The deal relies on Intel’s **18A-P process technology**. Apple aims to use this for entry-level M-series chips. This validates Intel's aggressive manufacturing roadmap. Additionally, the Trump administration invested $150 million in xLight. This startup develops next-gen lithography lasers to aid chipmaking. It reinforces the ecosystem surrounding Intel’s manufacturing capabilities.
Business Models: The Foundry Pivot
Intel is transforming from a product company to a hybrid foundry. Analysts estimate the Apple deal could generate ~$1 billion annually. However, the "Apple Seal of Approval" is worth far more. It signals to giants like Qualcomm that Intel is ready. It also creates leverage against TSMC’s pricing power.
Final Verdict: The Apple rumors convert Intel into a legitimate turnaround play. US geopolitical interests align with the new leadership. Validated technology suggests Intel’s worst days are likely over.
INTCStocks rally after rumors of chip production for Apple and why fundamental problems lurk behind the hype.
Rumors of a partnership are indeed developing, but without official confirmation and with a very long horizon
Key caveat: this only applies to manufacturing (fabrication), not design. Apple will continue to design chips, and Intel will become a manufacturer alongside TSMC.
The report clearly reveals systemic problems
Intel Foundry—a budget hole.

INTC Katy Override Alert — Bearish Reversal Detected!INTC QuantSignals V3 — Weekly Signal (2025-12-03)
Signal Overview
• Direction: BUY PUTS (Katy Override)
• Confidence: 58%
• Expiry: 2025-12-05 (2 days)
• Strike Focus: $41.00
• Entry Range: $2.63
• Target 1: $4.12
• Stop Loss: $1.55
• Weekly Momentum: BULLISH (+1.01% 1W)
• Flow Intel: Neutral
🔴 HIGH RISK WARNING
Directional conflict → trade requires extra caution and small size.
⚖️ Compliance:
Educational commentary for QS Premium members only. Not financial advice.
⚠️ KATY–LLM CONFLICT DETECTED
Conflict Type: Direction
Severity: HIGH
• LLM Recommendation: BUY CALLS
• Katy Chart Prediction: BUY PUTS (–7.36% predicted move)
• Katy Confidence: 50%
• Katy Data Points: 168 prediction points — consistent bearish slope
Resolution
Katy’s bearish time-series projection overrides the LLM’s bullish call.
→ Final Direction: BUY PUTS
🧠 ANALYSIS SUMMARY
Katy AI Forecast
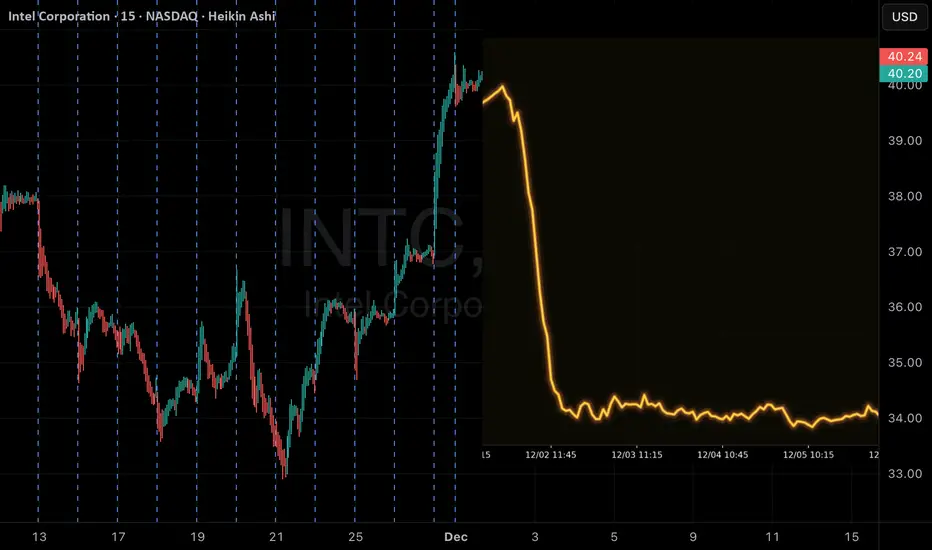
Katy projects a steady decline from $43.49 → ~$40.32 (-7.3%) within 2 days.
• 168-point forecast shows continuous downward movement
• Only minor intra-day bounces
• Strong statistical consistency
Technical Analysis
• Current Price: $43.49 (near weekly high $43.98)
• Support: $40.00
• Resistance: $44.00
• Up +7.06% today → overextended
• Volume = 0.5× average, showing weak conviction at highs
• Daily chart forming potential reversal despite bullish weekly trend
News Sentiment
Mixed:
• Apple partnership hype driving near-term rally
• But hitting 52-week highs → exhaustion risk
• Positive news, but technically overbought
Options Flow
• Flow currently Neutral
• No extreme PCR readings
• Low conviction = requires conservative strike & sizing
💰 TRADE SETUP
• Expiry: 2025-12-05 (2 days)
• Strike: $41.00
• Entry: $2.58 – $2.68
• Target 1: $4.12 (+60%)
• Target 2: $5.68 (+120%)
• Stop Loss: $1.55 (–40%)
• Position Size: 2% of portfolio
⚡ COMPETITIVE EDGE
Why This Trade Works:
• Katy’s prediction shows tight, consistent downside across all 168 forecast points
• +7% daily pump creates ideal put-entry on overextension
• High delta (0.904) favors profitability even on modest retraces
• Tight stop loss = disciplined risk management
🚨 IMPORTANT NOTES
• Katy AI’s –7.3% forecast overrides weekly bullish composite
• Directional conflict → reduced conviction (MEDIUM)
• 2-day expiry means timing is critical
• Position size capped at 2% due to elevated risk
📊 TRADE DETAILS
• Instrument: INTC
• Direction: PUT
• Strike: $41.00
• Entry: $2.63
• TP: $4.12
• SL: $1.55
• Confidence: 58%
• Signal Time: 2025-12-03 11:38:51 EST
• Risk: HIGH
Intel (INTC) QuantSignals V3 — 12/05 Premium Swing Trade Breakdo📊 INTC Swing Information
Ticker: INTC
Date: 2025-12-05
Model: QuantSignals V3 Swing
Direction: BUY CALLS
Confidence: 68% (Medium)
Horizon: 14 days — until 2025-12-19
Entry Range: $1.71 – $1.75
Strike Focus: $42.00
Profit Target: $2.57
Stop Loss: $1.20
1W Move: +2.38%
2W Move: +3.86%
Volume: 1.2× previous swing
Swing Range: $40.14 – $42.83
Market Context:
• SPY: Bullish
• QQQ: Bullish
• Sector: Strong Tech Momentum
Risk Level: Moderate
⚠️ Katy vs LLM Conflict
LLM: BUY CALLS
Katy Prediction: BUY PUTS (-13.11% predicted move)
Katy Confidence: 50%
Conflict Severity: HIGH
🧠 Quick Summary
Intel shows bullish short-term momentum after a 16.24% surge, supported by tech-wide strength and AI-related news catalysts. However, Katy model expects a possible pullback. Position size should remain conservative.
Intel Corporation (INTC) Expands AI-Ready Processor LineupIntel Corporation (INTC) designs and builds the chips that power everyday tech, from PCs to data centers. The company is pushing hard into advanced manufacturing, AI-ready processors, and foundry services to win back market share and meet rising demand for faster, more efficient computing. Growth leans on new product launches, expanding chip capacity, and the global rush toward AI hardware.
On the chart, INTC printed a confirmation bar with rising volume as price moved above the 0.236 Fibonacci level and into the momentum zone. A simple trade plan is to set a trailing stop just under that 0.236 line using the Fibonacci snap tool, keeping risk tight while letting the trend continue.

Intel (INTC) Shares Trade Above $40Intel (INTC) Shares Trade Above $40
Earlier, we highlighted the factors that helped Intel (INTC) shares recover strongly in 2025, including support from the U.S. government, leadership changes, investment from Japanese conglomerate SoftBank Group, and more.
According to recent reports, Intel could gain a major new client in Apple (AAPL). Yahoo Finance cites analyst Ming-Chi Kuo, who stated on X that Intel’s prospects have “improved significantly.” Intel may begin producing chips for Apple as early as 2027, potentially reducing reliance on Taiwan’s TSMC.
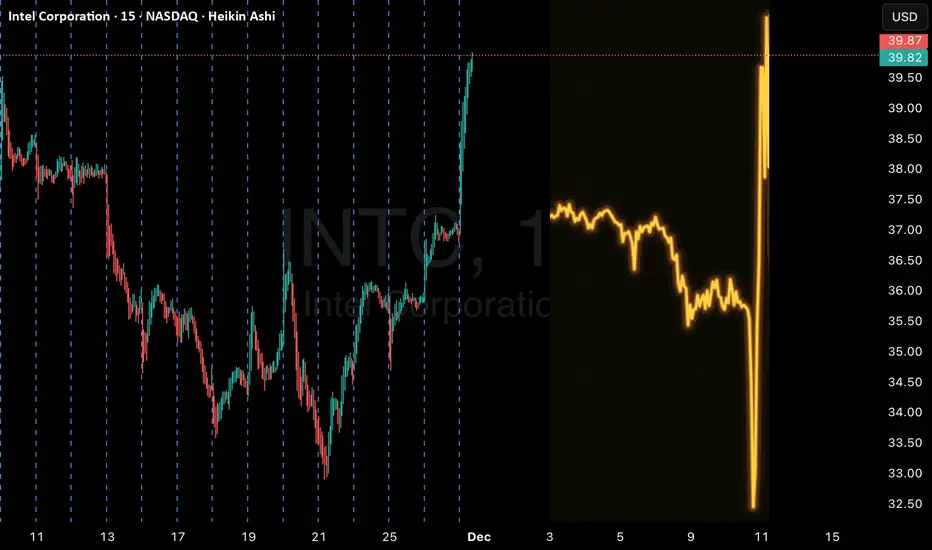
Although there are no official confirmations, sentiment on the market is positive. Since the start of last week, INTC shares have risen by over 20%, reaching their highest level since spring 2024, breaking past the psychological $40 mark.
Technical Analysis of INTC
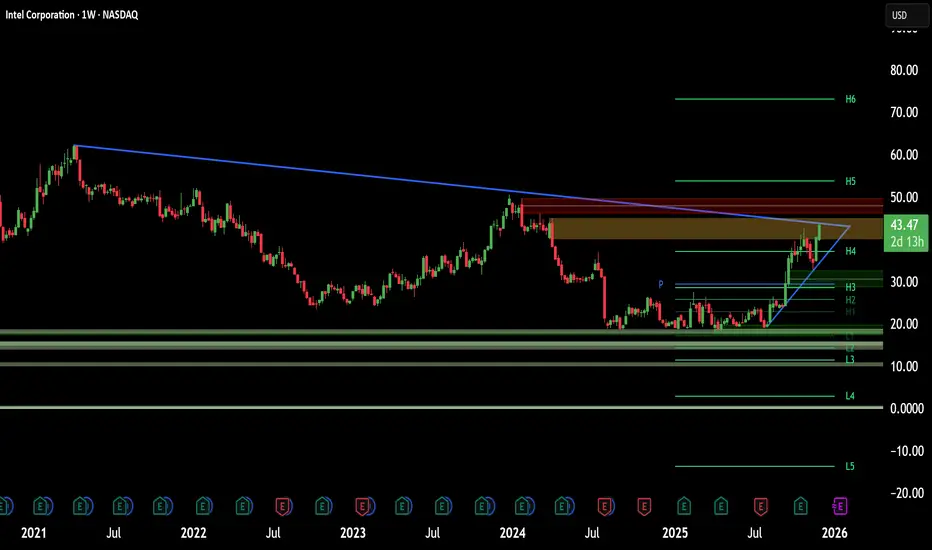
Six months ago, INTC’s chart showed $20 as a key support level, backed by major investors. Since then, the stock has formed an ascending channel (shown in blue), which was extended upwards in September.
Bulls have steadily asserted control, pushing the price to higher levels, with support at $30 and later the channel’s median. After a brief consolidation in late November, the $40 level was breached.
Currently, the price sits near a line dividing the upper half of the channel into quarters, which may act as resistance, especially given signs of overbought conditions on key technical indicators.
If Intel’s strategic collaboration with Apple is officially confirmed, it could generate around $1 billion in revenue, leaving the current technical levels on the chart far below the potential upside.
This article represents the opinion of the Companies operating under the FXOpen brand only. It is not to be construed as an offer, solicitation, or recommendation with respect to products and services provided by the Companies operating under the FXOpen brand, nor is it to be considered financial advice.
Intel Corporation and Apple Rumors Ignite a Bullish SurgeIntel Corporation (NASDAQ: NASDAQ:INTC ) jumped more than 10% on Friday as fresh speculation pointed to Apple potentially becoming a major new customer. The rally followed a social media post by TF International Securities analyst Ming-Chi Kuo, who suggested industry surveys indicate Apple could begin sourcing processors from Intel as early as 2027. The possibility marks one of the most meaningful shifts in Intel’s long-term manufacturing prospects in several years.
Investors reacted quickly because a deal with Apple would strengthen confidence in Intel’s turnaround strategy. Despite a strong year—where shares have doubled in value—Intel continues to face questions about its ability to secure durable, high-volume contracts. Apple, known for its vertically integrated chip ecosystem, would represent a major validation of Intel’s foundry ambitions. While neither company has publicly commented, the speculation alone has reinforced bullish sentiment surrounding Intel’s expanding customer pipeline.
Intel’s recent performance is underpinned by several high-profile partnerships, including collaborations with Nvidia (NVDA) in advanced chip manufacturing. These deals, combined with ongoing restructuring efforts, have pushed investor confidence higher. Yet the company remains far from its historical highs, and long-term execution remains the central focus for the market.
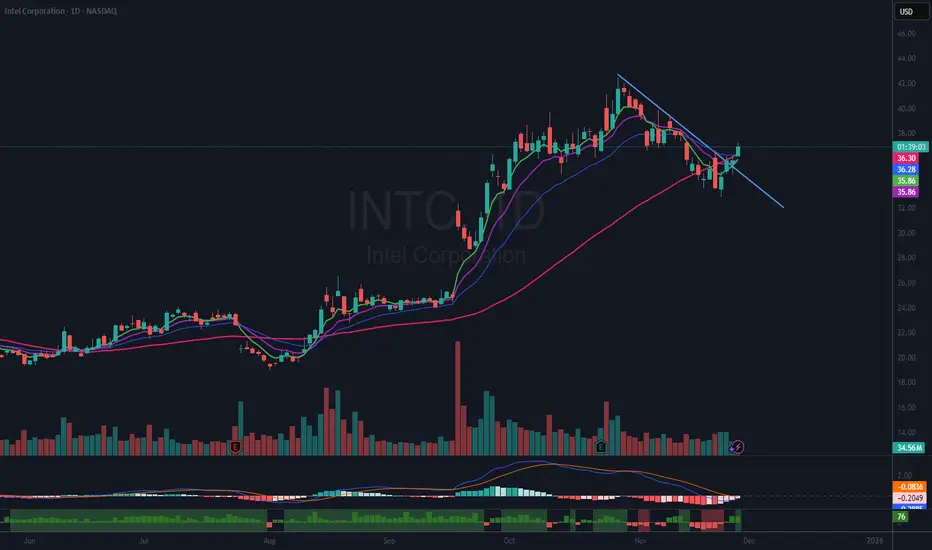
Technical Analysis
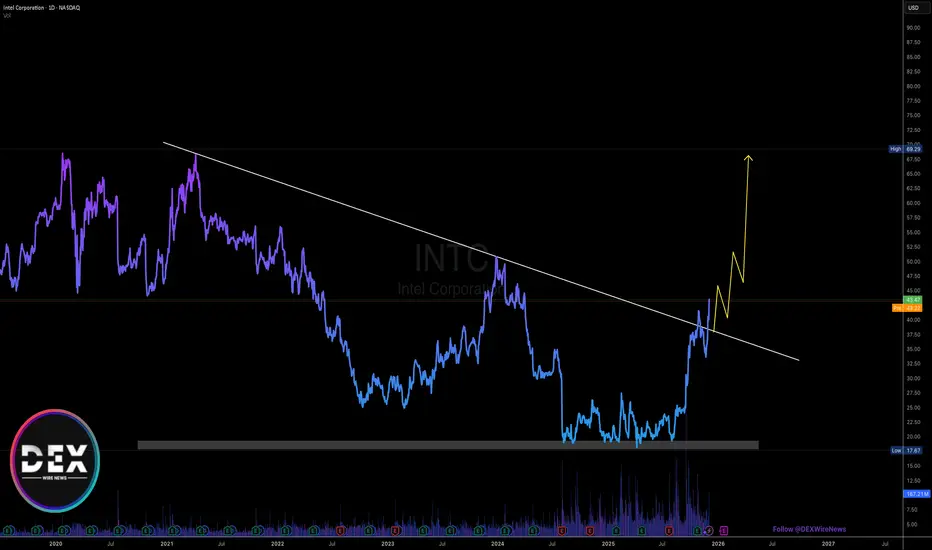
Intel trades in a strong bullish structure, now pressing against a key descending trendline that has acted as resistance for months. Price is breaking above this level with clear momentum, signaling a possible shift into a broader upward continuation. The next resistance sits at $50, followed by a major level at $68 if bullish pressure sustains. On the downside, support rests at $32, with deeper support at $25 if the trend cools. Current momentum favors the bulls as long as price holds above the breakout zone.
$INTC bullish structureJust added more to my NASDAQ:INTC position. $50 is still my target. Structure looking good.

Midterm Stock Forecast for IntelNASDAQ:INTC at $34.5 remains in a gradual recovery phase. H1 chart structure points toward a midterm move to $40, supported by stabilizing fundamentals and improving fabrication roadmaps. While competition remains strong, sentiment is recovering from multi-year lows.
INTC Quant signals v3: Weak Movement, No Edge DetectedINTC — QuantSignals Katy 1M Trading Information (2025-11-27)
🚀 Katy AI Stock Analysis
Symbol: INTC
Current Price: $36.95
📈 Katy Forecast
Final Prediction: $36.84 (–0.29%)
30min Target: $36.93 (–0.05%)
Trend: NEUTRAL
Confidence: 40% (Low)
Volatility: 50.1% (High)
⚠️ Trade Signal Status
No trade signal generated
— Move size too small and confidence below QS threshold.
📊 Summary
From 1 analysis, Katy generated 0 actionable trading signals.
INTC remains in a low-conviction, low-movement zone with high volatility but no clear direction.
INTC | Bottoming Process is Progress | BounceIntel Corp. engages in the design, manufacture, and sale of computer products and technologies. It delivers computer, networking, data storage, and communications platforms. The firm operates through the following segments: Client Computing Group (CCG), Data Center and AI (DCAI), Network and Edge (NEX), Mobileye, Accelerated Computing Systems and Graphics (AXG), Intel Foundry Services (IFS), and All Other. The CCG segment consists of platforms designed for notebooks, 2-in-1 systems, desktops, tablets, phones, wireless and wired connectivity products, and mobile communication components. The DCAI segment delivers solutions to cloud service providers and enterprise customers, along with silicon devices for communications service providers and high-performance computing customers. The NEX segment offers computing system solutions from inflexible fixed-function hardware to general-purpose compute, acceleration, and networking devices running cloud native software on programmable hardware. The Mobileye segment develops driving assistance and self-driving solutions. The AXG segment provides products and technologies designed to help customers solve the toughest computational problems. Its products include CPUs for high-performance computing and GPUs targeted for a range of workloads and platforms, from gaming and content creation on client devices to delivering media and gaming in the cloud, and the most demanding high-performance computing and AI workloads on supercomputers. The IFS segment refers to full stack solutions created from the foundry industry ecosystem. The All Other segment represents results from other non-reportable segments and corporate-related charges. The company was founded by Robert Norton Noyce and Gordon Earle Moore on July 18, 1968, and is headquartered in Santa Clara, CA.

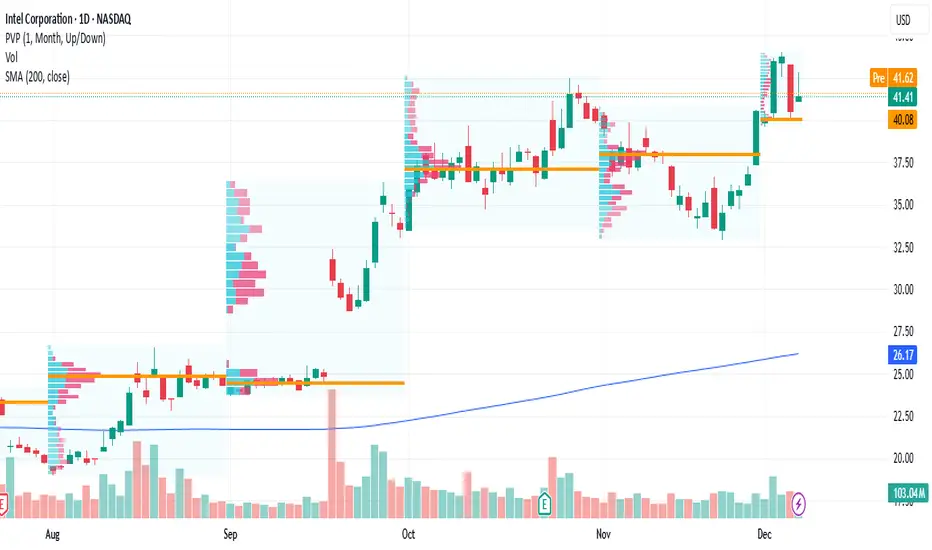
Intel’s breakout momentum points to more upside this weekCurrent Price: $41.41
Direction: LONG
Confidence Level: 72% (Several traders and strong social sentiment point bullish despite some valuation concerns)
Targets:
- T1 = $43.00
- T2 = $45.00
Stop Levels:
- S1 = $40.00
- S2 = $38.80
**Wisdom of Professional Traders:**
I'm seeing a notable alignment in the commentary from multiple professional traders highlighting Intel’s turnaround story. The collective trader consensus zeroed in on the positive Q3 2025 earnings beat, the government’s $8.9B stake, and strategic investments from Nvidia and SoftBank as catalysts driving renewed confidence. Several traders emphasized Intel’s AI and foundry expansion as a long-term differentiator and a reason why the near-term price action remains bullish. The combination of technical breakout signals—like the August golden cross and sustained trading above key moving averages—were repeatedly mentioned as important bullish markers.
**Key Insights:**
Here’s what’s driving this: traders see Intel in the middle of a well-executed turnaround backed by government policy, major strategic partnerships, and improved financial metrics. Gross margins topping expectations and sequential revenue growth are being viewed as signs of operational momentum. At the same time, chatter on X has leaned bullish with posts pointing to a year-to-date doubling from the lows and outperforming Nvidia over recent months. The $38–$40 range keeps coming up as a strong support area from recent trading and technical analysis, reinforcing a base for further upside.
That said, some market experts pointed out Intel’s lofty forward multiple compared to the sector, which could limit gains if sentiment shifts. However, near-term momentum, news catalysts, and chart structure outweigh those valuation concerns for short-term traders. The key point here is that the stock is already above the breakout zone and holding gains, so the path of least resistance remains higher into this week.
**Recent Performance:**
This has all played out clearly in the price action: Intel surged over 6% after the Q3 earnings beat, pushing above $40 and holding that level into the new week. It’s now up roughly 87% over the past year, with a particularly sharp +37% move since the golden cross in mid-August. Short bursts of consolidation have been followed by higher highs, and last week’s rally pushed into the $41–$42 zone where traders are now eyeing $43 and $45 as the next upside targets.
**Expert Analysis:**
The market experts I’m tracking agree that near-term price action is bullish. Multiple traders identified $38–$40 as crucial support and a springboard for the next leg higher. Resistance levels at $43 and $45 showed up repeatedly in their charts and commentary. The breakout above the 50-day moving average and maintaining distance from a rising 200-day average are strong technical signals. While there’s execution risk in its foundry ambitions and competition from TSMC and Samsung, the current setup favors momentum players taking the long side for weekly gains.
**News Impact:**
The news flow is adding plenty of fuel here: stronger-than-expected Q3 earnings, the $8.9B White House investment, and speculation around a potential foundry deal with TSM are dominating headlines. Several traders noted that these developments reinforce Intel’s positioning as a strategic national asset, potentially benefiting from sustained policy support. Positive media coverage comparing Intel’s recent performance favorably to Nvidia is helping sentiment on trading desks and across social media.
**Trading Recommendation:**
Putting it all together, I like a long entry here while price action is holding above $40 support. My plan for this week is T1 at $43 and T2 at $45, with stops at $40.00 and $38.80 to manage risk. With bullish sentiment from both professional traders and the X community, plus strong technical momentum and supportive news, Intel has a solid probability of extending gains in the short term. Position sizing should respect the stop levels given the stock’s rally and stretched valuation, but the upside setup into this week looks favorable.
INTC Moving LowerWith price rejecting off the bearish fair value gap and failing to hold above the 1 hour 50 ema, we can expect price to return to the next major level and fill the bullish fair value gap to rebalance the RSI before moving higher.

Going short on INTC Intel (INTC) has seen a major run-up over the past few months, fueled heavily by government investment, renewed optimism around its foundry roadmap, and broader AI-sector hype. While the long-term narrative remains constructive, the short-term technical picture is stretched.
Price is now showing signs of exhaustion after a parabolic move, and momentum has begun to cool. With buyers losing steam and key resistance levels holding, a corrective phase looks increasingly likely.
I’m watching for a pullback into the $26.60 zone, which aligns with previous structure support, retracement levels, and the start of the breakout that launched this latest rally. This area could act as a healthy reset before the larger trend decides its next direction

Breaking: Intel Corporation (INTC) Surge 8.6% Set for $70 MoveThe price of Intel Corporation (NASDAQ: NASDAQ:INTC ) saw a noteworthy uptick of 8% in Tuesday's extended trading session breaking out of the ceiling of a symmetrical triangle- eyeing the $70 resistant amidst increase in bullish sentiment.
The rise came as the S&P 500 and the Nasdaq Composite jumped 0.2% and 0.5%, respectively.
Intel's stock continued to climb tod, driven by Friday's unconfirmed report that the chipmaker is set to begin manufacturing semiconductors for Apple's MacBook Air and iPad Pro.
If the report is confirmed, it would be a massive win for the embattled chipmaker. Intel once dominated the semiconductor industry with its efficient CPUs, but it has fallen behind in the era of artificial intelligence (AI), a technology that is powered primarily by GPUs. A vote of confidence from Apple would go a long way in aiding the company's turnaround efforts.
About INTC
Intel Corporation designs, develops, manufactures, markets, and sells computing and related products and services worldwide. It operates through Intel Products, Intel Foundry, and All Other segments. The company offers microprocessor and chipset, stand-alone SoC, and multichip package; Computer Systems and Devices; hardware products comprising CPUs, graphics processing units (GPUs), accelerators, and field programmable gate arrays (FPGAs); and memory and storage, connectivity and networking, and other semiconductor products.
INTC:B-Wave Rally Targets 42-45 Amid Foundry MomentumIntel (INTC): B-Wave Rally Targets 42-45 Amid Foundry Momentum
Published: Nov 29, 2025 | Bullish Bias | Elliott Wave Setup
Intel ( NASDAQ:INTC ) is staging a compelling B-wave rebound from its A-wave low at $33, breaking above the $40 Fibonacci 78.6% retracement and ascending wedge upper channel.
Yesterday (11/28)'s close at $40.56 (+2.3%) on 1.9B shares confirms bullish control, with MACD golden cross at 0.934 signalling momentum shift. RSI at 64.5 shows bearish divergence risk—watch for >70 overbought pullback to SMA channel support (~$36).
Technical Breakdown:
• Wave Structure: Primary count (light blue): A-C correction complete; B-wave (zigzag) underway, targeting up to 100% retrace at $42.48 (A-high test)—break above invalidates ABC, signalling impulse wave (e.g., Wave 3 start) with higher targets (45+). Extension to 123.6% ($44.72) unlikely without invalidation, but possible if Q4 earnings beat (Jan 2026). Alternative (dark red): Bear divergence leads to C-wave failure below $38, probing $30-33 baseline.
• Key Levels: Support $38 (secondary)/$33-35 (major); Resistance $42-45 (sell trim zone). Volume surge (+60% avg) validates upside—sustain >2B shares for conviction.
• Indicators: MACD bullish (high-position cross as B-trap escape); Stochastic neutral (18.7, room to run).
Fundamentals Fueling the Move: Q3 revenue beat ($13.7B) and AI PC shipments (>1B units by 2025 end) underscore Foundry pivot. Apple chip rumors and CHIPS Act tailwinds add catalysts, offsetting TSMC litigation noise (neutral short-term). Consensus "Hold" (target $34.84) undervalues rally potential—Tigress eyes $52.
Momentum Notes: If Q4 Foundry >20% growth, extend to $44-48 (2025 match). Position for 1-2 weeks; rotate profits to TSLA on pullback. Bullish until $38 break—watch FOMC Dec 18.
Disclaimer: This analysis is for educational purposes only and is not investment advice. Please do your own research (DYOR) before making any trading decisions.
$INTC Classic 20% Pullback AnalysisOverview of Recent INTC Performance
Intel Corporation (INTC) experienced significant positive momentum following its gap-up breakout on September 18th. From the closing high on September 17th to the closing high on October 28th, the stock delivered an impressive gain of 67%.
Subsequent Pullback and Technical Retracement
After reaching its peak, INTC underwent a pullback of just over 19%. This decline represented a 50% retracement of the prior advance, a common technical milestone. During this period, the stock briefly dipped below its 50-day moving average (DMA), a level often regarded as a key support by technical analysts.
Recovery and Position Initiation
Today INTC reclaimed both the 50-day moving average and the 20-day exponential moving average (EMA). Additionally, the stock broke above its downtrend line, signaling renewed strength. In response to these technical developments, I initiated a half-size position in INTC, setting a stop-loss just below the day’s low to manage risk.
Risk Management and Investment Disclaimer
Readers need to conduct their own analysis and adhere to their personal trading strategies. Please remember that all investments involve inherent risks. Making informed decisions is crucial when allocating capital in the financial markets.
Intel trying something very soon!“We are seeing negative divergence on the RSI indicator. Additionally, Intel’s future projections would not look very promising if it weren’t for Trump’s rhetoric about bringing chip production back to the U.S. With this narrative, Intel appears poised for upward momentum. In a scenario where tensions with China escalate further, this potential rise could occur even sooner.”
*My probable expectation is $57 in the first stage.

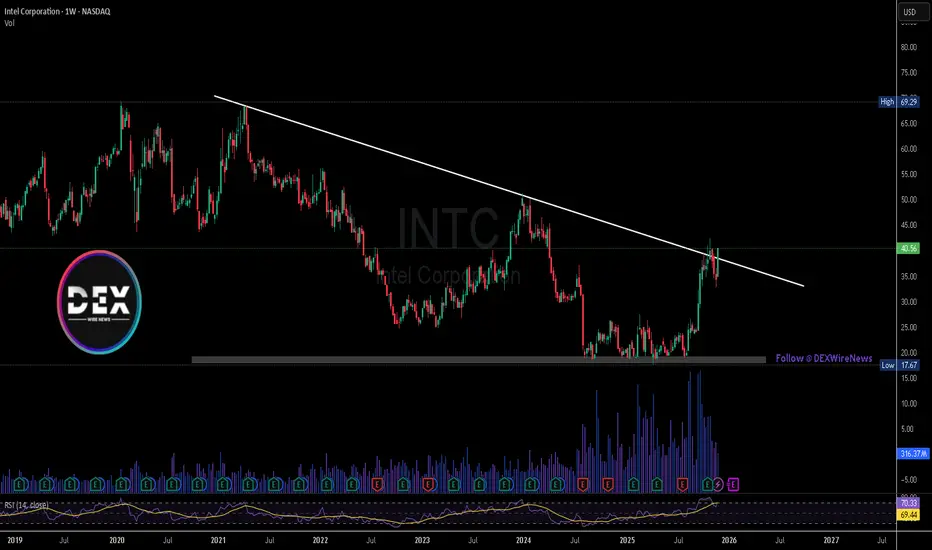
INTC long-term TAIntel is strong, it's a beautiful reversal of a downtrend on a long-term trend. Current uptrend is in correction and there's a distribution going on mid-term, which means now is not the best time to enter but considering strong weekly reversal INTC is something you should keep an eye on and pick up. The blue line for the support has been standing so far, we will see if it's going to be the lowest target in this correction.