MSTR ZONES OF CONFLUENCECalled this out some time back. Sometimes MSTR gives the cleanest setups on where price is headed as the Mnav and its tradable premium to Bitcoin decouple - a result of shareholder dilution, CAMT tax obligations, as well as interest payments on its preferred. Because of this, riding the down trend is clear and easy until respectfully breaks the upper threshold of support turned resistance - 360.
Trade ideas

BTC Exhaustion at $100K Could Trigger $MSTR Structural WeaknessI’ve been tracking Bitcoin’s price action, and buyers look exhausted at these levels. Since July, BTC has been topping out. There’s strong support at the $100K area — with the 200MA right around $103K — this zone is the battleground. If buyers lose it, we’re looking at a possible break of structure at $100K.
We all know NASDAQ:MSTR isn’t really a software company anymore — it’s basically a Bitcoin Treasury play. The model is simple: raise capital (debt, equity), buy more BTC, repeat. That means if BTC breaks lower, MSTR usually gets hit even harder. Leverage cuts both ways.
For me, $317 is the key level. If MSTR loses that, I’m targeting $300. I’ve already picked up some long puts at the $295 strike. My rule: if the premium drops 30%, I cut it as a wrong play. If it holds, I’ll ride it until it’s at-the-money.
As always — manage risk like your survival depends on it. Because it does.

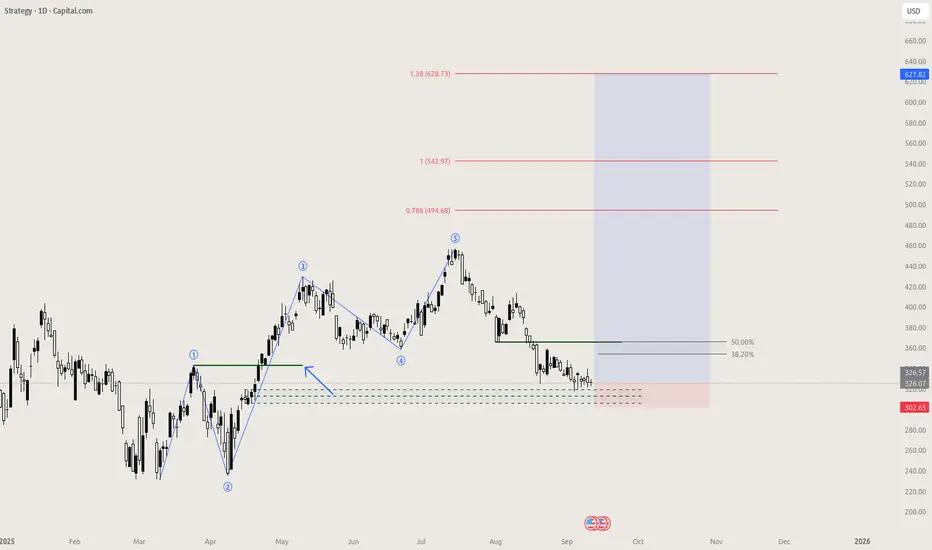
The Next Big Crypto Trade Bitcoin has experienced a notable decline following a failed auction attempt after sweeping all-time high liquidity. This move is now being followed by a significant retracement toward the lower boundary of the broader range, with the current range low positioned around $111K.
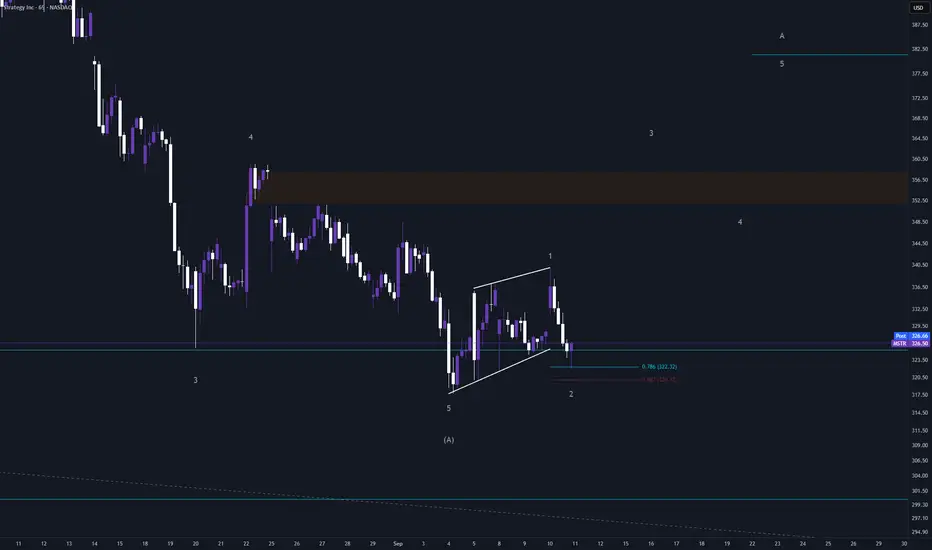
In contrast, MicroStrategy (MSTR) has exhibited a more structurally defined downtrend, having broken below its previous pivot low. This price action potentially forms a textbook ABC corrective pattern, with the 1:1 extension target clearly identifiable.
Should the broader market continue to decline in the lead-up to this week’s FOMC meeting and Powell’s remarks, a compelling long setup may emerge. This could coincide with a potential 'sell-the-news' reaction, particularly if the Federal Reserve moves to cut interest rates.
Rate-sensitive equities and assets may initially respond to such news with bullish enthusiasm, possibly triggering a wave of market euphoria and leading to a short squeeze scenario.
I’m closely monitoring the $320 level on MSTR, which aligns with three key technical confluences:
The 0.618 Fibonacci retracement level from the overall move (swing low to swing high).
The 1:1 extension target of the possible ABC corrective structure.
A key support/resistance flip zone, which may mark a potential structural pivot point.
This zone presents a high-probability area for potential price reaction. Let’s see how this plays out.

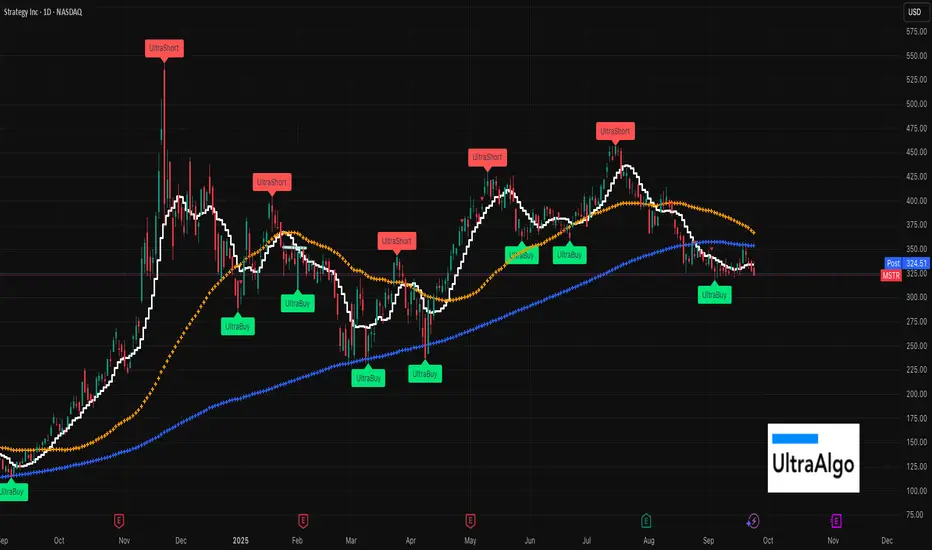
MSTR....set-up not looking goodNASDAQ:MSTR is below 9, 50, 200SMA! That's about the clearest red flag you can see. There could be some volatility, but would be very careful as it crosses down 330, 300 and then possibly the next support line is further down as people dump hard. CBOE:MSTZ is a nice inverse play here! Best of luck
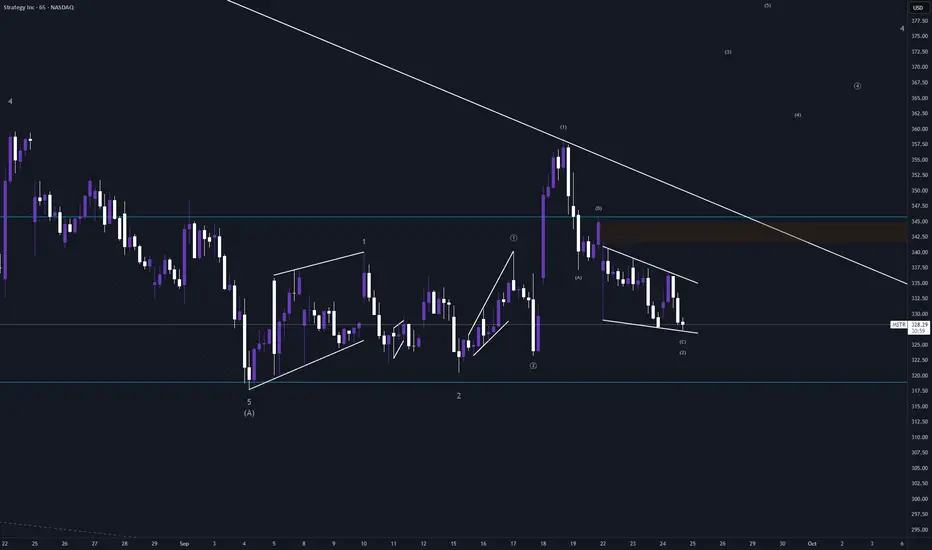
MSTR further winding up with a 1-2 1-2 1-2? Looks like MSTR might have just finished and ending diagonal for another wave c of 2. This could also just be a 1-2 1-2 still but so far counting it as a 1-2 1-2 1-2.
Either way, it looks like it is ready to rip to 380. Will see in the next couple of sessions how this plays out.
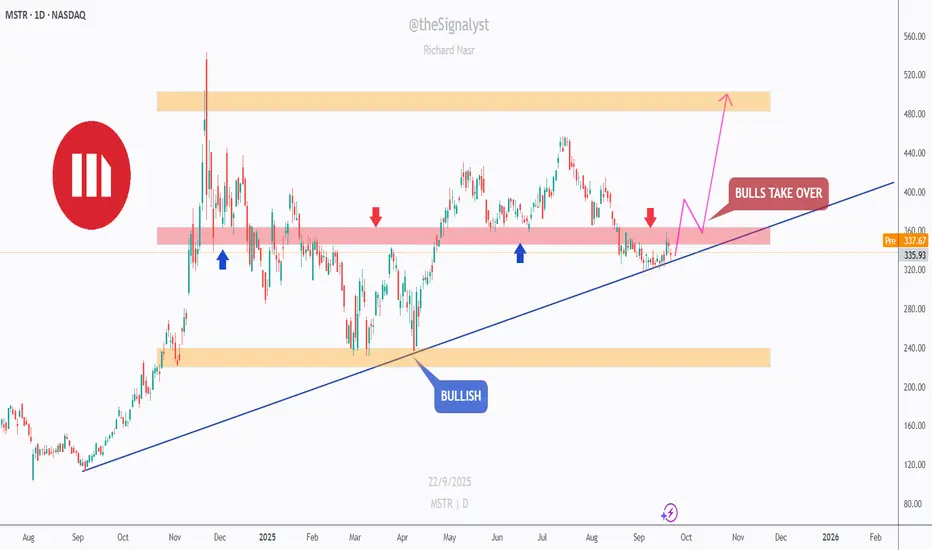
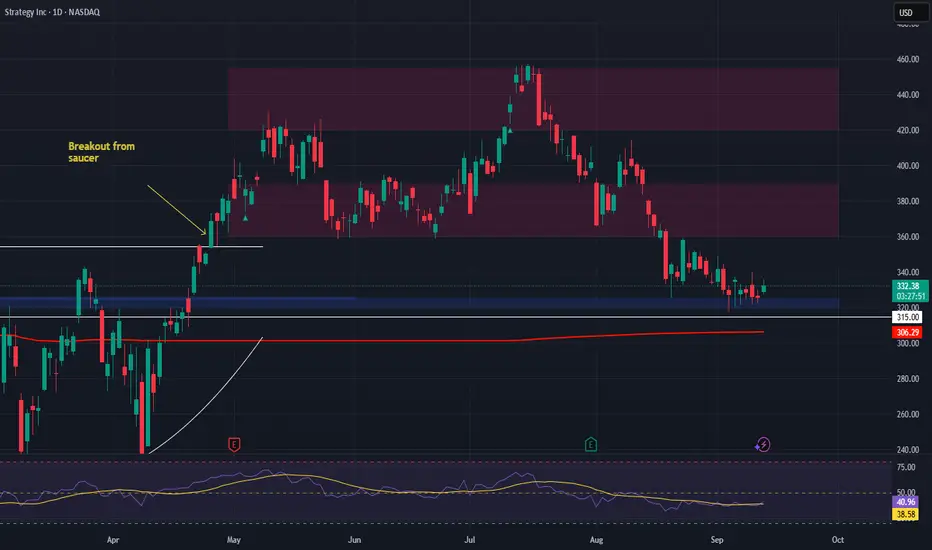
MSTR - Trendline Support vs. Supply Cap!MSTR has been overall bullish on the daily, respecting a rising trendline since last year. Price is coiling right beneath the 330–350 supply band after multiple rejections.
This area is key 🔑. It overlaps prior supply and the rising trendline—clean confluence. If bulls defend the trendline and we see a clean daily close above 350, momentum could extend toward 400 first, then 470–520 inside the broader range 🚀.
If the trendline gives way, I’ll look for a deeper dip toward 260–240 demand before bulls try again. Until then, structure favors the upside while the line holds.
What’s your plan => buy strength above 350 or wait for a retest on the trendline first? 🤔
⚠️ Disclaimer: This is not financial advice. Always do your own research and manage risk properly.
📚 Stick to your trading plan regarding entries, risk, and management.
Good luck! 🍀
All Strategies Are Good; If Managed Properly!
~Richard Nasr

down trend looks to rejoin 300 as the trend continuesUnless we see a significant breakaway from the descending triangle, it could widen and turn to symmetrical which aligns in with the ascending line set to rejoin its pattern. That could be a major shift if it bounces off resistance on the current pattern first.

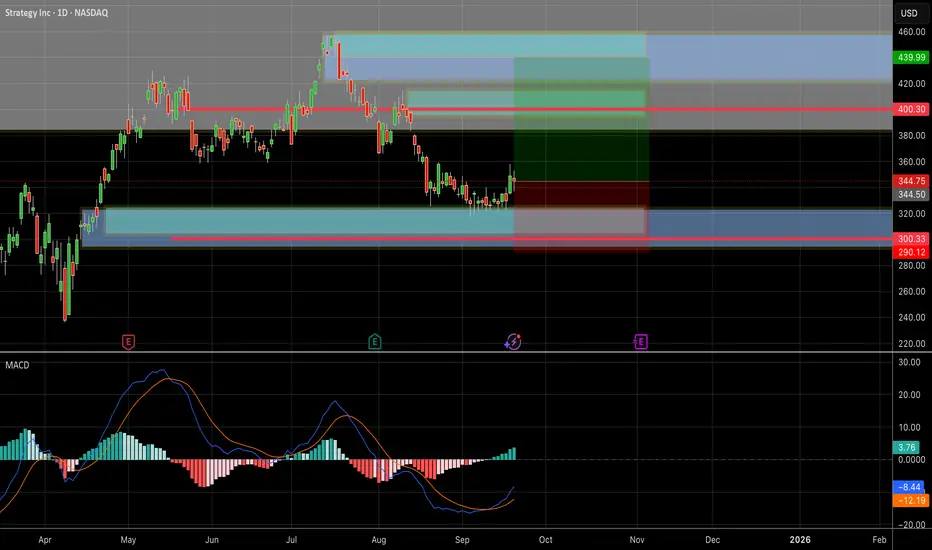
MicroStrategy (MSTR) Technical Analysis – September 2025 Technical Outlook:
• The stock is currently trading around $344 after a solid bounce from a key demand zone at $300 – $320.
• The MACD indicator shows a recent bullish crossover, with green histogram bars starting to form → signaling a potential continuation of upward momentum.
• On the daily chart, the first resistance zone is at $400 – $405, followed by an extended target at $440.
Trade Setup (Swing Idea):
• Entry Zone: $340 – $345.
• Stop Loss: Below $290 (a breakdown would invalidate the bullish setup).
• Targets:
• TP1: $400 (partial take-profit).
• TP2: $405.
• TP3: $440.
The Risk/Reward ratio (RRR) is attractive here (above 2:1).
Analysts’ View:
• Most analysts rate MSTR as Strong Buy / Buy.
• The 12-month price targets range between $530 – $600, with some optimistic projections going as high as $700.
• Key risk: MSTR’s performance is highly correlated with Bitcoin (BTC). Any strong BTC retracement could weigh heavily on the stock.
Conclusion:
MicroStrategy shows bullish technical signals after rebounding from strong support, supported by momentum indicators and positive analyst outlook.
Still, strict risk management is crucial, given the stock’s volatility and its dependence on Bitcoin’s price movements.
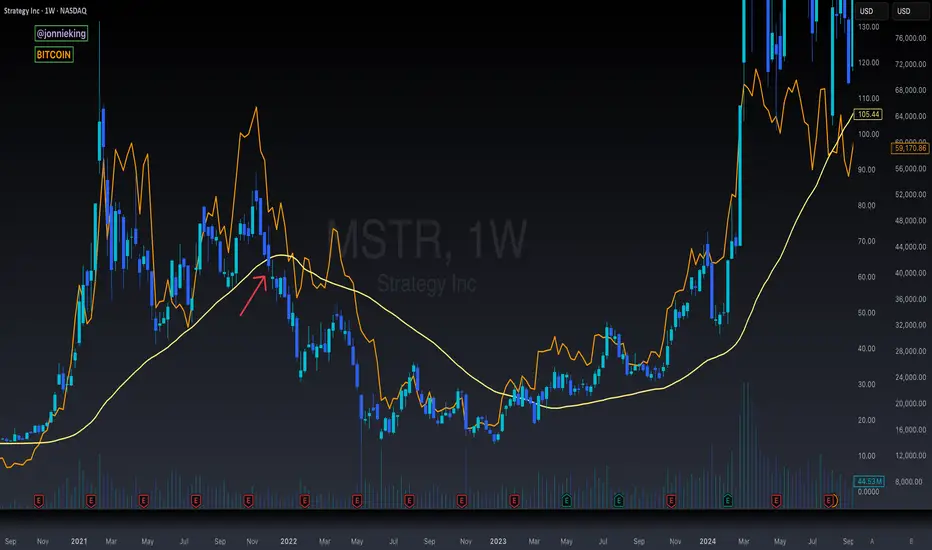
$MSTR Falling Below the 50WMA in 2021 Bull Market Here's a look at last cycle where NASDAQ:MSTR trading under the 50WMA for several weeks led to the CRYPTOCAP:BTC bear market.
The reason why this was so significant last cycle is because they were responsible for such a large share of BTC buy pressure.
This cycle we have lots of other treasury companies, with many more to come, as well as ETFs of course, so I'm not as concerned with this PA.
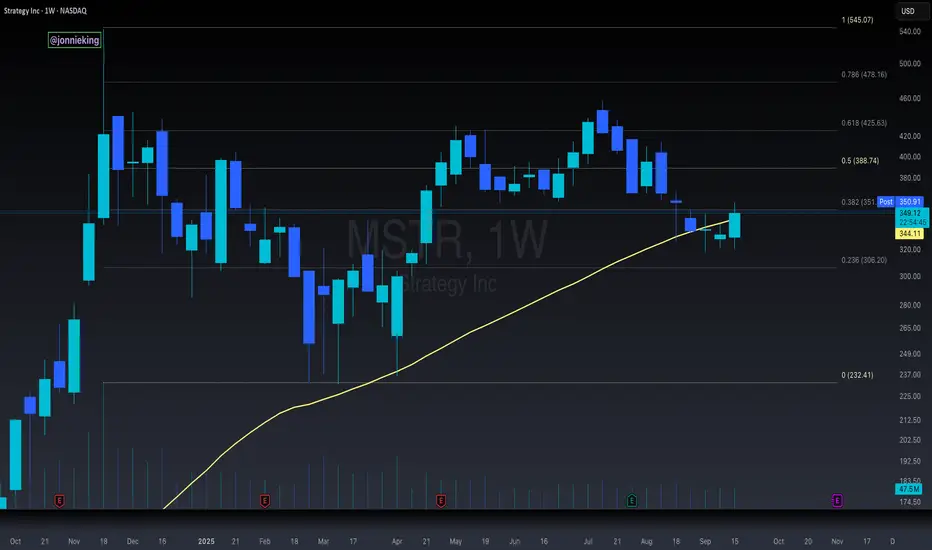
$MSTR Must Close This Week Above the 50WMA Or Else...The MicroStrategy chart is the only top signal that is somewhat cause for concern at the current moment.
You can see NASDAQ:MSTR has closed the past several weeks below the 50WMA, which signaled the start of the bear market last cycle.
Having said that, it has had a bullish rally this week and is trading above the 50WMA once again.
MSTR must close the week above this level, otherwise the stock could be in for a much deeper correction, which could negatively affect CRYPTOCAP:BTC in October.
Where have you heard that October prediction before?
Coincidence? 🥸
MSTR - Another Leading Diagonal 1-2 1-2 setupPOST FOMC hit my 78% retracement of another leading diagonal and has popped since. This looks like a decent 1-2 1-2 setup and good R/R. Hopefully see a wave 3 take off here in the next day or 2 and launch of a week or 2.

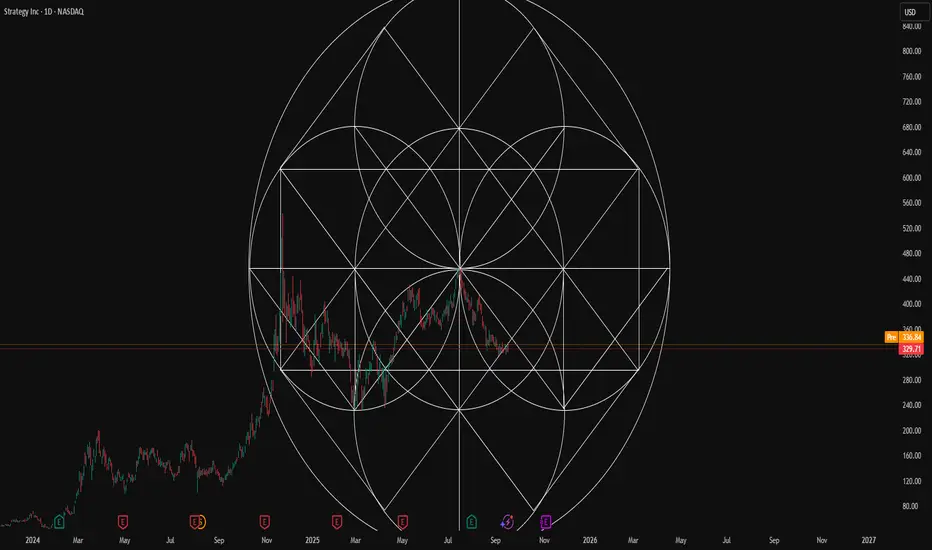
Strategy a Flower of Life patternHere's a forecasting structure for Strategy. Basically we want to watch for riding on top of lines rather than following them down. It will provide some key levels in space.
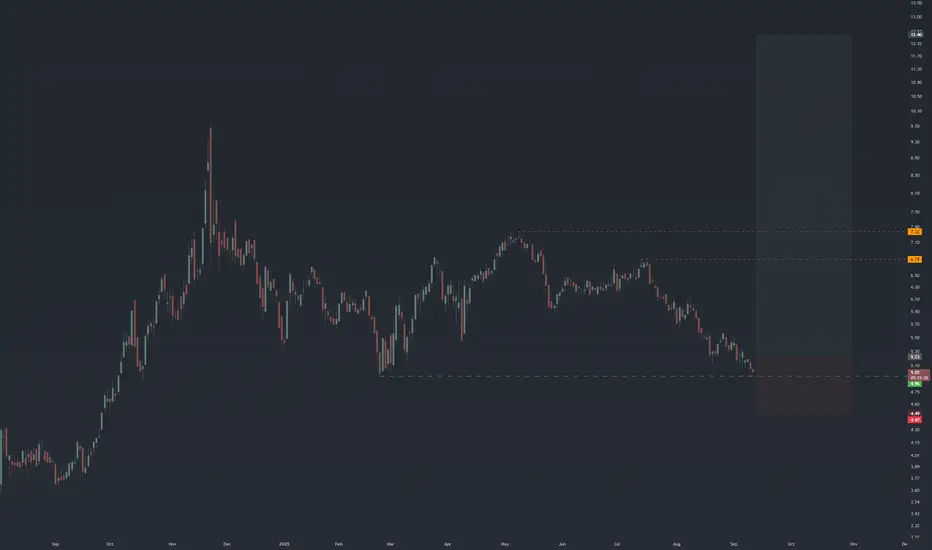
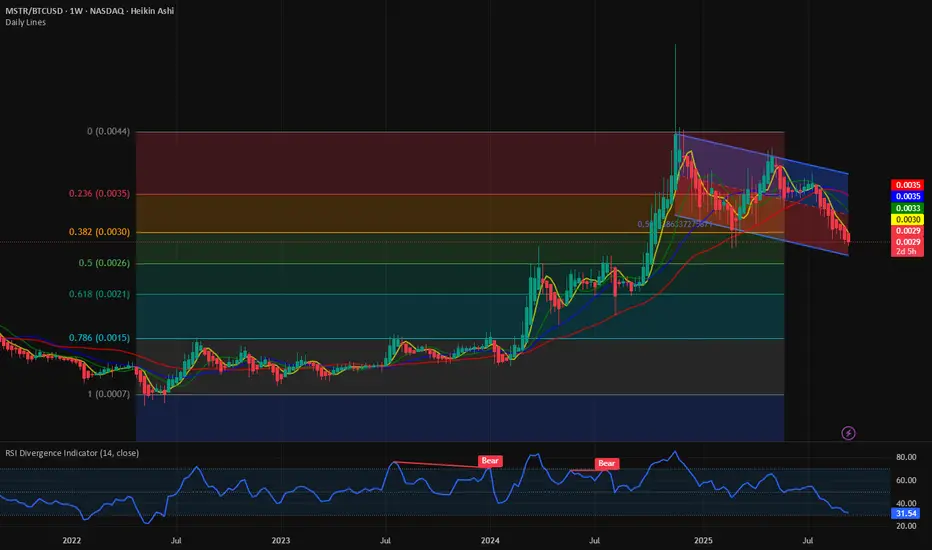
Is $MSTR only game in town? Charts seem to disagree. NASDAQ:MSTR was the first CRYPTOCAP:BTC treasury company in Wall Street. It provided the leverage required on the price by CRYPTOCAP:BTC by borrowing against its balance sheet and buying $BTC. This has worked well for Strategy as it was the only game in the town. But not anymore. With new Crypto treasury company coming to the public every single day and CRYPTOCAP:BTC treasury companies in abundance the attractiveness of NASDAQ:MSTR is decreasing.
In the chart below we check NASDAQ:MSTR stock price vs BITSTAMP:BTCUSD and see that it peaked in Nov 2024. Since then, it is a series of lower highs and lower lows. The downward sloping channel also makes things complicated for the stock in the mid-term. Just on the weekly there is some support in the chart between 0.0026 and 0.0021. This also happens to be between the 0.5 and 0.618 Fib retracement levels.
My assessment is we can see some support at 0.618 Fib levels but make no mistake if Crypto bear market comes in 2026 – 2027 then the ratio chart can visit the all-time lows of 0.0007.
Verdict: NASDAQ:MSTR / $ BITSTAMP:BTCUSD is in clear downturn. It can find support at 0.618 Fib retracement level. Ratio can visit the cycle lows of 0.0007.
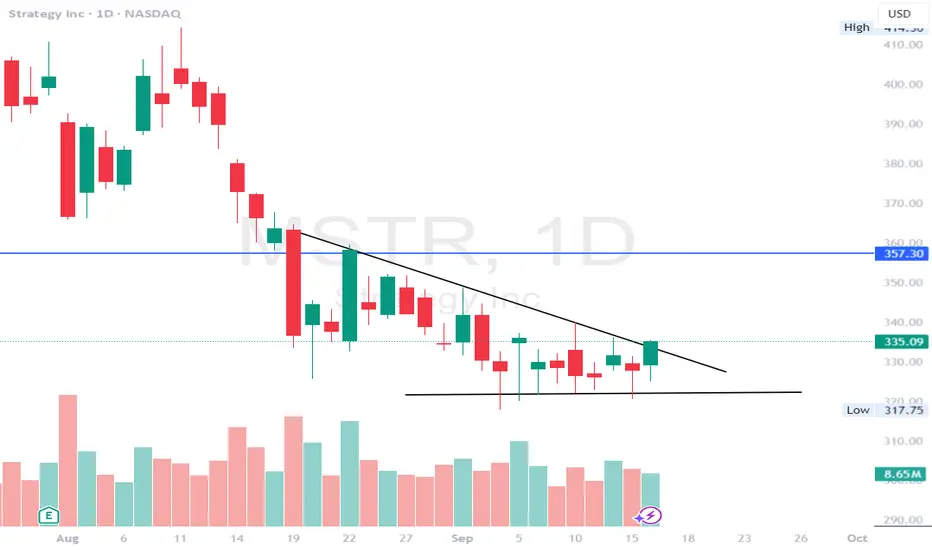
MSTR - pattern and downtrend breakoutMSTR - Stock held $320 support level multiple times and now breaking out of triangle pattern. Calls looking good as long as $335 holds for a move towards $350 and higher. Stock is decent at the indicator level. rate cut tomorrow could push the bitcoin and the stock higher.
Put sale on MSTR! I would love to own more down here. The 50 ema on weekly is an AMAZING support. Bitcoin is above and has reclaimed the 100 sma on the daily. Btcusd is UP YTD and MSTR is down / flat. I believe a shifting / rebalalancing will occur. Long down here

a megaphone over 500A good signal right on time was Powell saying he would change his monetary policy (he said he would adjust it). Then Bitcoin and all the equities hurt by the recent drops resumed the solid uptrend we’ve been seeing. They came back to consolidate technical levels and give us new highs. In the case of MSTR, we can see the formation of a megaphone pattern that could take us above 500 USD.

$MSTR trade to the upside? $375-395?NASDAQ:MSTR looks to be turning bullish here on small timeframes. We've broken out of the down trend line and look to be turning up for a move towards the resistances above.
I think we can potentially make it all the way up to $395 on this move to retest the area it broke down from.
However, that $375 area is also an area that can provide strong resistance.
Let's see how it plays out.

MSTR Long Setup at $320 Support — Targets Up to $455MicroStrategy NASDAQ:MSTR is trading at a critical support zone between $320 – $325. This area has historically attracted buyers, and with price consolidating at the lows, we’re eyeing a potential spot long entry if support holds.
📌 Trade Setup:
• Entry Zone: $320 – $325
• Take Profit Targets:
🥇 $360 – $390
🥈 $420 – $455
• Stop Loss: Just below $315
#MSTR #MicroStrategy #Stocks #TradingSetup #TechnicalAnalysis
#SupportZone #StockWatchlist #PriceAction
#SwingTrade #LongSetup #MarketAnalysis
MSTR ShortThe broader market structure on MSTR is currently bearish, with price making lower highs and lower lows overall. The most recent Break of Structure (BOS) occurred around $337.71, confirming bearish continuation after price failed to sustain higher levels. This BOS suggests that sellers remain in control and a retest of lower demand zones is probable.
Looking at supply and demand, the nearest supply zone sits in the $335–338 range, from which price previously dropped sharply, showing strong selling pressure. Demand sits between $328–324, where buyers last stepped in with enough strength to produce a significant rally. The reaction at demand was solid but not impulsive enough to break through supply on the first attempt, suggesting the zone could weaken on another test.
Currently, price is approaching the supply zone and showing signs of exhaustion as it nears the 0.5 retracement level at $328.42. If price taps into this supply zone and rejects, we can expect a move back toward the mid-range demand zone around $328–324. The trade bias is bearish, with an expectation of a sell-off after supply is hit. A close above $338 would invalidate this bearish outlook and signal possible continuation to higher supply zones.
Momentum currently favors sellers, as the move into supply has been sharp but is beginning to slow, suggesting distribution. No strong bullish engulfing candles are present here, further supporting a likely rejection.

$MSTR Micro Strategy 🎯 Technical Setup:
Daily demand zone at ~$302-320 providing STRONG support
Break of structure (BOS) confirmed with rejection from demand
Perfect 1-2 Elliott Wave setup developing after correction
Target: 50% retracement minimum = $365+ (15%+ gain from current levels)
🚀 MicroStrategy BITCOIN BEAST:
Bitcoin Treasury King: 444,262 BTC worth $49+ billion in reserves
Saylor's Vision: World's largest corporate Bitcoin holder
Infinite Money Glitch: Issue convertible debt → Buy Bitcoin → Stock rises → Repeat
2.5x Bitcoin Leverage: MSTR moves 2.5x whatever Bitcoin does
💰 The Ultimate Bitcoin Play:
Pure Bitcoin Exposure: No mining costs, just pure BTC appreciation
Corporate Treasury Revolution: Leading the Bitcoin-as-reserve-asset movement
Institutional Gateway: Wall Street's favorite way to get Bitcoin exposure
Convertible Debt Machine: $42 billion raised to buy more Bitcoin
🎪 Why This Could Be EXPLOSIVE:
Demand Zone Bounce: $302-320 institutional accumulation zone holding
Bitcoin Catalyst: Any BTC move above $115K triggers MSTR mania
Wave 3 Setup: Most powerful Elliott Wave about to begin
Saylor Effect: Michael Saylor's Bitcoin evangelism driving adoption
Entry Strategy:
Current: $326 (bouncing perfectly off daily demand)
Confirmation: Above $340 with volume surge
Stop: Below $300 (demand zone violation)
Target 1: $365 (50% Fibonacci level)
Target 2: $450+ (if Bitcoin breaks $120K)
MSTR = Bitcoin on steroids at perfect technical entry! 🚀
MSTR Leading Diagonal to 78% retracementMy previous triangle idea didn't pan out but it looks to have changed to a leading diagonal and bounced perfectly off the 78% retracement of the diagonal. Hopefully see a very strong bounce over the next 2-3 sessions.
$MSTR undervalued in terms of $IBITThis is a ratio of NASDAQ:MSTR / NASDAQ:IBIT and the idea here is that NASDAQ:MSTR MicroStrategy is growing undervalued in terms of Bitcoin / NASDAQ:IBIT , and the ratio is about to take out an important low.
This seems like an ideal time to consider a buy on NASDAQ:MSTR if you believe the Bitcoin bull market is not yet over, as it has been in a trend of underperformance, and could quickly shift back to outperformance if the Bitcoin bull market gets back underway.
How you choose to trade this could take many forms, I mostly just wanted to raise awareness of the setup.