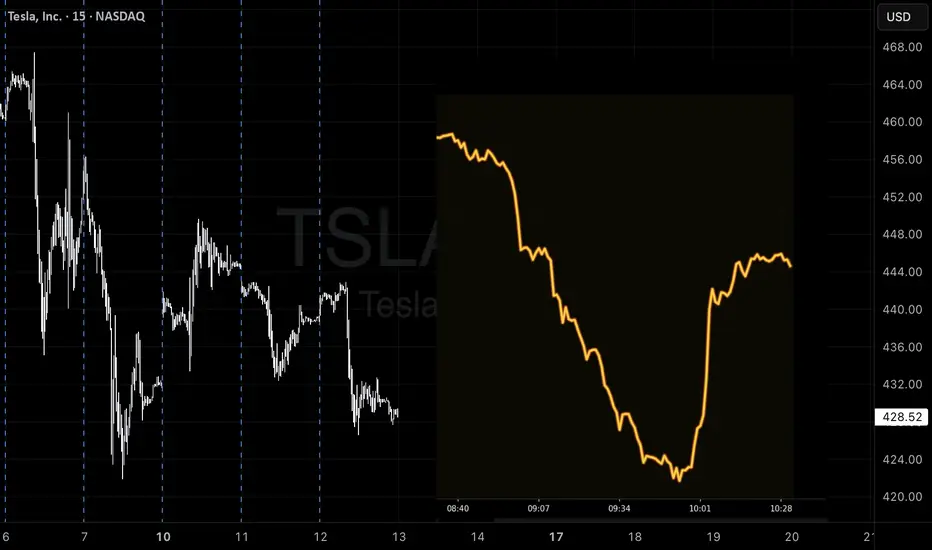
Tesla Wave Analysis – 13 November 2025
- Tesla broke support zone
- Likely to fall to support level 380.00,
Tesla recently broke the support zone between the support level 415.00 (which has been reversing the price from September) and the 38.2% Fibonacci correction of the upward impulse from September.
The breakout of this support zone strengthened the bearish pressure on Tesla accelerating the active impulse wave (iii).
Tesla can be expected to fall further to the next support level 380.00, which coincides with the daily up channel from April and the 61.8% Fibonacci correction of the upward impulse from September.
Trade ideas

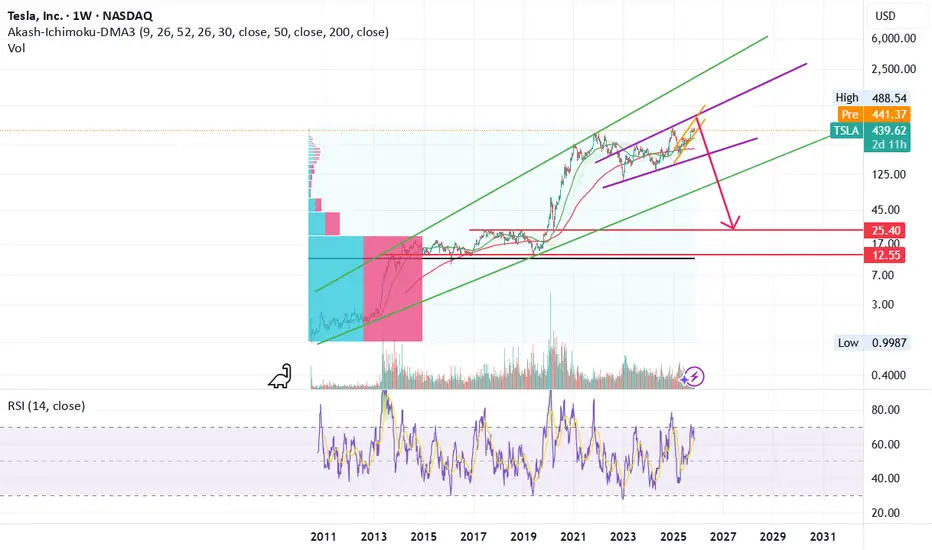
Tesla - The Bullish Path Is Clear... For Now.Hey Traders! It’s been a while since I posted about TSLA. This one isn’t an in-depth LTF breakdown — instead, we’re zooming out to identify the higher-timeframe targets and where price wants to go before any real continuation can happen.
The market runs on liquidity — and the less of it there is, the harder it is for price to move freely. Because TSLA carries so much liquidity and volatility, we don’t need the same slow, drawn-out liquidity builds that other stocks require. The swings are large and the algorithms respect because the liquidity is always there.
When we zoom out, the structure becomes clearer. The market consistently gives us signs before each major move — and on a higher-timeframe bullish Tesla, the price action is guided by white tapered selling, which acts as our roadmap for healthy continuation.
But here’s the nuance:
The higher up in timeframe we go, the more liquidity is required to sustain the next leg. That’s why we often see price digging deep into previously proven and broken algorithms before continuing higher. It’s not randomness — it’s the market refueling for expansion.
The path is pretty clear ahead for TSLA that we'll need to take advantage of HTF algorithms in order to break out of a much HTF liquidity structure.
Happy Trading:)

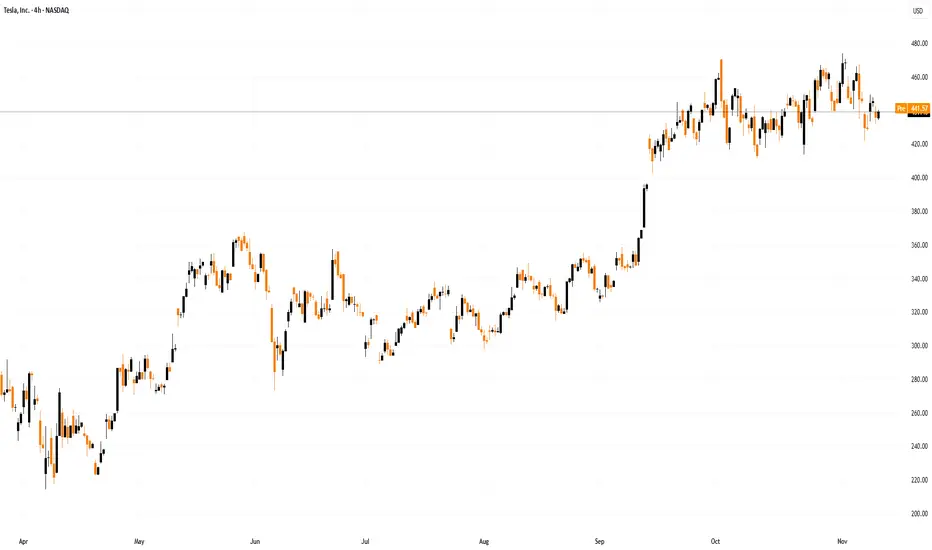
What's happening at Tesla!!I think Tesla should reach a price range of about $50 cheaper than the current price along the box drawn in the chart!

TESLA Bearish Breakout! Sell!
Hello,Traders!
TESLA broke below a key horizontal structure, confirming a bearish breakout. SMC perspective suggests smart money could drive price to mitigate inefficiency near $375 support zone. Time Frame 12H.
Sell!
Comment and subscribe to help us grow!
Check out other forecasts below too!
Disclosure: I am part of Trade Nation's Influencer program and receive a monthly fee for using their TradingView charts in my analysis.

TSLA In Trouble! WARNING!🚫 Why No One Should Be Holding TSLA Right Now
Charting:
Triple Top! Rising wedge fully formed 3-wave rising wedge structure that has hooked and broken! mini double top.
I’ve been saying this for a while — no one should be long TSLA. The stock has done nothing since 2021, yet the hype machine for the boy band keeps spinning.
Ask yourself honestly: Where does Tesla actually lead anymore?
Not in EVs
Not in autonomy
Not in robots
Not in AI
Not in tech innovation
It’s become a stock story with no story left.
And when leadership is built on hype, not execution, it always ends the same way.
Never invest in toxic leadership or cult narratives.
TSLA is a real company, sure — but in fundamental terms, it’s an $8 stock wearing a $450 costume.
If you agree and sell, and it's wrong. Guess what? You will have a bunch of cash waiting to buy it. If you disagree, you won't have a bunch of cash waiting to buy lower BC YOU NEVER SOLD! You can't "BUY THE DIP" Ubless you first SELL THE RIP! It's 2nd-grade math that the boy band who will come in here hating on my call again cannot do. They will give me colorful charts, tell me about cup and handles while riding it all the way down!
They are always buying but NEVER selling. That's the trick with paper money, you can never run out of it. hahah!
Click boost, follow, comment nicely for more authentic, no BS, raw analysis. Let's get to 6,000 followers. ))
$TSLA double top neckline breakoutNASDAQ:TSLA double top neckline gave way, could be sending price toward the 𝗺𝗮𝗷𝗼𝗿 𝘀𝘂𝗽𝗽𝗼𝗿𝘁 𝘇𝗼𝗻𝗲 𝘀𝗶𝘁𝘁𝗶𝗻𝗴 𝗶𝗻 𝘁𝗵𝗲 𝟯𝟱𝟬–𝟯𝟳𝟬 𝗿𝗮𝗻𝗴𝗲. That area has been a key battleground, and it’s where bulls will need to dig in if they want to stop the slide.
Until that support is tested, this chart is telling a story of weakness after a failed attempt to push higher.
If the support zone holds, the reversal could be powerful. If it doesn’t, the next chapter could get rough.

Tesla at a DiscountJamie Dimon said the future economy is going to be worth hundreds of trillions, and honestly that’s how I’m looking at Tesla right now. This feels like the discount phase before we go into 2026. If the whole economy is about to expand like that, Tesla’s AI, robotics, and energy side are going to be way more valuable than what the market is pricing in today. This is the type of level.
#TSLA Analysis, Elon breaks the Key level ^.^^Elon pours Big Money $$$ into TSLA stock recently causing Rally!
Price has gone up significantly, I don't think it will drop below $400 any time soon.
Strong Greenbar breaks out from the wedge with large volume increases.
Short sellers are getting squeeze out.
More investors are coming to catch smokey train.
Price Target next $480.
Come and join the Rally.
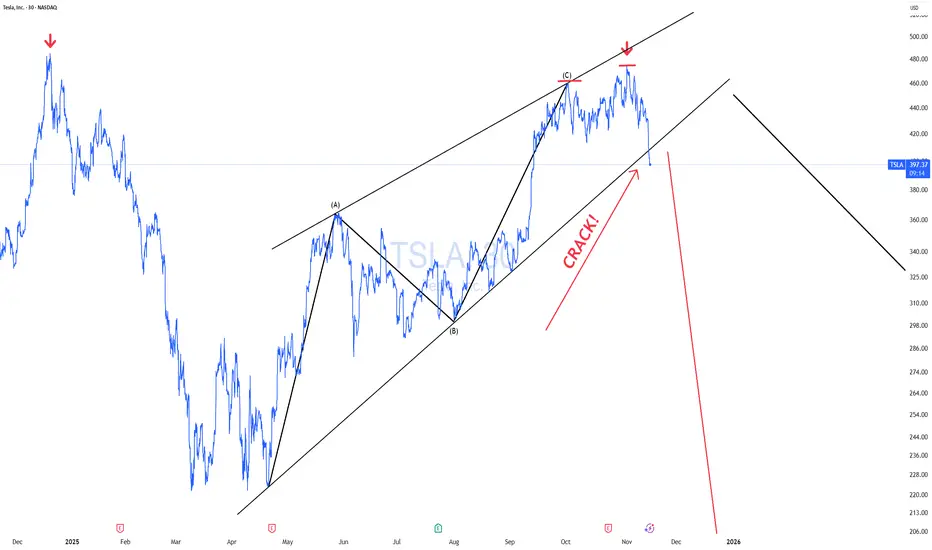
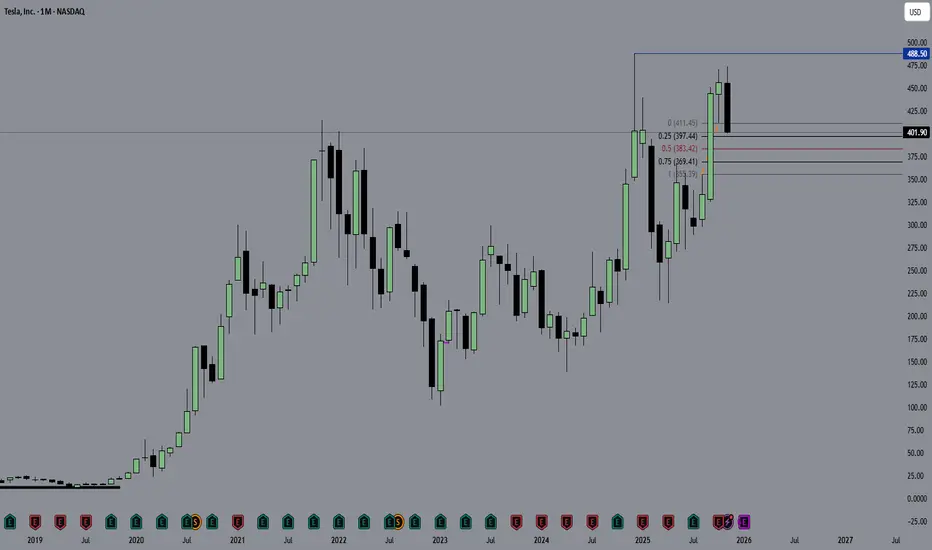
TSLA Short: Completion of Wave BOver in this lengthy video, I shared the big picture of TSLA Elliott Wave counts on a Cycle level using logarithmic chart and showed that it has peaked since Dec 2024. The subsequent move down till Apr 2025 is a Wave A and the move up to 3th Nov is actually the completed wave B. Wave C down is in progress and the ultimate target is $198.66, or if you are more conservative, $200. The stop loss is above the top of wave B.
Good luck!

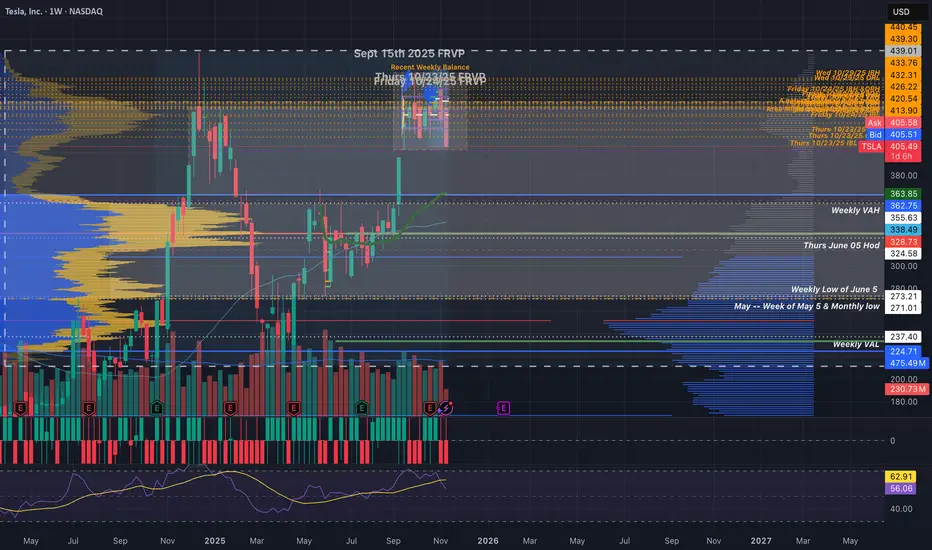
Tesla Macro Chart - Monitor PA @ Gap and Box midpointWatching to see what happens to tesla at the daily gap below and the box midpoint.
Again there could be a look below and fail of the pictured inner box but the failure at the top of this box says that we should be heading lower.
If the gap fill happens and it continues past $384, things could get musky.
Fresh Daily Tesla ChartSharing my very messy Tesla chart.
Still watching for that $384 and $314 if we push past that daily gap.
The box midpoint(384) of my tesla Macrochart is the decision point to me.
Could still get a look below and fail of the boxes or a gap fill and reversal.
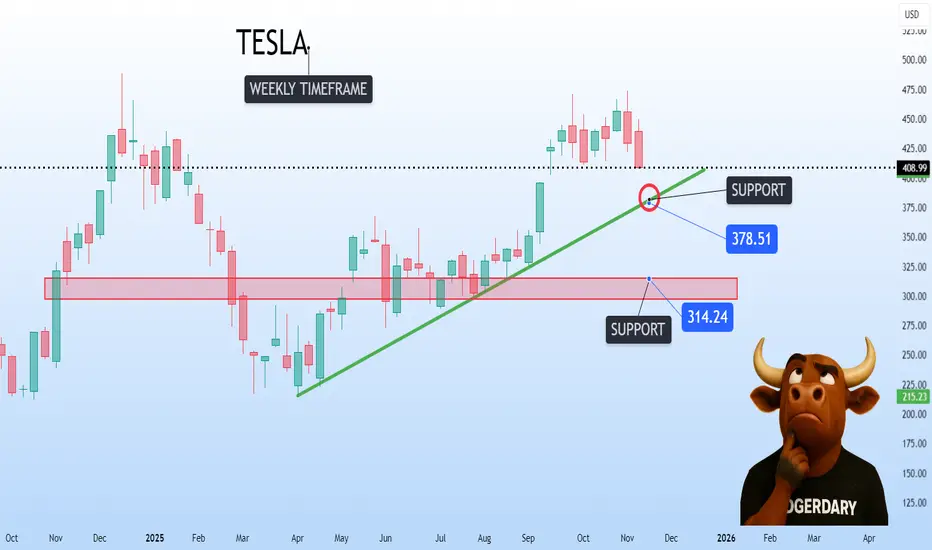
$TSLA could be pulling back right into 𝘀𝘂𝗽𝗽𝗼𝗿𝘁 NASDAQ:TSLA could be pulling back right into a major 𝘀𝘂𝗽𝗽𝗼𝗿𝘁 𝘇𝗼𝗻𝗲 𝗼𝗻 𝘁𝗵𝗲 𝘄𝗲𝗲𝗸𝗹𝘆 𝗰𝗵𝗮𝗿𝘁 𝗮𝗿𝗼𝘂𝗻𝗱 $𝟯𝟴𝟬.
This is the kind of retest that often decides the next chapter. Hold this level, and the structure stays intact with room to rebuild momentum. 𝗟𝗼𝘀𝗲 𝗶𝘁, 𝗮𝗻𝗱 𝘁𝗵𝗲 𝗱𝗼𝗼𝗿 𝗼𝗽𝗲𝗻𝘀 𝘁𝗼𝘄𝗮𝗿𝗱 𝘁𝗵𝗲 𝗹𝗼𝘄𝗲𝗿 𝘀𝘂𝗽𝗽𝗼𝗿𝘁 𝗻𝗲𝗮𝗿 𝟯𝟭𝟱.
TESLA Long SqueezeTesla has been trading within a sideways range but has recently broken down below it. Following some intriguing options data suggesting a potential positive gamma move above $450, many market participants may have become overly optimistic and begun anticipating new all-time highs.
However, at its current price level, Tesla appears to be in a danger zone. The recent rally lacks well-developed price action, indicating weak support until around $370. In that region, I have identified several VWAPs marking volume-weighted support areas, as well as the value area low from the volume profile of the previous trading range.
These zones align well with a potential support/resistance flip of the initial Wave 1 structure, and I’ll be watching for a possible Wave 4 low to form in this area.
According to Elliott Wave Theory, if Wave 4 falls below the highs of Wave 1, the structure is no longer considered impulsive and instead becomes corrective. This would increase the probability of Tesla’s price retracing toward previous lows—potentially dipping below $300 once again.
I plan to set alerts and monitor this zone closely for a possible long setup.

Tesla at a Crossroad: Can the $410 Support Hold Before the Next Tesla’s price is currently consolidating below the $450–$460 resistance zone after failing to sustain its recent breakout. This area has previously acted as a strong supply zone, and the latest rejection suggests that short-term momentum has weakened.
If buyers manage to defend the $410–$420 demand area (highlighted in green), a rebound could occur, potentially leading to a retest of $460 and a further continuation toward $500 and $550 in the midterm. This bullish scenario would require strong buying volume and confirmation of higher lows forming on the daily timeframe.
However, if the price breaks below the $410 support, it could trigger a deeper pullback toward the $350–$360 demand zone — a level that coincides with previous accumulation before the last rally. A loss of this zone may open the path toward $300 in an extended bearish case.
Bias: Neutral-to-Bullish above $410; Bearish below $410.

Stop Overcomplicating Trading: The Consistency Blueprint No One Stop Overcomplicating Trading: The Consistency Blueprint Nobody Wants to Talk About
Two decades in the market have taught me a very real truth:
Profit isn’t about being the smartest or catching the breakout. It’s about showing up for yourself every week; especially when motivation disappears and the trades get hard.
I’ve been at this 20 years; through bull runs, ugly drawdowns, burnout, and those quiet Sunday reviews where nothing made sense. The only thing that’s kept me in the game and steadily profitable? Building ultra-simple consistency habits that actually fit my life.
Let me give it to you straight: here’s how to move the needle, no matter where you are:
Forget perfection. Track what REALLY matters.
For most, it’s not a magic strategy—often it’s reviewing trades, keeping promises to yourself, and taking care of your brain and sleep before the next setup.
Pick 2-3 metrics and make them sacred:
For me, it’s weekly trade review, a “focus” score for my setups, and legit sleep tracking. I only look at these, period.
Make review time non-negotiable:
I set aside 20 min a week, never skipped. It’s my reset button after wins and losses.
Write out quick wins & lessons—immediately after they happen.
Let the good trades teach you, but also let the ugly ones humble you and anchor your next week.
Adapt your process to real life:
Swing trading while working? Happens. Family? Kids? You can STILL win long-term—just make the review and tracking match your schedule, not some internet hustle template.
Build the feedback loop
When you slip, note it fast and tweak (don’t obsess). When you nail it, reward yourself—not with risk, but acknowledgment.
How do you know it works? Because it’s kept me in profit while teaching hundreds of traders to turn routines into actual results.
If you’re battling for consistency DM me “Tools” or drop it in the comments. I’ll send my simple routines that changed the game for me and dozens of traders.
Let’s build consistency that lasts and celebrate small wins relentlessly.
If I can help, I will.
TSLA Coiling Inside a Gamma Cage: Major Break Imminent Nov 12-15Some stocks move with momentum.
TSLA moves with intention.
Over the last week, TSLA has been compressing inside a tightening structure — the candles look quiet, but the pressure underneath is anything but calm. When you dig deeper, it becomes obvious that this slow, controlled drift is not caused by buyers or sellers alone… it’s caused by GEX compression.
TSLA is sitting in one of the cleanest gamma setups of the month — and when it breaks, it will not be a small move.
This is the story.
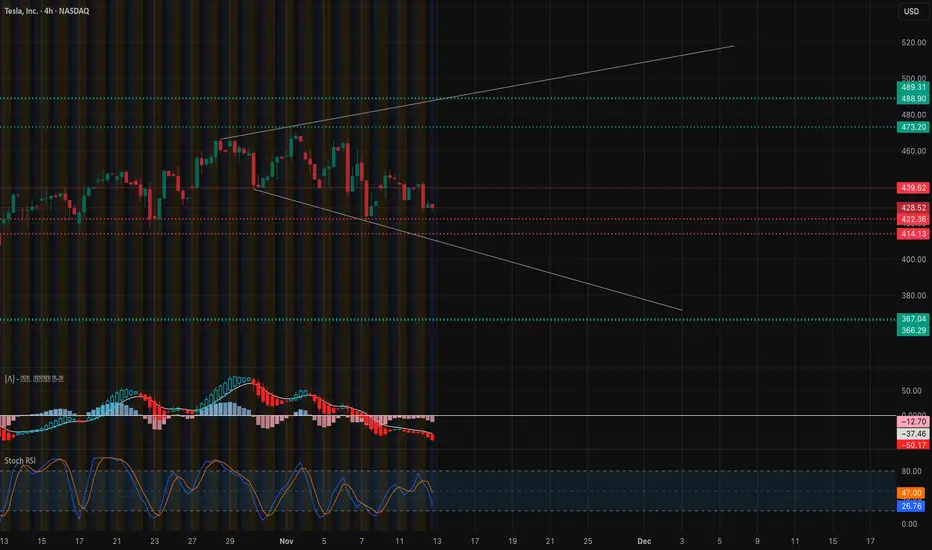
4H Chart — The Wedge of Indecision Meets Hidden Liquidity
TSLA has been moving within a narrowing wedge, with every bounce and rejection happening at nearly perfect structural zones:
* Strong CHoCH and BOS levels from late October
* Major liquidity sweeps around 430–435
* A rising lower trendline that keeps defending price
* A tightening upper trendline blocking upside around 455–460
But here’s the key:
TSLA is reacting EXACTLY where GEX shifts from neutral to positive.
The 4H wedge isn’t just a shape — it’s the visual footprint of gamma pressure tightening around price.
Every time TSLA taps the wedge boundaries, hedging flows change.
That’s why TSLA hasn’t broken yet — the gamma cage is holding it.
1H Chart — A Slow Grind That Hides Big Tension
On the 1H chart, TSLA is trading inside a narrow band between:
* 435–440 (light resistance)
* 425–428 (light support)
This is a neutral GEX pocket, where:
* Volatility decreases
* Movement becomes mechanical
* Price drifts instead of trending
* Candles look clean but lack conviction
This is exactly the kind of price action that precedes explosive resolution — because gamma is absorbing volatility until it can’t anymore.
GEX Data — The REAL TSLA Battlefield
This is where TSLA’s entire setup becomes crystal clear.
🔹 A massive positive GEX wall sits at 450–455
This is THE key magnet above current price.
If TSLA moves into this zone, hedging flows slow the move but support upward continuation.
This is why TSLA always struggles near 450 — it’s a gamma ceiling.
🔹 Neutral GEX zone between 425–440
This is where TSLA is stuck now.
This pocket absorbs volatility → price chops.
This is the “gamma cage.”
🔹 Heavy negative GEX zone at 420–421 and below
This is the danger zone.
Below 421, dealers must hedge aggressively → downside acceleration.
If TSLA loses 421–425, the fall can be fast.
🔥 Trading Suggestions Based on Structure + GEX
📌 Bullish Breakout Play (Higher Probability Above 440)
TSLA needs to reclaim 438–440 with strength.
ENTRY:
438–440 reclaim (1H strong green candle, sweep + rejection)
TARGETS:
* 445 (first gamma magnet)
* 450 (GEX wall)
* 455 (highest positive NET GEX shelf)
* 460 (upper wedge target)
STOP-LOSS:
Below 431
WHY IT WORKS:
Once TSLA enters the 445–455 zone, positive GEX supports a controlled uptrend, guiding price toward call-heavy areas.
📌 Bearish Breakdown Play (If TSLA Loses 425)
This is the sharp-move scenario.
ENTRY:
Break and back-test below 425
TARGETS:
* 421 (first negative GEX shelf)
* 415 (deep negative gamma)
* 405–410 (liquidity pocket)
STOP-LOSS:
Above 432
WHY IT WORKS:
Under 425, TSLA enters a negative GEX field, where hedging accelerates downward moves dramatically.
🔥 Options Trading Suggestions (GEX-Based)
📌 Bullish Options Play
If TSLA reclaims 440+:
Buy:
TSLA 450C or 455C (1–2 weeks out)
Reason:
These contracts sit right on top of the positive GEX wall → bullish drift is supported.
Safer Play:
440/455 Call Debit Spread
Perfect for riding gamma-supported upside.
📌 Bearish Options Play
If TSLA breaks 425:
Buy:
TSLA 420P or 415P
Reason:
Once TSLA enters the negative GEX zone, price becomes slippery — puts expand FAST.
Safer Spread:
425/415 Put Debit Spread
📌 Neutral Play (if TSLA stays 425–440)
Sell Premium:
* Iron Condor
* Credit Spread
* Calendar Spread
* Short Strangle (advanced)
Neutral GEX pockets = volatility compression = easy seller’s market.
My Thought
TSLA is inside one of the clearest gamma cages we’ve seen all month. Price is being controlled — held tight between neutral pockets and major positive/negative GEX shelves.
This compression will not last long.
When TSLA escapes the 425–440 range, the move will be clean, decisive, and directional.
The map is simple:
* Above 440 → price drifts toward 450–455
* Below 425 → TSLA slides into negative gamma
* Inside 425–440 → chop, decay, and indecision
GEX has already drawn the roadmap — price is simply waiting for the signal.
This outlook is for educational purposes only and not financial advice. Always manage your risk and trade your plan.
TSLA 1M AI Prediction📊 TSLA 1M AI Prediction – 2025-11-12
Current Price: $442.35
Trend: Neutral
Confidence: 55%
Volatility: 14.7%
Trade Signal:
Direction: Short
Entry Price: $442.35
Target: $440.50 (-0.52%)
Stop Loss: $448.99
Expected Move: -0.52%
30min Target: $440.31 (-0.46%)
Insight:
Katy AI predicts a small downward move in the short term
Low-moderate confidence; trade with proper risk management
Market trend is neutral, so position sizing should remain cautious
TSLA Plunging? The Fake Rebound Before the Real Crash!Tesla (TSLA) is entering a challenging phase as a wave of negative news hits from both fundamental and technical sides. Sales in China — Tesla’s second-largest market — have dropped to their lowest level in three years , sparking fears that real demand for EVs is cooling. At the same time, Elon Musk’s massive $1 trillion compensation package has raised concerns among investors who believe Tesla’s current valuation far exceeds its actual profit potential.
On the daily chart, TSLA is showing clear signs of weakness after an extended uptrend. The price is now testing the medium-term ascending trendline around the $430 zone . If buying pressure fails to hold this level, there’s a strong chance the price will break the trendline and enter a deeper correction phase .
In the short term, Tesla could continue to drop toward the $400 area , where strong support and the Ichimoku cloud base converge. Any rebounds, especially near the $450 resistance zone, should be viewed as opportunities for sellers to re-enter rather than signs of recovery.

Tesla - Here comes the third breakout!🚀Tesla ( NASDAQ:TSLA ) is finally breaking out:
🔎Analysis summary:
For the past four years, Tesla has been trading in a very clear ascending triangle pattern. But just last month, we finally saw the expected bullish triangle breakout. Considering all of the previous triangle breakouts, Tesla is setting up for another parabolic rally soon.
📝Levels to watch:
$450
SwingTraderPhil
SwingTrading.Simplified. | Investing.Simplified. | #LONGTERMVISION

TSLA - Update (Log)It has a date with the top rail of the orange bull flag (500 to 600 USD)
then down down downnnnn
Not financial advice
But I look forward to seeing where this low lands, as that could form the bull channel that looks to the future!
Musk Could Earn a Trillion: How Are Tesla (TSLA) Shares ReactingMusk Could Earn a Trillion: How Are Tesla (TSLA) Shares Reacting?
According to media reports, earlier this month Tesla shareholders approved a new 10-year compensation package for Elon Musk worth up to $1 trillion. But is this good or bad news for TSLA shares?
→ On the plus side, Musk is now firmly “tied” to the company and highly motivated to achieve extraordinary goals — such as reaching a market capitalisation of $8.5 trillion and launching mass production of Optimus robots.
→ On the downside, the price of this decision could be high. The targets appear almost fantastical, and their achievement would mean dilution of existing shareholders’ stakes through the issuance of new options.
As a result, Tesla’s share price has been fluctuating, reflecting market indecision and consolidating after the news. A closer look at the TSLA chart offers clues as to what may happen next.
Technical Analysis of TSLA
From a bullish perspective, Tesla’s share price remains within an upward-sloping trend channel, where:
→ the median line is showing signs of acting as support;
→ the sharp rally in September formed a demand zone, where an imbalance between buyers and sellers triggered a strong move higher — the upper boundary of this channel, around the psychological $400 mark, could act as a support level going forward.
From a bearish point of view, the key barrier remains the current all-time high, which continues to cap the ongoing rally (roughly +100% from this year’s low).
Given these factors, it is reasonable to assume that TSLA is currently in a consolidation phase. The situation could eventually resolve in favour of the bulls if the price holds the lower boundary of the channel — as seen previously, when a similar consolidation period preceded a breakout above the $360 resistance level.
This article represents the opinion of the Companies operating under the FXOpen brand only. It is not to be construed as an offer, solicitation, or recommendation with respect to products and services provided by the Companies operating under the FXOpen brand, nor is it to be considered financial advice.
tesla is bulish ...Two bullish scenarios are conceivable for Tesla: 1. A return to the broken level and a price pump 2. A move upwards without a return due to the intense buying pressure resulting from hitting the strong demand level.
lets see ....

TESLA BIG SELL PROBABILITY SETUP SOON!!!🚨 TESLA HIGH PROBABILITY SELL SETUP 🚨
* Here We Can See Clearly The Next Potential Moves For TSLA Coming Hours/Days.
* Keep Your Eyes Close On Your Trading Positions.
* Happy PIP Hunting Traders.
FXKILLA.
