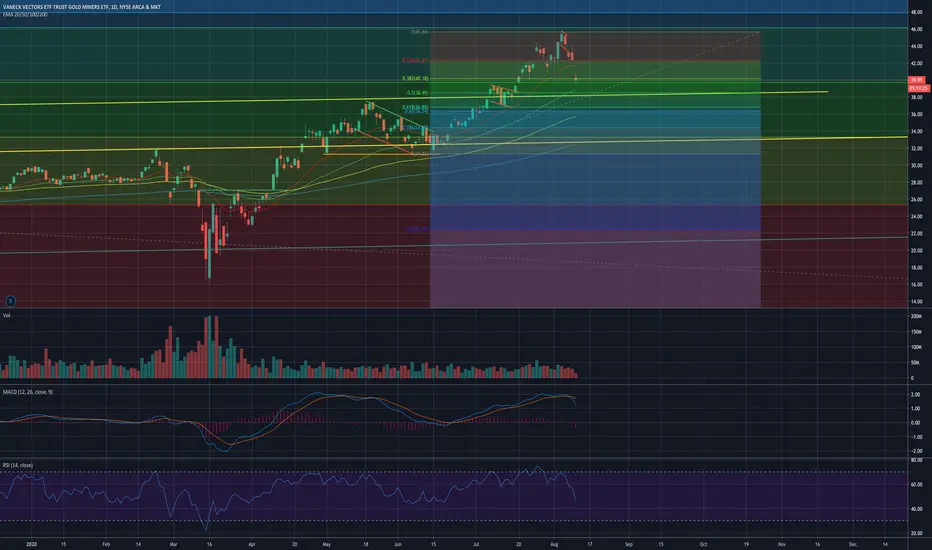
Gold Miner ETF Pulls Back but the Trend Seems IntactGold and silver have been explosive recently as the U.S. dollar slides and the Federal Reserve keeps interest rates low. The Market Vectors Gold Miners ETF pulled back between August 6-11, not a surprise given the pace of its rally. But the trend remained intact and now momentum followers may be active.
Last week’s retreat landed GDX back around the July 9 peaks, which briefly offered resistance before the ETF broke out to new seven-year highs.
The candlesticks on August 11 and 12 are also interesting. Both looked bearish on the surface because GDX closed at the lows. However the second day formed an inside bar. It’s similar (not exactly) to a morning star pattern, with short-term bearishness exhausting itself at a key support level.
Meanwhile, stochastics showed deeply oversold conditions at the same time.
GDX leaped yesterday. It tried to jump again this morning, but the bulls were too eager. Profit-takers drove it down early but they did no damage to the bullish trend. Now buyers are defending the 20-day simple moving average (SMA).
Finally, currency markets support the strength in precious metals, with the U.S. Dollar Index hitting a new two-year low today.
VEF5 trade ideas

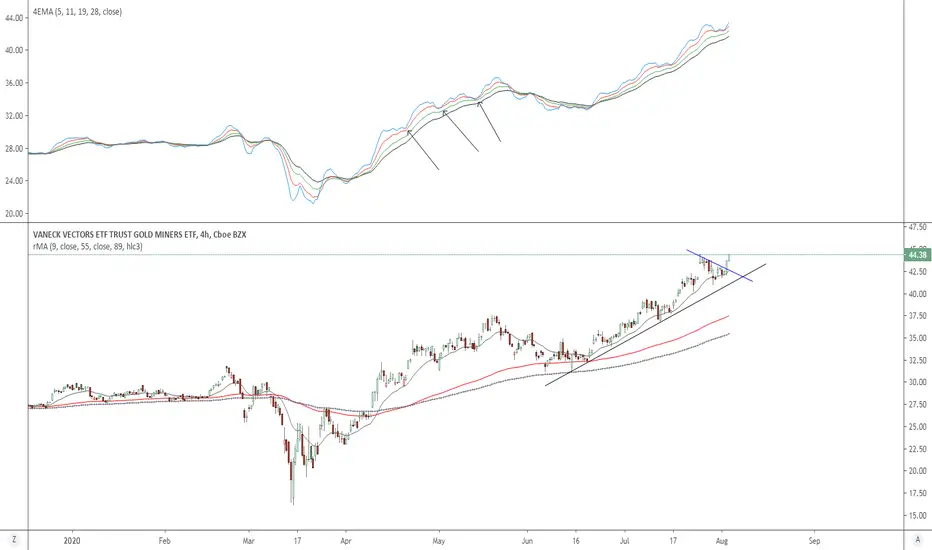
Elliott Wave View: Gold Miners (GDX) Ready to Resume HigherGDX 45 minutes chart below shows that the stock has ended the cycle from June 5 low as wave (3). The rally ended at 45.78 high. From there, the stock did a pullback in wave (4), which unfolded as a zigzag Elliott Wave Structure. Down from August 5 high, wave A ended at 42.25 low. The bounce in wave B ended at 44.18 high. Afterwards, the stock resumed lower in wave C, which ended at 38.82 low. This ended wave (4) in larger degree.
Afterwards, the stock has resumed higher from wave (4) low. Up from that low, the stock ended wave ((i)) at 40.69 high. Wave ((ii)) pullback ended at 39.05 low. Currently wave ((iii)) is in progress, where wave (i) of ((iii)) ended at 41.03 high and wave (ii) ended at 39.72 low. As long as pivot at 38.82 low stays intact, the dips in 3,7 or 11 swings is expected to find support for more upside. However, the stock still needs to break above wave (3) high at 45.78 to confirm that wave (4) is already in place and the next leg higher in wave (5) has started. Otherwise, the stock can still do a double correction in wave (4).


gdx/gldthe ratio showed stocks lagging gold. Maybe drop to channel bottom??? 1960 gold resistance line. Lots of warnings to get out. Robin hood traders gotta learn the hard way ! Twitter said buy, lol.


Buy The Dip Scenario...Easy way for gold exposure...Expecting gold to go a lil lower providing an opportunity to long something like this for more gains.

The gold reset we've been waiting forAgain, I am very bullish for gold long-term but things were getting crazy. Too much distance between price and mean, too over-bought, and (of course) the parabolic shape GLD and SLV began taking. Today is not a suprise and I expect the bleeding to continue. An amazing buying opportunity awaits us but we will need to be patient!!

GDX - levels!Looking for a break of 39.72 that should bring prices to the low 38's. If that area doesn't hold then $36.50 or so.
GDX Bullish to Bearish Reversal IdeaWatching for a repeat of the Feb to March GDX price action - 20 percent drop followed by retrace capped with head and shoulders pattern, followed with a much larger drop.

Gold Miners on Cusp of Outperforming as Bull market beginsGold Miners remain historically attractive relative price of gold. GDX should outperform gold as the bull market continues with next target ratio of .03.

Gdx is a long term winnerForget about the noise, we are in a multiyear gold bull market.
Few people realize how big this gold bull run can be:
- No alternative assets as fixed income is yielding negative rates and central banks can not increase them or everything will fall apart. Just bitcoin could compete with gold but it is a much smaller market.
- All countries have huge amount of debts impossible to repay (US, Europe, China, Japan, Emerging).
- dollar collapsing
- a reform of the monetary and financial system in the coming years.
- new players buying gold (pension funds)
- current gold market cap is 2 trillion vs equity 100 trillion, which is 2%. If investors start including gold in their portfolios, just a 5% would double the price, a 10% would 5x. Gold can go to 4000$ easily. Miners would be more profitable than tech and Gdx achieving 140-150$ in this scenario is even conservative.
- shake out in march confirms this multiyear market and strong hands will want to 5x or 10x their bet in the coming years. Observe this shake out is pretty similar to that of 2009, but just look at how huge volume is this time, meaning bull run will be much bigger.
- 2023-2024 is the timeframe for gdx going to 120-140$. Thats 3x from current levels without leverage.
Expect volatility in the coming months and buy on every pullback. I expect a pullback to 39-40$ level in September, but could go as low as 36$ if dollar gets stronger. Accumulate at those levels.

First Fibonacci retracement testIf this is really the long awaited bully run on gold (and GDX)... today should hold strong.

[Study] Miners UnderperformingToday is quite wild with SLV +4%, GLD +1%, but Gold miners generally down and sucking.
I actually remember the same situation happening just before the COVID crash and it seems I can illustrate it with this chart.
It's hard to believe miners can be so weak with Gold so strong above $2000. They have amazing fundamentals here.
But the tape is what it is. I would be very careful here. I am doing so by favoring long dated calls and limited sizing.

Long gold miners Seasonality will take prices to 45$ by the end of August.
Expect pullback to 41$ by September for the same reason.
US elections, COVID, and year end seasonality will take the price to 52$

GDX MNT: V-shape recovery / 40% upside BUY/HOLD(STOCKS/ETFs)Why get subbed to to me on Tradingview?
-TOP author on TradingView
-15+ years experience in markets
-Professional chart break downs
-Supply/Demand Zones
-TD9 counts / combo review
-Key S/R levels
-No junk on my charts
-Frequent updates
-Covering FX/crypto/US stocks
-24/7 uptime so constant updates
GDX MNT: V-shape recovery / 70% upside BUY/HOLD(STOCKS)
IMPORTANT NOTE: speculative setup. do your own
due dill. use STOP LOSS. don't overleverage.
Gold is currently a strong bull market with more upside mid-term.
Also strong seasonal period, so I expect more gains
in August/September 2020.
Here's the technical overview of gold price, feel
free to recap:
🔸 Summary and potential trade setup
::: GDX monthly chart review and outlook
::: chart looks strong right now
::: gold clearly in bull market now
::: miners benefiting from rise in prices
::: V-shape recovery in pgogress
::: 60% through already however
::: 40% upside remains from here
::: recommended strategy: BUY/HOLD at market
::: TP +40% gains
::: setup for patient traders only
::: do not expect fast/overnight gains now
::: good luck traders
🔸 Supply/Demand Zones
::: supply/demand: N/A
🔸 Other noteworthy technicals/fundies
::: TD9/Combo update: N/A
::: Sentiment short-term: BULLS
::: Sentiment outlook mid-term: BULLS

𝗖𝗵𝗮𝗿𝘁 𝗼𝗳 𝘁𝗵𝗲 𝗠𝗼𝗻𝘁𝗵: $GDX Monthly. What a Move! Major breakout! Look to buy dip as sentiment too high 📈
$GLD $GC_F $GDXJ $SI_F $SLV $ES_F $SPX $VIX $NQ_F $QQQ $NDX $SOX $IWM $TLT $TNX $DXY #Gold


GDX and IBB review (IBB at decision point)both bullish, IBB at critical point - please follow, cheers, Rick


