USDOLLAR longI think there is a high probability that this is a wyckoff reversal pattern and some shorts are going to get squeezed for a bit. I don't think I will get married to this trade but for now it looks like a good contender to start off the week. I have a video on the wyckoff method on my youtube channel if you have any questions. www.youtube.com
Trade ideas

Techical and Fundamental analysis of traditional markets 32900-3030on the SPX has so far proven to be a strong area of resistance, but stocks are still on an uptrend. They are at a make or break stage in my opinion. Lots of people are losing their minds as stocks keep rallying, and even though I believe it is very likely that we see new ATHs on the SPX500 & NAS100... I am still of the opinion that eventually the rally will fail and roll over. It is all about understanding the structure of these products, markets and MONEY. For this reason it is better to play everything based on TA and not FA. FA is really blurry and there are many variables. (All my charts are below, including some ideas)
For now the printing press and retail optimism have been major reasons for this rally. Currently people believe Central banks have everything under control, which along with all the fresh money hitting the market and a 'buy the lockdown' (short squeeze). I don't believe they really do have everything under control and the issues are massive, but at the end of the day they want to step in and buy stocks... and they won't buy them 10% below ATHs. If the USD was pegged to gold, I'd expect an 80% correction from ATHs, but because it isn't... we might be lucky to get to 1600. Many stocks will fall 80% from their ATHs, but this doesn't mean indices will as most money is concentrated are certain stocks. Many companies will fail as they won't get a bailout and especially small to medium ones. This will have big effects on the market, but with bond yields going at 0 or below, and infinite money... it probably is better to buy Amazon or something like it that buy bonds ones they get there.
So I'd like to see the SPX500 cleanly break below 2840 and close below before thinking about shorting. On my other idea I have a clean chart of what I'd like to see to short. I was getting from neutral-bullish to neutral-bearish on the USD, but I am still confused. The reason is the DXY or DJI USD index still haven't truly broken down. EURUSD and GBPUSD went up yesterday, but the USD went up against every other pair so it is still confusing... I still believe the dollar has 2-3% room to fall but that it will resume its uptrend. For now I see it more as range bound with medium term bearish bias and long term bullish. I've been very clear on where my long term bias switches completely. One thing that is clear to me is that you can't be bearish the USD and bearish on equities. So far this has been quite clear, because if we get another down turn the dollar might go down initially along with yields (down)... but then it will most likely go much much higher.
As for oil I was wrong short term. I've been bearish for so long that I wasn't able to switch my bias. For now I think we are in a resistance zone, but there could be some upside. From my basic understanding of that market and how the hole thing works... is that oil is going much much lower. I am pretty certain it will hit 0 again, but I have no idea when. There isn't much more capacity, there isn't a way to force many cuts (eventually many will on their own), but the problems are massive and I think demand over the next year will be down at least 30%. No idea how will they be able to cut 30% of global production and where they are going to store the oil if nobody wants to buy it while they can't stop taking it out of the ground.
As for Gold still stuck below the R3 yearly pivot and slowly breaking down. Could it be that the USD is about to resume its uptrend, while Gold and SPX break down? Of course it can be. Both SPX and Gold look fragile here, but their HFT structure is bullish, so I don't want to rush anything. Personally I prefer to play these stuff by going long the USD against EM currencies & oil shorts. At least that's where I put more weight. SPX and Gold have cleaner charts for entries and exits, but for shorts they are definitely sub optimal even if you increase the size. They also both benefit tremendously from money printing while EM currencies and oil don't (at least not as much)

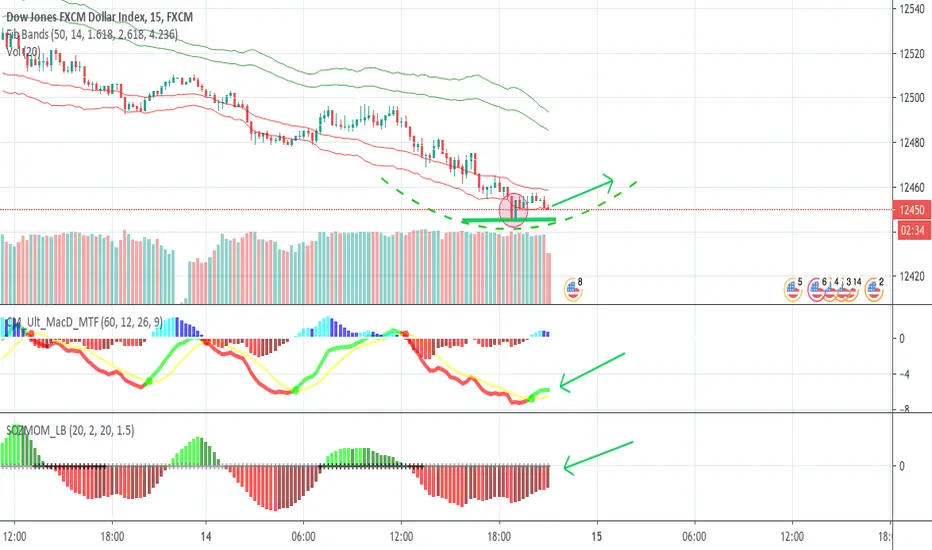
USDOLLAR Finds Support Ahead of Fed StatementThe left chart below shows FXCM's dollar index (USDOLLAR) on the daily time frame. It is below its black 20-day SMA and the SMA is pointing down. The RSI is also on the bearish side of 50 (blue rectangle). This after the Fed announced unlimited QE on 23rd March. However, we note that the index has found support around the 12,480 level (green rectangle). The right chart show's the hourly time frame. Here the EMAs have crossed bullishly and the hourly RSI has moved above 50 (red rectangles) as the greenback bulls defend the level. We note that at 6:00pm GMT that the Fed will release its statement and that 30 minutes afterwards, Fed Chair Powell will hold his press conference. This will very likely cause a spike in volatility and decide trend direction into the near to mid-term.

USDOLLAR Moves Into Risk-Off ModeFXCM's USD index, USDOLLAR, has moved into clear risk-off mode. The left chart shows the daily time frame. The index has rejected off of the black 20-day SMA and is moving down. Moreover, the SMA is starting to turn lower, whilst the RSI is also below 50 (blue rectangle) and is suggestive of a bearish momentum. The right chart shows the hourly time frame. Here, the EMAs have turned bearish (red rectangle) and the hourly RSI has crossed below 50 (green rectangle). The greenback is dropping as the Fed's unlimited QE policy takes hold, supporting the risk-on side of the market.

USDOLLAR Trades At Potential Tipping PointThe left charts show's FXCM's dollar index, the USDOLLAR, trading at its black 20-day SMA. The daily RSI is pushing above 50 (blue rectangle), which is suggestive that an underlying bullish momentum is developing. However, it will need to trader higher to cement this view - at current levels the buyers and sellers are in agreement. This is clearer on the right chart, which shows the hourly time frame. Here, we see that the USDOLLAR is trading in a sideways congestion pattern (red rectangle). In order for the index to break up and out, the hourly RSI will need to trade on the bullish side of 50 (green rectangle).

Dollah8 hour with wavetrend ,It's everywhere, under mattresses all over the planet. debt instruments for corporations and countries. Yup, nobody wants it or needs to use it. Lol

USDOLLAR Challenges 20-DAY SMA as Risk Aversion DominatesThe left chart shows FXCM's dollar index, USDOLLAR, challenging its black 20-day SMA. We note that, the RSI is looking to move to the bullish side of 50 (blue rectangle). If it does and the index pushes above the SMA, with the SMA turning up than risk-aversion is likely to dominate. The right chart shows the hourly time frame. Here, we can see that the EMAs are in bullish mode and the RSI is comfortably above 50. If the hourly holds these dynamics, we should see the greenback overcome the daily SMA resistance.

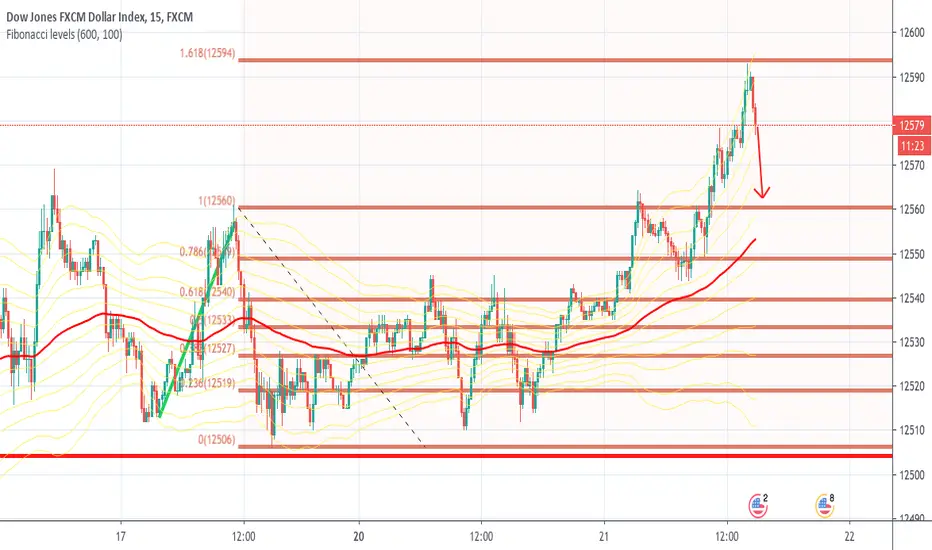
USDOLLAR ANALYSISUSDOLLAR IS RESPECTING THE FIBONACCI RETRACEMMENTS
___________________________________________________
**Disclaimer** the content on this analysis is subject to change at any time without notice, and is provided for the sole purpose of assisting traders to make independent investment decisions.
DXY looking Bullish, USDOLLAR looking Bearish?DISCLAIMER: Trading Forex involves risk and you may lose more money than you started with! These posts are not to be taken as trade recommendations or financial advice and I offer NO guarantee that any of these ideas will result in profit. Also, trade ideas may change, depending on ever-changing market conditions. You are trading at your own risk and past performance is NOT indicative of future results. Please, know how much you are willing to risk on EVERY trade that you take and be SMART!
Simplify your trading. Always measure your risk and be okay with being wrong ; ) Wait patiently and get the price that you want. Use the market. Don't let the market use you.

USDOLLAR Challenges Overhead Resistance on H1The left chart shows the daily time frame of FXCM's dollar index, USDOLLAR. The black 50-day SMA continues to hold as support and move upwards. However, the daily RSI is still to move above 50, which would be indicative of an underlying bullish momentum. The right chart shows the hourly time frame. Here, the EMAs are bullish (green ellipse) and the hourly RSI is on the bullish side of 50 (light green rectangle). The index is challenging overhead resistance around the 12,554 level (light red horizontal). A break above will be bullish for the greenback.


USDOLLAR Holds 50-Day Moving Average SupportThe left chart show's the daily chart of FXCM's dollar index, USDOLLAR. The instrument is holding support at the black 50-day moving average. The RSI is also looking to cross above 50, which is the bullish side of the oscillator. The right chart shows the hourly time frame. Here the RSI is already bullish and if the EMAs start moving upwards (green ellipse), the greenback is likely bid. If this is the case and the sentiment transfers to the daily time frame, the market will be moving towards a risk-off sentiment.


USDOLLAR INDEX (DOW JONES) ANALYSIS OF TODAYCHECK THE YESTERDAR"S USDOLLAR ANALYSIS.
________________________________________________________________________________________________________________
**Disclaimer** the content on this analysis is subject to change at any time without notice, and is provided for the sole purpose of assisting traders to make independent investment decisions.

US dollar indexThe same as I wrote for DXY but with this equally weighted index sell set-up is even more clear.

USDOLLAR ANALYSISUSDOLLAR WILL SHOW A SMALL INCREASE.
**Disclaimer** the content on this analysis is subject to change at any time without notice, and is provided for the sole purpose of assisting traders to make independent investment decisions.
U.S Dollar Currency Index (DXY)U.S Dollar Currency Index (DXY) - price breakout the neckline, that confirms a strength on USD currency, that will effect eur/usd and nzd/usd setups. Eur/Usd - price rejected the resistance level and breakout the neckline.

DOLLAR INDEXhello traders,
The analysis i have shared is the viewpoint of my side based on past historical data,mind you that things of the past cannot be replicated in the future, my speculation is that dollar is going to rise,
trade safe and use your own sentiment

US DOLLAR INDEX LONG TRADEUSD Dollar Index broke upper limit of bullish pennant pattern at level 12537
Price is based above HVN at level 12449 which indicates that dollar index is in accumulation phase
Above SMA 100 on H1 frame
MACD shows start of bullish momentum
It's expected more buying to level 12859
as a target of pennant pattern


