TRXUSDT The chart BINANCE:TRXUSDT was deep spike but this is exit seller from game and entry again byers. We can buy in supports (0.3330 to 0.3450) but for hold in.
Please control risk management for your trades.

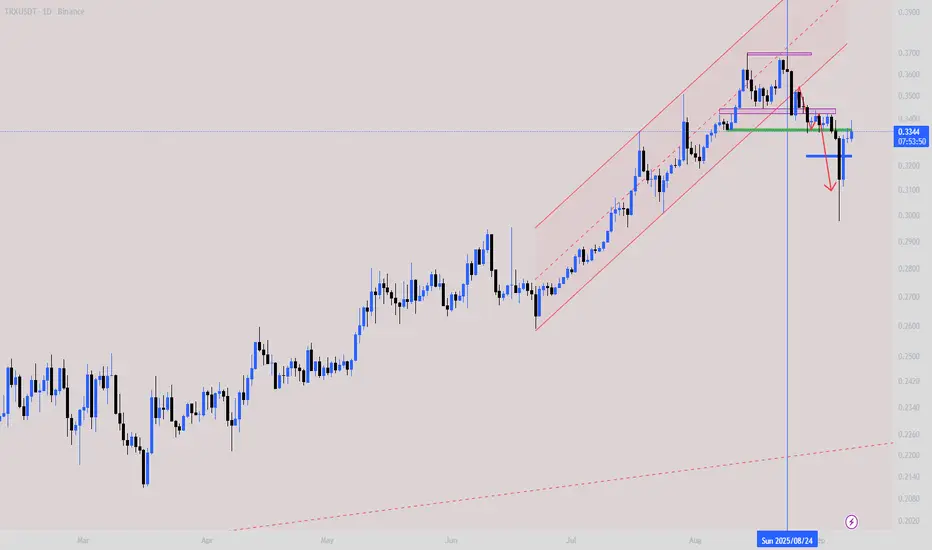
Troncoin short back to $0.34190Sl: 0.34964-0.35
Monitor for closure around $0.34385
Full exit at $0.34190

TRX/USDT Technical (1W Timeframe)Overall Trend:
TRX has clearly broken out of a long-term descending resistance line (bearish trendline) and has been in a sustained uptrend since.
The breakout was followed by a steady series of higher highs and higher lows, confirming bullish market structure.
The ascending black trendline is ho

Tron (TRX): Liquidity Sweep Restarted The Chart | BullishCRYPTOCAP:TRX had a quick liquidity sweep, but buyers stepped in aggressively and regained control of the zone. For now, momentum remains with the bulls, and our current target sits at $0.37. Once that level is reached, we will monitor price action closely
If resistance holds, a pullback is possib

TRXUSDT | Technical Outlook & Market ContextTRON (TRX) is one of the leading blockchain-based operating systems designed to decentralize the internet by enabling efficient smart contracts and high-throughput transactions. Known for its scalability and low-cost transfers, TRON continues to attract developers and users in the DeFi and entertain

TRXUSDT-4h-LONGThe red cycle appears to have completed around the recent peak in July-August, indicating a potential reversal point.
The price has approached the lower boundary of the ascending Fibonacci channel, which coincides with the completion of the red cycle.
The interaction at this support could lead to a

Troncoin long to $0.34376Just now opened a long position on troncoin
Aiming for $0.34376 area
Time sensitive
2-3RR

TRON Wave Analysis – 9 September 2025- TRON reversed from the round support level 0.3000
- Likely to rise to resistance level 0.3500
TRON cryptocurrency recently reversed up from the strong support zone between the round support level 0.3000 (which has been reversing the price from July, as can be seen below) and the 61.8% Fibonacci c

Result of previous analysisPrice targets for ADA, Arbitrum and Tron have been touched. You can see my analysis in previous Publish.
TRX: Justin Sun’s Play | September 08, 2025.Sergio Richi Premium ✅
CRYPTOCAP:TRX #Crypto #Tron 🪙 — TRX: Justin Sun’s Play | September 08, 2025.
Price (Sept 8, 2025) : $0.3323
Asset Overview:
Tron (TRX) is a high-throughput blockchain platform focused on decentralizing the internet through dApps, smart contracts, and content sharing

See all ideas
Summarizing what the indicators are suggesting.
Oscillators
Neutral
SellBuy
Strong sellStrong buy
Strong sellSellNeutralBuyStrong buy
Oscillators
Neutral
SellBuy
Strong sellStrong buy
Strong sellSellNeutralBuyStrong buy
Summary
Neutral
SellBuy
Strong sellStrong buy
Strong sellSellNeutralBuyStrong buy
Summary
Neutral
SellBuy
Strong sellStrong buy
Strong sellSellNeutralBuyStrong buy
Summary
Neutral
SellBuy
Strong sellStrong buy
Strong sellSellNeutralBuyStrong buy
Moving Averages
Neutral
SellBuy
Strong sellStrong buy
Strong sellSellNeutralBuyStrong buy
Moving Averages
Neutral
SellBuy
Strong sellStrong buy
Strong sellSellNeutralBuyStrong buy
Displays a symbol's price movements over previous years to identify recurring trends.