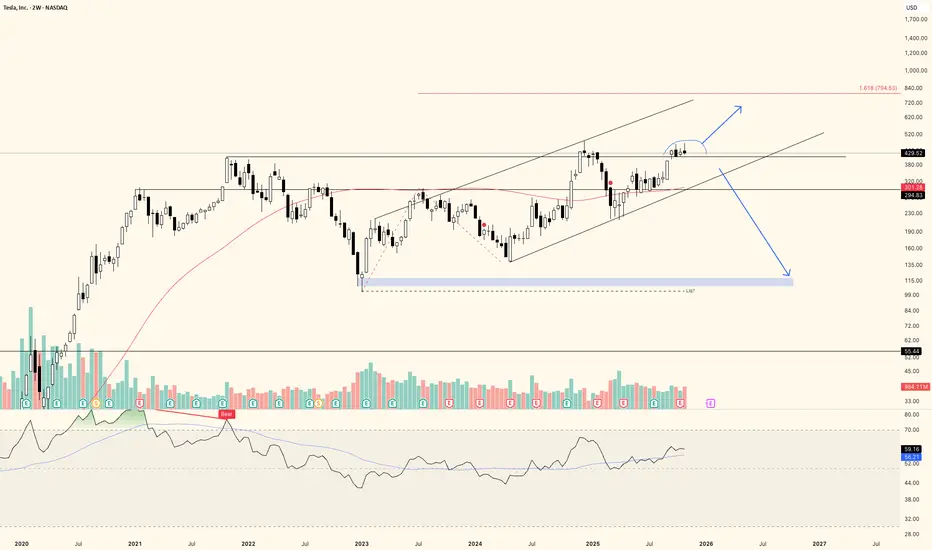
TSLA is giving mixed signals. Range low next move?I must say I have a very dualistic view on TSLA here. I think there is certainly a possibility of this becoming a prolonged consolidation with another move towards the downside of the range. On the other hand, that 1.618 extension to the upside als looks like a very valid target. Needless to say, while most people seem to stare blindly at TESLA great promises, I'm a little more skeptical to say the lest.
- Earnings have been going down over the years
- Revenue has stayed somewhat flat, with high odds of continuing to decline in China
- First their cars were going to change the world, then it was their energy solutions, then FSD became the narrative (Once done, FSD would instantly scale to worldwide usage and work everywhere, but currently their taxi service that would expand rapidly is geofenced), now Optimus is the narrative.
Elon is holding a carrot
- My point is: Elon is holding a carrot in front of us. I'm not saying Tesla is not doing great things. Their progress on FSD is real. But unless they will actually start to deliver real revenue and real profit, it will continue to be hyped up promises.
- For example, the EPS of XETR:VOW is 13x higher than Tesla's. Current Price to Earnings ratio for Tesla is at 300x.
So is it that weird to find that TA is giving mixed signals and possibly pointing towards range low?
Simple outlook
Anyway, this is my plan:
- I'll assume we are going up for 1.618 UNLESS
- We deviate back below previous ATH level. Then I think odds are starting to shift in favor of a bigger downward move.
Trade ideas
TSLA 3-Drive & ABCD Pattern – Path to $500 Before a PullbackThis chart highlights multiple harmonic and Elliott structures aligning for a potential bullish extension in Tesla (TSLA). A well-defined ABCD pattern and 3-Drive pattern suggest momentum building toward the $500 zone, supported by Fibonacci projections and channel resistance.
The current wave structure points to an imminent 5-wave advance, likely completing the “Drive 3” and pattern D confluence area near $500–505. Following that move, a corrective pullback (ABC) is anticipated, possibly retesting prior support near $440–400.
Key elements featured:
ABCD completion zone: around $500
3-Drive pattern: confirming exhaustion at upper trendline
Elliott 5-wave projection: short-term bullish continuation
Possible corrective phase: after the final wave up
📈 Watching for confirmation of Wave iii and potential exhaustion signals near $500 before considering downside setups.

1 trillion dollar pay package to elon muskTesla shareholders agreed to pay Elon Musk a package of 1 trillion dollars, and that's 12% of total gains if he reached his promised goal to shareholders of making Tesla the most valuable company in the world, and it stays that way for 5 years. If Musk delivers, the stock price should jump to 1000 dollars price per share in 5 years.
PS: If Musk misses the target but a few thousand dollars, he gets nothing. Hence, the current most valuable company is now Nvidia with a 5 billion dollar evaluation, and Tesla is currently worth 1.35 trillion.
TESLA Sellers In Panic! BUY!
My dear subscribers,
My technical analysis for TESLA is below:
The price is coiling around a solid key level - 429.39
Bias - Bullish
Technical Indicators: Pivot Points Low anticipates a potential price reversal.
Super trend shows a clear buy, giving a perfect indicators' convergence.
Goal - 446.44
About Used Indicators:
By the very nature of the supertrend indicator, it offers firm support and resistance levels for traders to enter and exit trades. Additionally, it also provides signals for setting stop losses
Disclosure: I am part of Trade Nation's Influencer program and receive a monthly fee for using their TradingView charts in my analysis.
———————————
WISH YOU ALL LUCK

$TSLA - Reaching $1050 in 2026 is NOT a Dream!I can't ignore how bullish Tesla stocks chart looks right now. A massive ascending triangle with horizontal resistance ($430) was broken upwards and currently the price is consolidating above it, the resistance also perfectly correlates with the 0.786 lvl by Fibo.
Taking into account the overall company's plan regarding its growth (talking about recent news that 75% of shareholders voted in favour of a compensation plan that could award Musk up to $1T in stock if Tesla could achieve $8.5T market capitalization) , we can easily expect NASDAQ:TSLA to reach point 1 by Fibo ($1050 mark) .
By the way, by pointing out to the news about providing $1T, I don't mean that Tesla could really achieve $8.5T market capitalization any time soon, if only in 10 years as the overall money supply is drastically increasing. This news highlights the plan, in other words - creative way of sharing what is their "plan maximum" in terms of 10 years.
I believe Tesla will cost $2T in 2026.

Tesla at a Breakout Crossroad
The Tesla (TSLA) daily chart shows a classic Cup & Handle pattern nearing a critical resistance zone. The key level sits around $450, aligning with a long-term descending trendline (in blue).
Technical Overview:
General Trend:
Since early 2025, TSLA has been in a steady uptrend.
The 50-day moving average (SMA 50) near $220 acts as strong dynamic support and is still trending upward.
The structure indicates Tesla is finishing the “handle” phase of the pattern — a decisive moment is approaching.
Bullish Scenario:
If the price breaks and holds above $450 with strong volume, it would confirm the Cup & Handle breakout.
Potential upside targets:
Short-term target: $503
Mid to long-term target: $565 (based on cup depth projection)
Stop loss: Below $410
A breakout above $450 could trigger a strong continuation rally as investors re-enter on technical confirmation.
Bearish Scenario:
Failure to break above $450 and a drop below $410 could invalidate the bullish setup, leading to a deeper correction.
Potential downside targets:
Short-term target: $375
Long-term target: $320
Stop loss: A confirmed close back above $445
This would suggest that the handle failed, and selling pressure could accelerate toward lower supports.
Timeframe Summary:
Short-term (1–3 weeks):
Expect consolidation between $410–$450, with bias toward a breakout if the tech sector remains strong.
Long-term (3–6 months):
A confirmed breakout above $450 opens the path toward $565.
If rejected, expect a correction toward $375, possibly forming a new accumulation base.

Last Tesla (Macro) chart before ATHATH NEXT!
If I'm wrong, then I have "strict invalidations" with minimal loses...because of "proper risk management".
If I'm right then I'm taking an extended vacation.
May the trends be with you.
My Last Tesla post before ALL TIME HIGHOn Oct 21st I said I was adding to my positions (price at the time below):
Some of my target hit. We may even go lower.
What do you think?
TSLA CCREALLY GOOD premium and volatility here.... wow. Pay package means
Buy low, sell high. It's at a high spot right now.

Tsla weekly chartI think it's time to sell tsla
We got a bad signal down trend candlestick & down trend RSI
GOOD LUCK 4ALL

TSLA QuantSignals V3 Weekly 2025-11-07TSLA QuantSignals V3 Weekly 2025-11-07
TSLA Weekly Signal | 2025-11-07
• Direction: NEUTRAL | Confidence: 55%
• Expiry: 2025-11-14 (8 days)
• Strike Focus: $400.00
• Entry Range: $4.07
• Target 1: $6.07
• Stop Loss: $2.43
• Weekly Momentum: BULLISH (+2.18% 1W)
• Flow Intel: Bearish (High P/C Ratio) | PCR 3.24
• Max Pain: $452.50 (-0.1% vs spot)
• 🔴 HIGH RISK WARNING: Use only small position size due to lower confidence and high uncertainty.
⚖️ Compliance: Educational commentary for QS Premium members only. No financial advice.
🎯 TRADE RECOMMENDATION
Direction: BUY PUTS
Confidence: 55%
Conviction Level: LOW
🧠 ANALYSIS SUMMARY
Katy AI Signal: NEUTRAL (50% confidence) with bearish bias - Target $445.95 (-1.5% downside), Stop Loss $459.69 (+1.5% upside)
Technical Analysis: Current price $452.90 trading near weekly range midpoint (62.0%). MACD momentum bullish but mixed timeframe signals. Strong trending regime (100% strength) supports swing trades. Key resistance at $474.07, support at $435.09.
News Sentiment: Mixed - Roadster reveal and Robotaxi expansion (bullish) offset by Musk pay package criticism and political headwinds. News flow suggests cautious sentiment.
Options Flow: Extremely bearish - Put/Call Ratio 3.24 indicates heavy institutional put buying. Max pain at $452.50 (-0.1% from spot), high volume at $468 put. Flow suggests downside protection.
Risk Level: MODERATE - Conflicting signals require careful risk management. Neutral AI confidence limits upside conviction.
💰 TRADE SETUP
Expiry Date: 2025-11-14 (8 days)
Recommended Strike: $400.00
Entry Price: $4.05 - $4.10
Target 1: $6.07 (50% gain from entry)
Target 2: $8.10 (100% gain from entry)
Stop Loss: $2.43 (40% loss from entry)
Position Size: 2% of portfolio
⚡ COMPETITIVE EDGE
Why This Trade: Bearish options flow (PCR 3.24) provides contrarian edge against mixed technicals. Max pain align
Image
QS Analyst
APP
— 10:49 PM
ment near current price creates favorable gamma positioning.
Timing Advantage: Thursday positioning with 8 days to expiry allows for volatility capture during weekly momentum confirmation.
Risk Mitigation: Conservative delta (-0.138) provides defined risk exposure. Stop loss at 40% protects capital in neutral environment.
🚨 IMPORTANT NOTES
Katy AI's neutral confidence (50%) limits directional conviction - treat as speculative trade
Conflicting signals between bullish MACD and bearish flow require careful monitoring
Position size should remain minimal given low conviction level
Be prepared to exit early if technicals flip bullish or options flow reverses
📊 TRADE DETAILS 📊
🎯 Instrument: TSLA
🔀 Direction: PUT (SHORT)
🎯 Strike: 400.00
💵 Entry Price: 4.07
🎯 Profit Target: 6.07
🛑 Stop Loss: 2.43
📅 Expiry: 2025-11-14
📏 Size: 2.0
📈 Confidence: 55%
⏰ Entry Timing: N/A
🕒 Signal Time: 2025-11-07 01:49:31 EST
🔴 HIGH RISK WARNING: Use only small position size due to lower confidence and high uncertainty.

News Momentum QuantSignals AI Screener 2025-11-06News Momentum QuantSignals AI Screener 2025-11-06
🎯 NEWS-DRIVEN MOMENTUM DETECTED
AI News Analysis Results
════════════════════════════════════════════════════════════════════════════════
💰 NEWS MOMENTUM SIGNALS
Generated: November 06, 2025 at 10:45 PM
════════════════════════════════════════════════════════════════════════════════
📊 5 Total Opportunities • ✅ 5 Ready to Trade • ⏸️ 0 Monitor
────────────────────────────────────────────────────────────────────────────────
┌─ #1 ✅ NYSE:JNJ • Score: 75/100 • ENTER NOW
│
│ 📅 DTE: 42 days
│ 🟢 Risk Level: Low Risk (2/10)
│
│ 📰 Catalyst: High-impact FDA approval for DARZALEX FASPRO, creating immediate revenue potential
│ 📊 Setup: Stock consolidating near $187 with regulatory catalyst providing breakout fuel
│ 🎯 Target: $195-200 within 2-3 weeks following approval momentum
│ 📈 Options: $190 CALL exp 2025-12-19
│
│ 💡 Trade - High conviction setup
│ ⚠️ Risk: Broad market weakness or unexpected regulatory hurdles for new drug adoption
└───────────────────────────────────────────────────────────────────────────────
┌─ #2 ✅ NASDAQ:AVGO • Score: 70/100 • ENTER NOW
│
│ 📅 DTE: 28 days
│ 🟡 Risk Level: Medium Risk (4/10)
│
│ 📰 Catalyst: Strong analyst bullishness on AI-driven growth prospects from Mizuho
│ 📊 Setup: At key $357 support level with institutional accumulation evident
│ 🎯 Target: $375-385 within 10-14 days on AI momentum continuation
│ 📈 Options: $360 CALL exp 2025-12-05
│
│ 💡 Trade - High conviction setup
│ ⚠️ Risk: AI sentiment shift or broader semiconductor sector rotation
└───────────────────────────────────────────────────────────────────────────────
┌─ #3 ✅ NYSE:TSM • Score: 65/100 • ENTER NOW
│
│ 📅 DTE: 35 days
│ 🟡 Risk Level: Medium Risk (4/10)
│
│ 📰 Catalyst: Needham Buy rating with N3 capacity boost accelerating revenue growth
│ 📊 Setup: Testing $290 resistance with positive analyst momentum
Image
building
│ 🎯 Target: $305-310 within 3-4 weeks on capacity expansion news flow
│ 📈 Options: $295 CALL exp 2025-12-12
│
│ 💡 Trade - Monitor entry timing
│ ⚠️ Risk: Geopolitical Taiwan tensions or semiconductor demand slowdown
└───────────────────────────────────────────────────────────────────────────────
┌─ #4 ✅ NYSE:XOM • Score: 60/100 • ENTER NOW
│
│ 📅 DTE: 21 days
│ 🟡 Risk Level: Medium Risk (6/10)
│
│ 📰 Catalyst: Dividend hike and record output milestones despite recent earnings pressure
│ 📊 Setup: Oversold at $114 after earnings sell-off, dividend catalyst provides support
│ 🎯 Target: $120-122 within 2 weeks on dividend attraction and output momentum
│ 📈 Options: $117.50 CALL exp 2025-11-28
│
│ 💡 Trade - Monitor entry timing
│ ⚠️ Risk: Continued oil price weakness overwhelming positive company-specific news
└───────────────────────────────────────────────────────────────────────────────
┌─ #5 ✅ NYSE:BAC • Score: 55/100 • ENTER NOW
│
│ 📅 DTE: 28 days
│ 🔴 Risk Level: High Risk (10/10)
│
│ 📰 Catalyst: Strong analyst pick status with earnings season bank sector rotation potential
│ 📊 Setup: Neutral at $53 but positioned for financial sector leadership shift
│ 🎯 Target: $56-57 within 10 days on sector rotation and analyst conviction
│ 📈 Options: $54 CALL exp 2025-12-05
│
│ 💡 Trade - Monitor entry timing
│ ⚠️ Risk: Interest rate uncertainty or broader financial sector weakness
└───────────────────────────────────────────────────────────────────────────────
────────────────────────────────────────────────────────────────────────────────
📖 QUICK GUIDE:
✅ ENTER NOW → High probability setup, optimal timing, low-medium risk
⏸️ WAIT → Monitor for better entry or catalyst resolution
🟢 Low Risk → Heat 1-3 (stable, far from catalysts)
🟡 Med Risk → Heat 4-6 (moderate volatility)
🔴 High Risk → Heat 7-10 (near catalysts, high volatility)
💎 Position Sizing: 2-5% per trade • Max 2-3 concurrent positions
🎯 Exit Strategy: Take profit at 50%
max gain or stop at 2x loss
════════════════════════════════════════════════════════════════════════════════

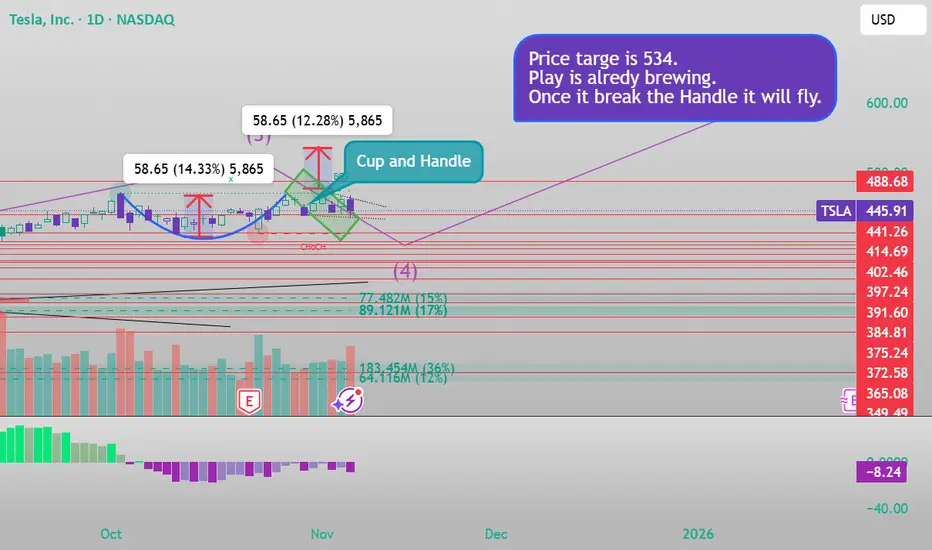
Cup and handleYou can see the cup and Handle in the Daily timeframe. It Will fly soon. My price target is 534 once it break the handle. You see this here at first.
X
@Sandeep194924
Tesla / Palantir Fractal STILL playing out STRANGELY ACCURATEMillions of people
...buying Trillions of dollars of assets
...at random times
...on random days
but somehow these 2 assets move together on the x-axis & the y-axis??
Cansomeone explain this to me mathematically?
May the Truth be with you.

TESLA PT-2 TRILLION DOLLAR PAY CHECKI hope everything is clear now. I have exited all positions here and I am not going into news.
Elon is not going to tell me where my money is going
NOTE:NOT TRADING TSLA

$TSLA – Breakout Setup Targeting ATHs → $500 ZoneTesla ( NASDAQ:TSLA ) looks ready for liftoff. After months of absorbing negative headlines and post-earnings volatility, it’s finally setting up for a major breakout that could take it back to all-time highs — and possibly the $500 level.
🔹 The Setup:
NASDAQ:TSLA has shaken off every piece of bad news — earnings, delivery headlines, margin fears — all absorbed without breaking trend.
The stock is now coiling under major resistance, and the tape is showing accumulation.
The narrative has flipped from “EV slowdown” to autonomous driving and robotics, giving the stock new life.
🔹 Why This Setup Has Juice:
It’s the last major leader yet to make a big move — the rotation setup is real.
Market sentiment is improving, and NASDAQ:TSLA is showing relative strength.
Volume expansion here could mark the start of the next major leg higher.
🔹 My Trade Plan:
1️⃣ Position: Added $500 calls (2 weeks out) at the open this morning.
2️⃣ Stop: If the stock goes under $450, I’m out — keeping risk tight.
3️⃣ Targets: First stop at ATHs, then a potential run toward $500 if momentum holds.
Why I Love This Chart:
The structure is perfect — long base, trendline reclaim, sector rotation lining up.
NASDAQ:TSLA has flipped from “bad news reaction” to “no sell reaction,” a clear sentiment shift.
Risk/reward is ideal here with a tight stop and clear upside roadmap.
TESLA NOV 6 TRILLION DOLLAR PAY CHECKToday is the day for a lot of people with hope. Be careful & trade smartly.
I have explained the price action here.
YES I AM LONG
NOTE:IV IS HIGH SO STAY AWAY FROM OPTIONS

Tesla – Demand Reclaim After Liquidity SweepTesla swept liquidity below 440 and reacted strongly from a clean demand zone.
The bearish leg completed a full imbalance fill, and price is now rejecting that discount area.
As long as price stays above 440, I’m expecting continuation toward 470–474 (previous supply zone).
If 436 breaks, the bullish idea becomes invalid and deeper reaccumulation may follow.
#TSLA #SmartMoneyConcepts #LiquiditySweep #FVG #PriceAction #ICT #Stocks

TSLA Triple TopTriple tops = market drop!
As soon as the market tanks, TSLA is in major trouble!
For 5 long years, people have been trying to pump this stock with no good results. Instead, they got a -75% decline and a -66% decline for their efforts.
This stock will fall bidless! All hype with no substance.
The question is, will the market stay up long enough to push it up one more time and sucker in the last fools before the kiss of death? We shall see!
It's now or never!
I am proudly shorting it! As I have successfully done twice before with huge gains. I am telling you, fanboys, point-blank before I get all the hate posts. ))

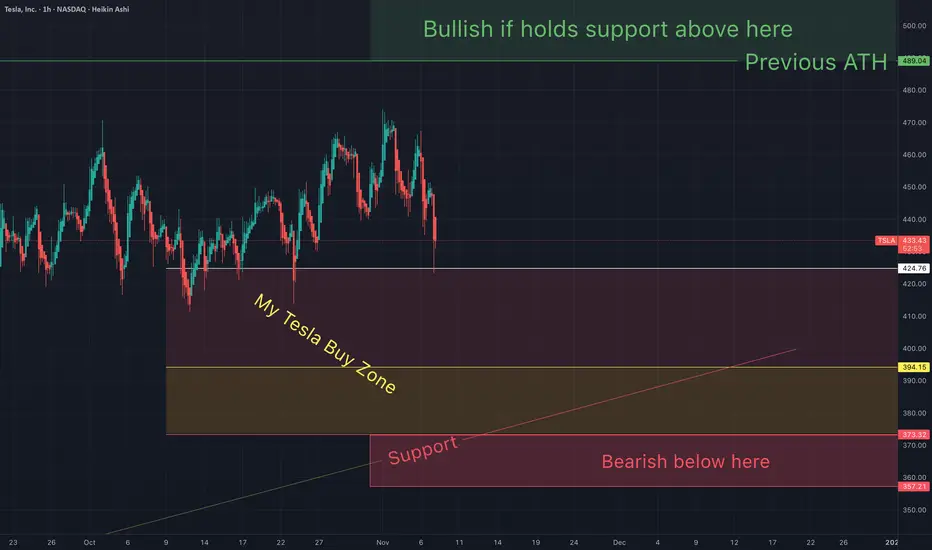
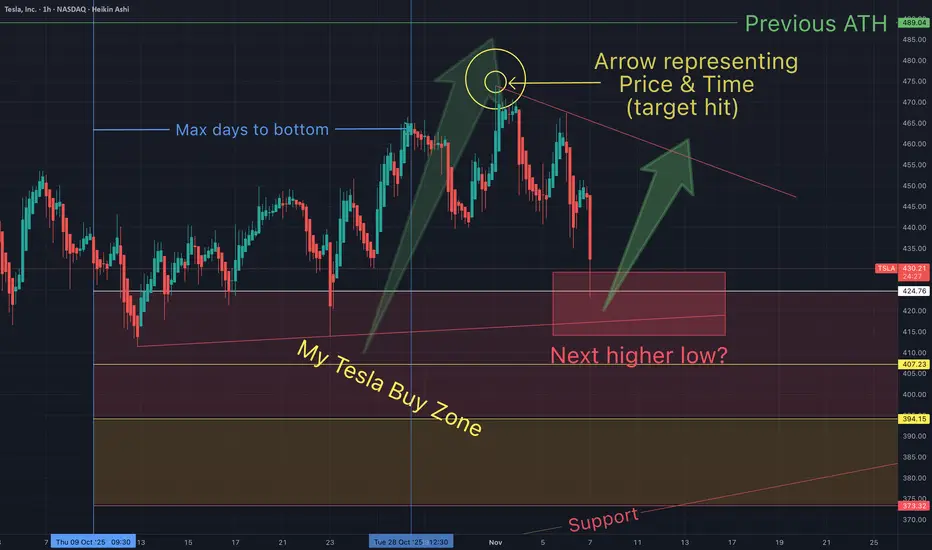
Tesla Inc. (Nasdaq: $TSLA) Eyes Breakout Above $490Tesla Inc. (Nasdaq: NASDAQ:TSLA ) is approaching a critical technical juncture as price action consolidates near the upper end of its ascending trendline. After rebounding strongly from the $180–$200 demand zone earlier this year, Tesla has maintained a steady uptrend, forming higher lows and higher highs — a classic bullish structure.
Currently trading near $440, Tesla has encountered resistance below the $490–$492 zone, which marks the previous swing high. The chart shows a clear ascending support line extending from the April low, reinforcing the overall bullish sentiment. As long as the stock holds above $420, bulls remain in control. A confirmed breakout above $492 could ignite the next leg higher, targeting the $520–$540 region in the medium term.
Volume analysis shows healthy participation during recent rallies, while the RSI hovering around 50 suggests moderate strength without signs of overbought conditions. This balance indicates potential for further upside before exhaustion sets in.
The projected path shown on the chart outlines a short-term pullback toward support, followed by a continuation rally through resistance. Such a move would confirm bullish momentum and possibly trigger a new wave of investor confidence as Tesla heads into the next earnings season.
However, if Tesla fails to maintain the ascending trendline, a dip below $410 could expose the stock to deeper retracement toward $380, testing previous breakout levels.
Overall, Tesla’s structure remains technically constructive. The uptrend is intact, supported by volume and strong higher-lows formation. Traders are closely watching for a decisive breakout above $492, which could mark the beginning of a fresh rally phase as market sentiment leans bullish on tech and EV momentum.

Dip to 449 and revers along with RSI divergenceTSLA can di tomorrow to 449 and reverse. a great swing possible with 449 entry l;eading to 460+
$TSLA: Gravity Reasserts ItselfGreetings, traders.
The NASDAQ:TSLA chart is currently painting a picture of a profound test of market physics. This isn't a "battle"; it's a conflict of impersonal forces.
On one side, we have "Lift"—the powerful, almost unnatural force of a narrative focused on AI, robotics, and a limitless future. This force defies traditional valuation and pushes the price to high altitudes.
On the other, we have "Gravity"—the undeniable, constant pull of fundamental reality, which just made itself known in the Q3 earnings report.
The chart is our laboratory, and we are here to observe these forces at work.
The Technical Landscape
The Macro View: The weekly chart shows the narrative's 'Lift' failing at a critical altitude. The price has been decisively rejected from the " gravitational ceiling " of its multi-year ascending channel (approx. $480-$500). This is a level where the weight of reality has consistently proven too strong. The most recent large, bearish candle is not an attack; it is simply the pull of gravity reasserting its dominance over upward momentum.
The Tactical View: The daily chart shows why this 'Lift' is failing. We saw a classic bearish MACD divergence on the final push to the highs—price floated higher, but the underlying force (momentum) was fading. The MACD has now crossed bearishly, confirming the shift. Price is now coiled in a tight daily wedge, a tactical "decision point" where we will see if 'Lift' can be re-established or if 'Gravity' will take full control.
The Philosophy: A Tale of Two Forces
To understand NASDAQ:TSLA $, you must understand the two opposing forces that define its physics.
The 'Lift' (The Narrative Camp): The bull case is a qualitative vision. It's about Robotaxis, Optimus, and AI. This crowd is rightfully unconcerned with a single quarter's auto margins because, in their view, they are buying a different company—one that exists 10 years in the future. Their conviction is deep and provides a powerful upward force.
The 'Gravity' (The Quantitative Camp): The bear case is a spreadsheet. It's about the "now." The Q3 earnings report is the catalyst for this "counter-force."
EPS Miss ($0.50$ vs $0.53$) Severe margin compression from aggressive price cuts. A fundamentals-based valuation (e.g., Morningstar's $250 FVE) that is miles away from the current price.
This setup is a clear piece of the puzzle.
It shows what happens when the powerful force of 'Lift' (Narrative) reaches its apex and meets the immovable, constant pull of 'Gravity' (Macro Supply + Fundamental Reality). At this specific junction, 'Gravity' is in control.
An Illustrative Setup
We do not predict; we observe and we react.
The confluence of a failing 'Lift' at a 'gravitational ceiling,' combined with the new "weight" of a fundamental catalyst, provides a high-probability, asymmetric setup. This is not about being "right"; it is about defining risk.The chart illustrates a potential short setup based on this confluence:
Entry: ~ $435.00$ (Sell Short)
Stop-Loss: ~ $486.00$
Target: ~$282.00$
Risk-to-Reward Ratio: ~3
The confirmation for this thesis would be a breakdown from the daily wedge (around $430), signaling that 'Gravity' has taken firm hold.The stop-loss at $486$ is the "escape velocity" point. If the price breaks above it, the 'Lift' force has overcome 'Gravity,' the thesis is invalidated, and we step aside.
One cannot argue with the market's physics.
Respect the level; it is your anchor to reality.
Disclaimer: This is not financial advice. It is for educational and informational purposes only. Please conduct your own research and manage your risk accordingly.
TSLA next leg up.RSI- is looking good for a move up because of the descending tops, once you break the resistance line you will fly.
Moving averages- My yellow and blue are good for telling longer term upside, and they are at the point of where the blue will be above the yellow.
Repetition- a lot of patterns end in threes, so assuming this looking back in time we have seen two legs up, and we are due for a third. The orange vertical lines pinpoint these areas.
Clear rising trend lines over years.
The price targets are up to you, but mine are 4000-7500.
