US30 CPI trade idea 12-aug-2025Expecting sharp move down side at cpi event, an dgrap sell side liquidity than whole day upside , expecting to grap buy side liquidity
DJI trade ideas

US30 (Dow Jones) 4H Chart AnalysisPotential Head & Shoulders Breakdown
Pattern: Head and Shoulders
Breakout Zone: ~44,796
Retest Expected before potential continuation lower
Entry: After confirmed rejection near 44,796 (retest zone)
Target: 43,738 (TP zone based on previous support)
Stop Loss: Above recent high (~44,837)
📉 If price respects the neckline and fails to break back above, I’ll be looking for short opportunities with favorable risk-reward.

US30-ShortBecause Powell is not lowering interest rates and due to seasonality factor US30 is a clear short in the month of August
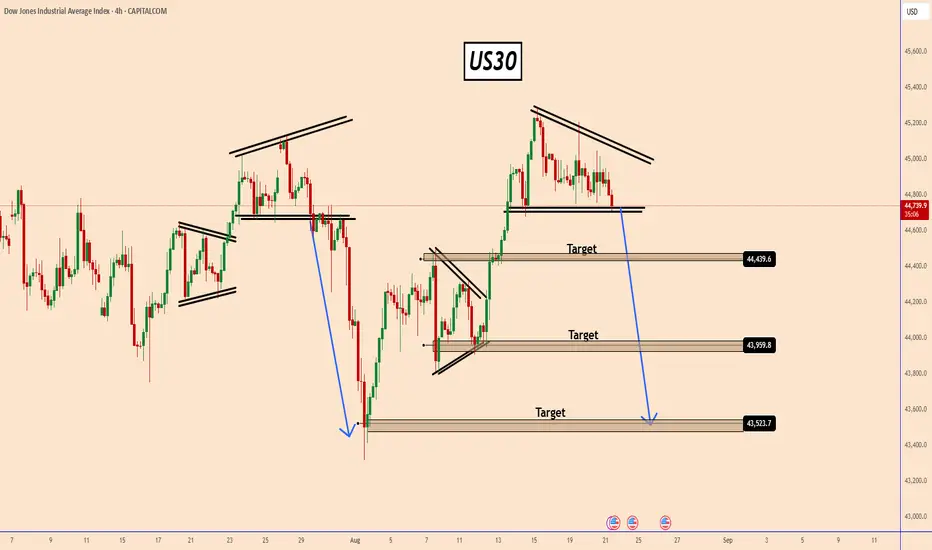
US30 breaks below the current market structureUS30 On the left side of the chart, we observed that after breaking below the second major pattern, the US30 experienced a sharp and aggressive decline. A similar structure appears to be forming once again, and notably, the index has just printed another all-time high.
If the price breaks below the current market structure—mirroring the previous breakdown—there is a strong possibility of another significant sell-off. This scenario becomes more likely if we see a clear shift in momentum toward the bearish side.
A confirmed breakdown could trigger a repeat of the past decline, especially if key support levels fail to hold and bearish volume increases.
You may find more details ion the chart.
Trade wisely best of Luck .
Ps; Support with like and comments for better analysis Thanks for supporting.
US30 Bearish Breakout!
HI,Traders !
#US30 made a bearish
Breakout of the key horizontal
Level of 45060.1 which is now
A resistance and the breakout
Is confirmed so we are bearish
Biased and we will be expecting
A further bearish move down !
Comment and subscribe to help us grow !
US30 Short Trade - Important to hit 44,600CAPITALCOM:US30 Short Trade
Entry: 44930 - 45,008
TP: 44,600
This is good trade.
Don't overload your risk like Greedy gambler!!!
Be Disciplined Trader, what what you can afford.
Use proper risk management.
Disclaimer: Trading is risky, only idea, not advice.

Just An IdeaWhen we can clear some lq and get ready to sell on this it gonna be smooth and quick once there aint any more uncertainty in the market

DJIA bull flagging ahead of 45KThe Dow has opened lower, but with all eyes on the Fed's Powell tomorrow the weakness can be explained away in part by profit-taking. Whether this turns into something more signifcant remains to be seen.
For now, the bullish trend is intact. The 45,000 level has been tested multiple times since November 2024, and this level has held as resistance every single time. Most recently, it was Friday when it finally looked like the bulls were given the all-clear. But the index turned lower to close below that hurdle and again frustrated the bulls.
So far, though, the downside has been limited on this latest failed breakout attempt. This suggests that the index is still gearing up for a potential breakout.
Short-term support at 44,750 has held so far this week, and was being tested again at the time of writing. Below here, 44,500 and then 44,300 are the next key short-term support levels. Even if we see renewed weakness here, so long as the long-term support in the range between 42,800 to 43,150 holds, the path of least resistance would still remain to the upside in so far as the slightly longer-term is concerned. Here, we also have the 200-day average residing.
By Fawad Razaqzada, market analyst with FOREX.com

US30: Will History Repeat Itself?US30: Will History Repeat Itself?
On the left side of the chart, we can see that after breaking below the second pattern, US30 experienced a sharp bearish move.
Now, a similar pattern is forming, and the index has just printed another historical high. If price breaks below the current structure—just as it did previously—there’s a strong possibility of another aggressive drop.
A breakdown could trigger a repeat of the past sell-off, especially if momentum shifts to bearish and if Powell makes interesting comments at the Jackson Hole Symposium.
You may find more details in the chart!
Thank you and Good Luck!
PS: Please support with a like or comment if you find this analysis useful for your trading day
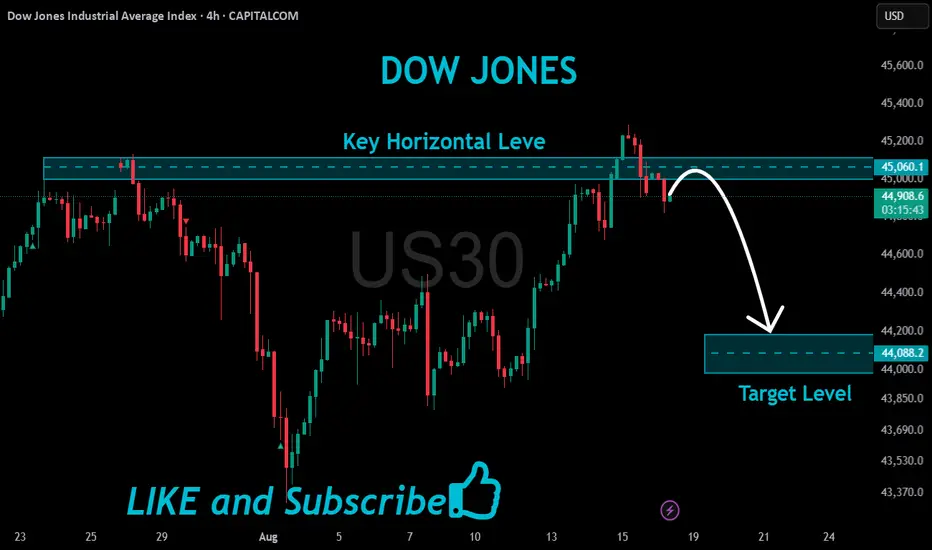
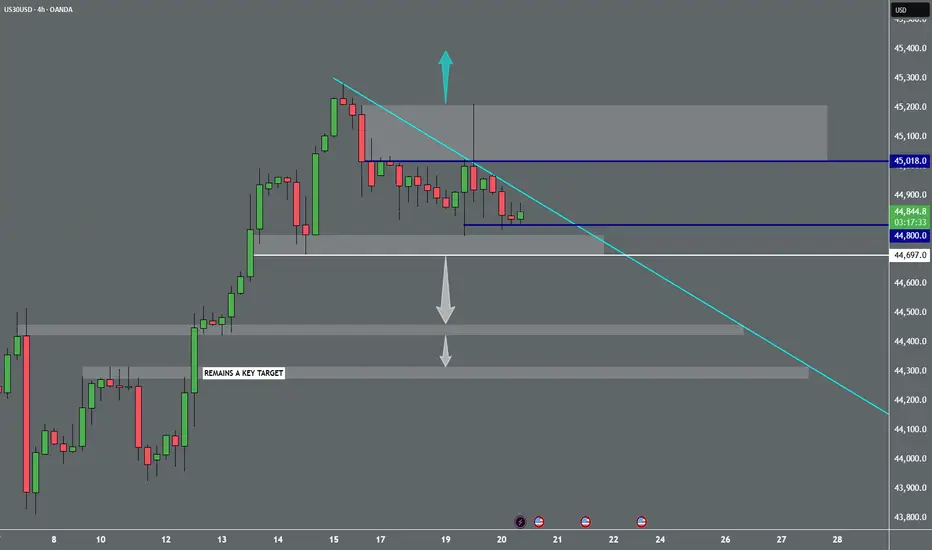
DowJones corrective pullback support at 44380Key Support and Resistance Levels
Resistance Level 1: 45400
Resistance Level 2: 45660
Resistance Level 3: 46000
Support Level 1: 44380
Support Level 2: 44080
Support Level 3: 43675
This communication is for informational purposes only and should not be viewed as any form of recommendation as to a particular course of action or as investment advice. It is not intended as an offer or solicitation for the purchase or sale of any financial instrument or as an official confirmation of any transaction. Opinions, estimates and assumptions expressed herein are made as of the date of this communication and are subject to change without notice. This communication has been prepared based upon information, including market prices, data and other information, believed to be reliable; however, Trade Nation does not warrant its completeness or accuracy. All market prices and market data contained in or attached to this communication are indicative and subject to change without notice.

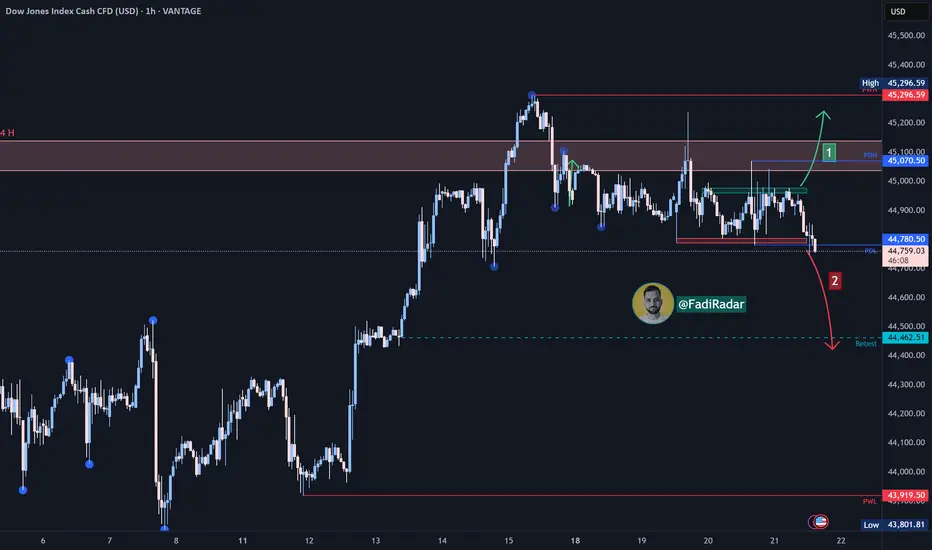
Dow Jones Index Analysis (US30 / Dow Jones):The index is currently trading in a general uptrend, while showing a consolidation phase on the hourly timeframe, testing a support zone near 44,780.
🔼 Bullish Scenario:
If bullish momentum builds and price breaks above 45,000 with confirmation, the index may head toward 45,200, and with continued buying pressure, new highs could be seen.
🔻 Bearish Scenario (Most Likely):
If the price breaks below 44,750 and holds beneath it, the index could move down to test 44,600, and with further selling pressure, a drop toward 44,500 is possible.
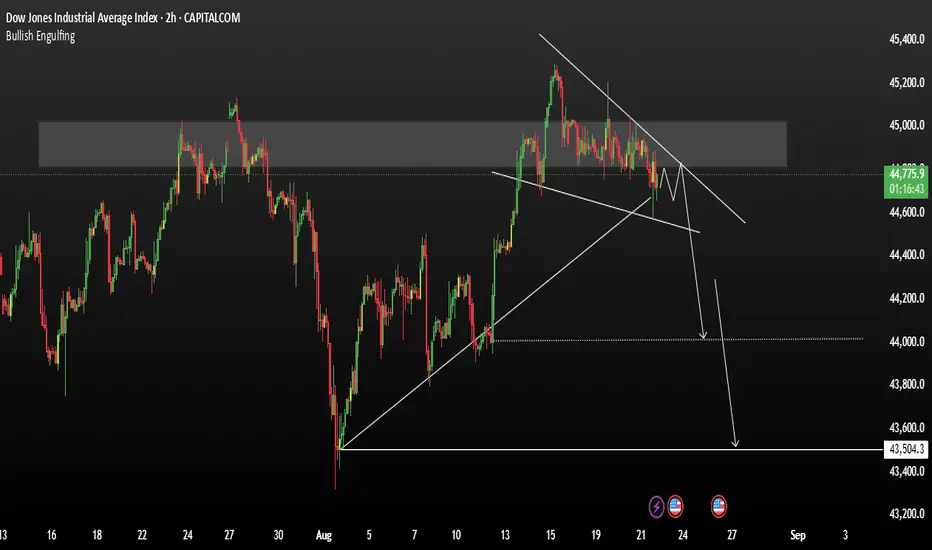
SHORT DJ / US30 READINGBreakout Of Trendline
Entry Price .... 44,820.32
US30... 44,820.32
S/L ...44,950.0
T/P ...44,500.0
And More

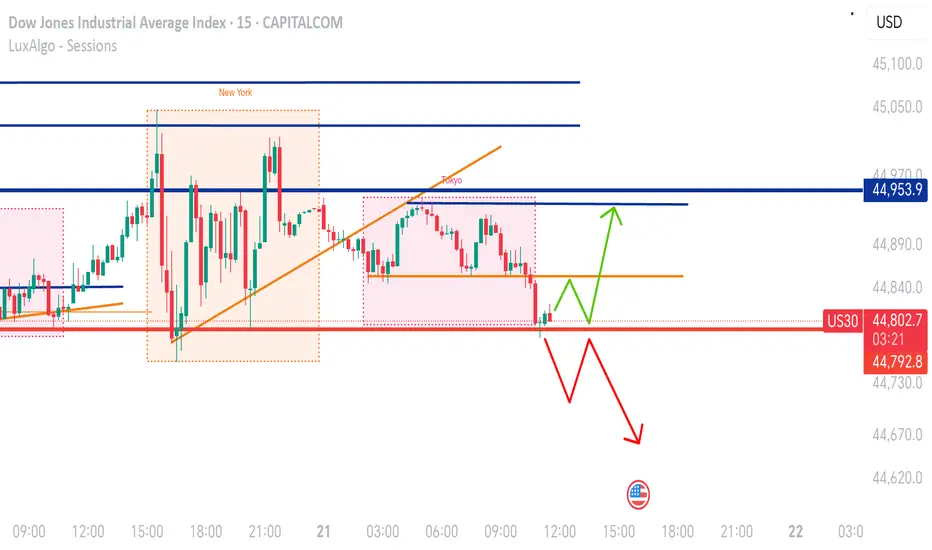
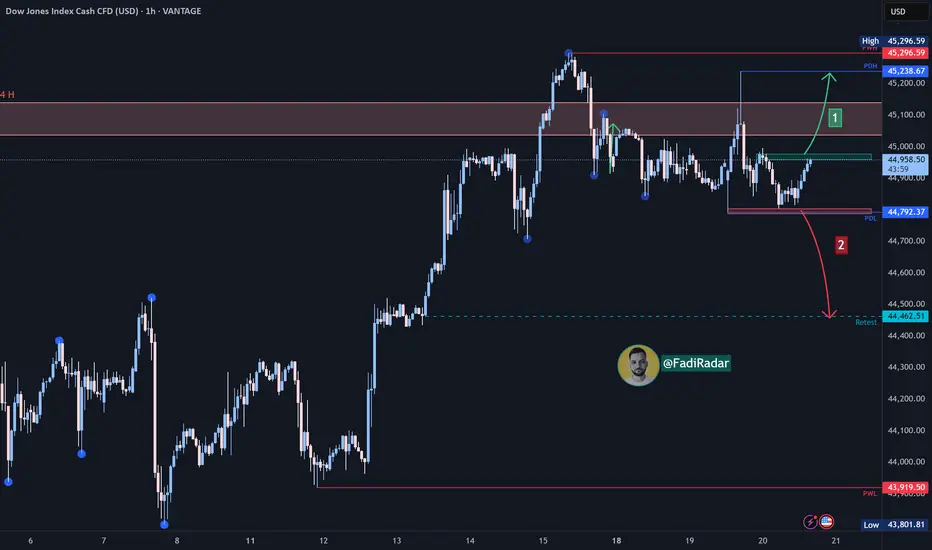
M15 Outlook on US30The market is currently ranging within the channel between the 44,953.9 resistance zone and the 44,792.8 support zone I’ve identified. If price breaks below, I’ll wait for a retest before entering. Alternatively, I’ll look to enter on a reversal if a new candle forms within the channel or above the support trendline.
US30 Technical Breakdown – 08/21/2025📍 US30 Technical Breakdown – 08/21/2025
US30 still hovering around 44,860, stuck in a tight range between 44,761–44,899. Price is consolidating under the major 45,076 resistance, forming a potential coiling pattern for the next move.
Bulls defended 44,761 multiple times — but without a break above 45,076, momentum stays capped. Sellers will look to exploit a breakdown toward 43,982.
📊 Market Behavior:
🔹 Sideways chop in a narrowing range
🔹 EMAs flatlining → market in balance
🔹 Repeated rejections at 45k
📌 Key Levels:
Resistance: 44,899 → 45,076 → 45,200
Support: 44,761 → 44,814 → 43,982
🧠 Bias:
Neutral → awaiting breakout confirmation.

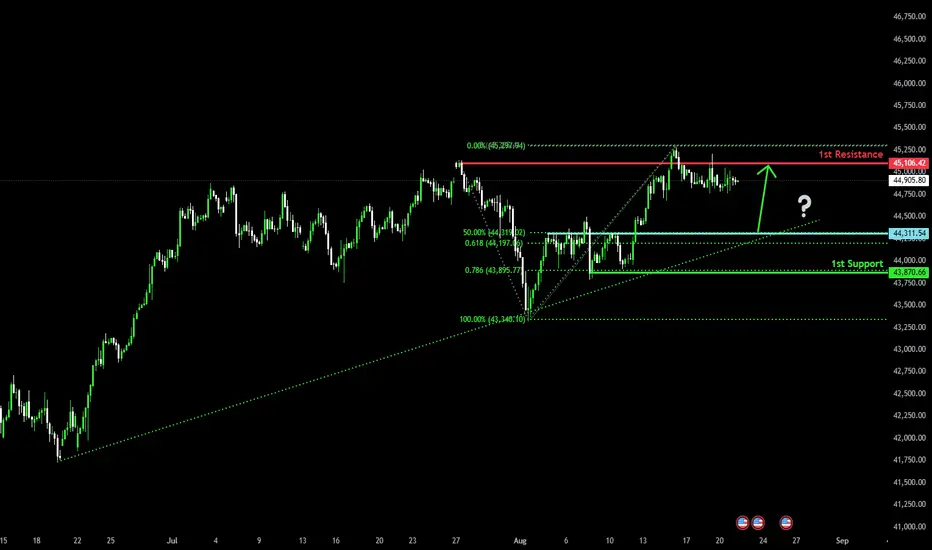
Could we see a bounce from here?Dow Jones (US30) is falling towards the pivot, which acts as a pullback support and could bounce to the 1st resistance, which is a multi-swing high resistance.
Pivot: 44,311.54
1st Support: 43,870.66
1st Resistance: 45,106.42
Risk Warning:
Trading Forex and CFDs carries a high level of risk to your capital and you should only trade with money you can afford to lose. Trading Forex and CFDs may not be suitable for all investors, so please ensure that you fully understand the risks involved and seek independent advice if necessary.
Disclaimer:
The above opinions given constitute general market commentary, and do not constitute the opinion or advice of IC Markets or any form of personal or investment advice.
Any opinions, news, research, analyses, prices, other information, or links to third-party sites contained on this website are provided on an "as-is" basis, are intended only to be informative, is not an advice nor a recommendation, nor research, or a record of our trading prices, or an offer of, or solicitation for a transaction in any financial instrument and thus should not be treated as such. The information provided does not involve any specific investment objectives, financial situation and needs of any specific person who may receive it. Please be aware, that past performance is not a reliable indicator of future performance and/or results. Past Performance or Forward-looking scenarios based upon the reasonable beliefs of the third-party provider are not a guarantee of future performance. Actual results may differ materially from those anticipated in forward-looking or past performance statements. IC Markets makes no representation or warranty and assumes no liability as to the accuracy or completeness of the information provided, nor any loss arising from any investment based on a recommendation, forecast or any information supplied by any third-party.
Dow Jones Index Analysis (US30 / Dow Jones):The index is currently in an overall uptrend, moving within a corrective downward channel on the hourly timeframe, with some recovery in prices at today’s market open.
🔺 Bullish Scenario :
If bullish momentum continues and price holds above 45,000, the index may target 45,200, and with strong buying pressure, we could see a new high.
🔻 Bearish Scenario (Also Possible):
If the price rejects near 44,980 and breaks below 44,800 with confirmation, the index could head toward 44,600, and with further selling pressure, it may drop to 44,500.
US30 BuyUS30 displaying an uptrend, and price retraced back to an AOI
Targeting the last high created. let's see if price proceeds accordingly
Like & comment your thoughts
Follow for more ideas

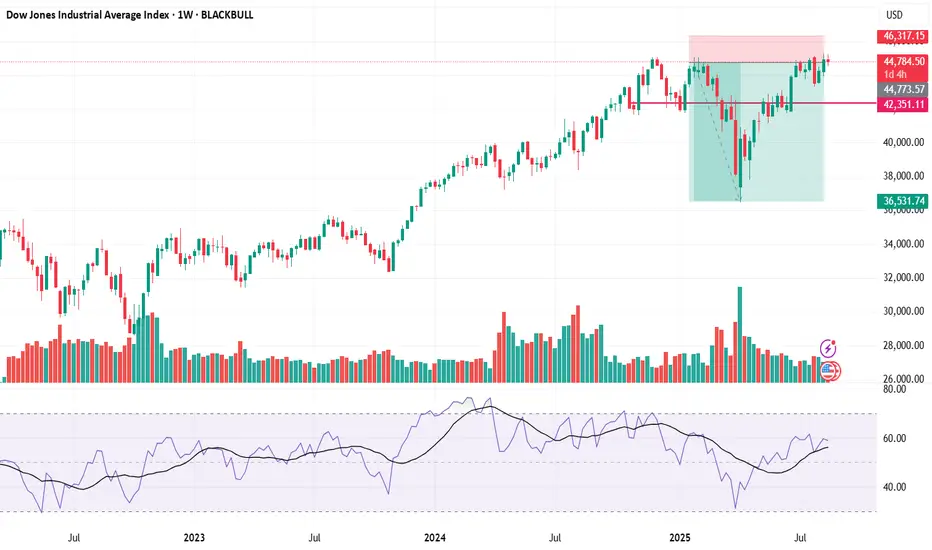
DOW JONES Double MA50 Support Zone coming to the rescue?Dow Jones (DJI) has been trading within a 4-month Channel Up and following the recent High, the price started to pull-back ahead of this week's major macroeconomic events.
By doing so, it has approached the 4H MA50 (blue trend-line), which has been the first line of Support inside this pattern. The previous (Higher) Low of the Channel Up was priced on the 1D MA50 (red trend-line) and the 2 form the strongest medium-term Support Zone at the moment.
With even the 4H RSI fractals identical, the current price action resembles the June 12 one, post 1D MA50 Low (May 23). Even if the 4H MA50 breaks, the trend will remain bullish unless it closes a 1D candle below the 1D MA50 (which would also be an invalidation of the Channel Up).
The most common rise on a Bullish Leg on this pattern has been +9.00%. As a result, our Target is 47200 as we enter September.
-------------------------------------------------------------------------------
** Please LIKE 👍, FOLLOW ✅, SHARE 🙌 and COMMENT ✍ if you enjoy this idea! Also share your ideas and charts in the comments section below! This is best way to keep it relevant, support us, keep the content here free and allow the idea to reach as many people as possible. **
-------------------------------------------------------------------------------
Disclosure: I am part of Trade Nation's Influencer program and receive a monthly fee for using their TradingView charts in my analysis.
💸💸💸💸💸💸
👇 👇 👇 👇 👇 👇

US30 ShortElite Analysis
All confirmation were met
Targeting lower liquidity pools
Executed in a smaller time frame

US30 - Market Structure, Confluence & FIBDear Friends in Trading,
How I see it,
Keynote:
Potential for price action to remain in limbo till Friday remains high.
Decisive breakouts required either way.
Just sharing my thoughts - (I have no evidence to back this up)
I'm keeping an eye on this one, maybe it's lagging behind NASDAQ.
Let me know if anything is unclear.
I sincerely hope my point of view offers a valued insight.
Thank you for taking the time study my analysis.
DJIthis is DJI daily chart ...
a self explainatory chart ...
from the lows,
looks like we have completed 5 waves in DJI...
if this top is not broken , we are surely going down ...
I am expecting DJI have completed 5 of 5 of V...
and its time for it to start downward journey
Just a view!
Vedang ! :)
Disclaimer: Chart is for study purpose only!!

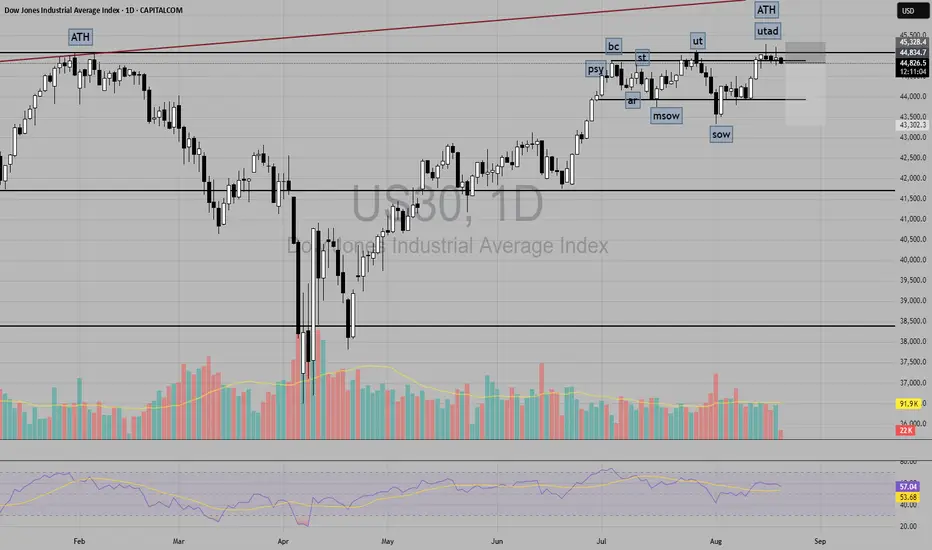
US30 possible distributionThe most noticeable domination of supply from UT to SOW.
Looking at UTAD there is no confirmation in supply strength yet, but the demand side appears exhausted.