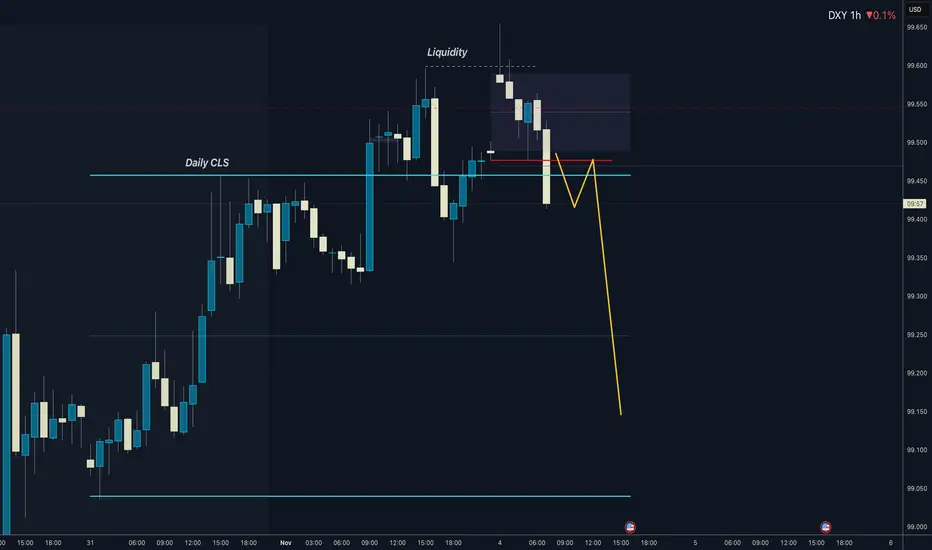
Dollar I Daily CLS I Model 1 ( Counter trend setup) Hi friends, new range created. As always we are looking for the manipulation in to the key level around the range. Don't forget confirmation switch from manipulation phase to the distribution phase to make the setup valid. Stay patient and enter only after change in order flow. If price reaches 50%
About U.S. Dollar Index
The U.S. Dollar Index tracks the strength of the dollar against a basket of major currencies. DXY was originally developed by the U.S. Federal Reserve in 1973 to provide an external bilateral trade-weighted average value of the U.S. dollar against global currencies. U.S. Dollar Index goes up when the U.S. dollar gains "strength" (value), compared to other currencies. The following six currencies are used to calculate the index:
Euro (EUR) 57.6% weight
Japanese yen (JPY) 13.6% weight
Pound sterling (GBP) 11.9% weight
Canadian dollar (CAD) 9.1% weight
Swedish krona (SEK) 4.2% weight
Swiss franc (CHF) 3.6% weight
Euro (EUR) 57.6% weight
Japanese yen (JPY) 13.6% weight
Pound sterling (GBP) 11.9% weight
Canadian dollar (CAD) 9.1% weight
Swedish krona (SEK) 4.2% weight
Swiss franc (CHF) 3.6% weight
Related indices
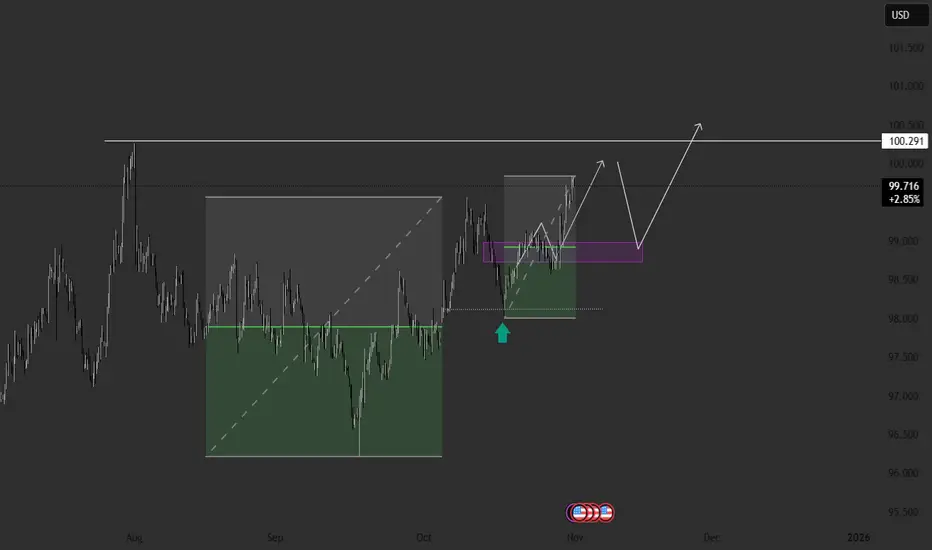
DOLLAR INDEX (DXY): Confirmed Bullish ContinuationThe DOLLAR INDEX appears to be showing bullish tendencies from both daily and intraday perspectives.
From a daily timeframe, I observe a confirmed breakout of a resistance line within a symmetrical triangle pattern, indicating a trend violation and continuation.
On an hourly timeframe, we see a br

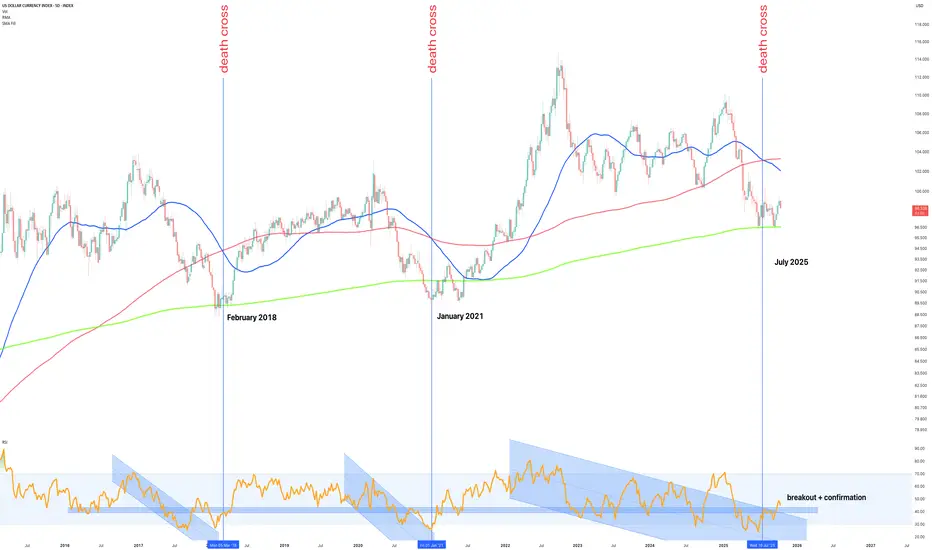
The Dollar Death Cross that marks the beginning – October 2025The term death cross often sends shivers through markets, but in the case of the US Dollar Index (DXY), it’s proven to be quite the opposite.
History tells us that every major death cross on the 5-day chart where the short-term 50 day simple moving average (SMA) crosses below the 200 day long ter
DXY Near 100 as Rate-Cut Odds Fade and Uptrend Remains IntactHey Traders,
In today’s trading session we are monitoring the US Dollar Index (DXY) for a buying opportunity around the 100.000 zone. The Index is trading in a broader uptrend and currently is in a correction phase, approaching the trend support/resistance area near 100.000.
Structure:
The prevaili

DXY: Bullish Breakout in Progress -> Eyes on 101.75 and 103.40DXY: Bullish Breakout in Progress -> Eyes on 101.75 and 103.40
The Dollar Index (DXY) is showing strong bullish momentum on the daily chart, breaking above a key consolidation pattern.
The price broke our structure from 99.50 above and favors further growth.
The next resistance zones sit around

DXY Selling view watch chart📉 DXY Update (4H Timeframe)
DXY currently reacting from the 100.300 supply zone, following selling pressure from the 100.000 level.
🔹 Technical Outlook:
Resistance / Supply Zone: 100.000 – 100.300
Support Levels: 99.800 🟡 | 99.500 🟢
Bias: Bearish below 100.000
💡 Price action shows signs of re

03.11.25 Morning ForecastPairs on Watch -
FX:AUDUSD
FX:NZDJPY
A short overview of the instruments I am looking at for today, multi-timeframe analysis down to what I will be looking at for an entry. Enjoy!

DXY Analysis — Bulls at 100: Continuation or Correction?In my latest DXY analyses, I mentioned that the index could reverse and push higher, with the 100 figure acting as a key zone to watch for bulls.
Indeed, on Friday the index climbed right into this area and is now showing signs of minor consolidation.
The key question now:
👉 Will the DXY manage to

DXY Weekly Outlook – Two Key Scenarios AheadAs expected in the previous review, the price has reached the local point B.
Now the market stands at a crossroads, so let’s look at the possible scenarios for the upcoming week.
Plan A – Correction Within the Daily Order Flow
The first scenario suggests a slight correction.
The price may move int
DXY has started a new long-term Bullish Leg to 103.500.Four months ago (June 26, see chart below) we gave a strong Buy Signal on the U.S. Dollar Index (DXY), which in a month's time it hit our 100.000 Target:
Now we see the 3-year Channel Down starting the next Bullish Leg having priced its bottom (Lower Low) on September 17. As you can see this is

See all ideas
Summarizing what the indicators are suggesting.
Oscillators
Neutral
SellBuy
Strong sellStrong buy
Strong sellSellNeutralBuyStrong buy
Oscillators
Neutral
SellBuy
Strong sellStrong buy
Strong sellSellNeutralBuyStrong buy
Summary
Neutral
SellBuy
Strong sellStrong buy
Strong sellSellNeutralBuyStrong buy
Summary
Neutral
SellBuy
Strong sellStrong buy
Strong sellSellNeutralBuyStrong buy
Summary
Neutral
SellBuy
Strong sellStrong buy
Strong sellSellNeutralBuyStrong buy
Moving Averages
Neutral
SellBuy
Strong sellStrong buy
Strong sellSellNeutralBuyStrong buy
Moving Averages
Neutral
SellBuy
Strong sellStrong buy
Strong sellSellNeutralBuyStrong buy
Displays a symbol's price movements over previous years to identify recurring trends.
Frequently Asked Questions
The current value of U.S. Dollar Index is 99.703 USD — it has fallen by −0.20% in the past 24 hours. Track the index more closely on the U.S. Dollar Index chart.
U.S. Dollar Index reached its highest quote on Feb 25, 1985 — 164.720 USD. See more data on the U.S. Dollar Index chart.
The lowest ever quote of U.S. Dollar Index is 70.698 USD. It was reached on Mar 17, 2008. See more data on the U.S. Dollar Index chart.
U.S. Dollar Index value has increased by 0.83% in the past week, since last month it has shown a 1.90% increase, and over the year it's decreased by −3.85%. Keep track of all changes on the U.S. Dollar Index chart.
U.S. Dollar Index is just a number that lets you track performance of the instruments comprising the index, so you can't invest in it directly. But you can buy U.S. Dollar Index futures or funds or invest in its components.